Yecheng Wu, Ph.D.
Creating a spatial database often involves the acquisition of huge amounts of data from paper maps. The acquisition is usually performed with hand-operated digitizing tablets, following procedures that are time-consuming, costly, and error-prone. Efforts to develop systems and effective techniques for automatic input of paper maps over the past 20 years have found limited success. Only recently have substantial advances in both computer hardware and software been achieved in this field. We have developed a software system, R2V for Windows & NT, for the purpose of automatic paper map input and raster image to vector conversion. Image processing techniques are developed for automated digitizing of contour maps, land use maps, parcel maps, tax maps, utility maps, as well as natural source images such as aerial photos and satellite imagery.
Creating a spatial database or GIS often involves the acquisition of huge amounts of vector-based spatial data from paper maps and other image sources such as aerial photos and satellite imagery. In the past, the acquisition has mostly been performed with hand-operated digitizing tablets, following procedures that are time-consuming, costly, and error-prone. Only recently have substantial advances in both computer hardware and software been achieved in this field. The developments in image scanning technology have reduced the cost of scanning paper maps to a very low level while the quality level has been maintained and increased significantly.
To meet the demand of automatic digitizing from scanned maps, we have developed a software system, R2V for Windows & NT, for the purpose of automatic paper map input and raster image to vector conversion. Image processing techniques are developed for automated digitizing of contour maps, land use maps, parcel maps, tax maps, utility maps, as well as natural source images such as aerial photos and satellite imagery. In this paper, we will focus on techniques developed for the automated interpretation of scanned maps and practical examples of using the technology.
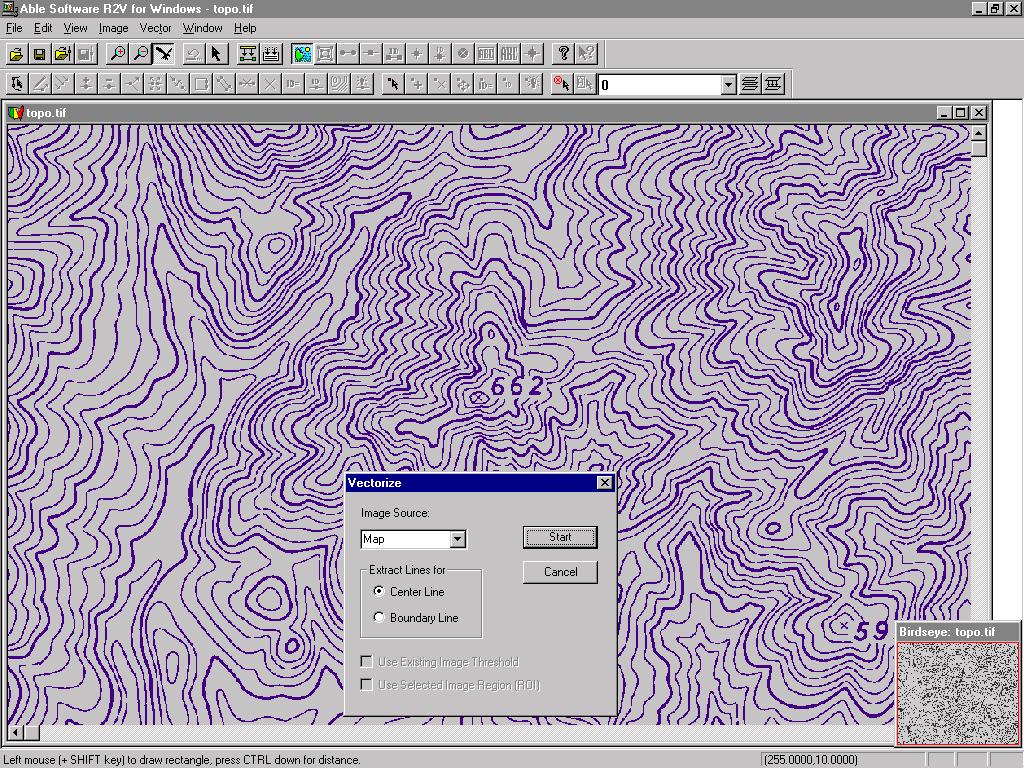
A typical map consists of different types of lines, text and symbols in color or black/white. It is scanned in one of the following image types depending on the map quality and capability of a scanner: monochrome, grayscale or color. The sample contour map (Figure 1) is scanned as grayscale image at 400 DPI (dots per inch).
Algorithms are developed to deskew an image when scanning distortion happens, to remove dark background from the scanned image using a special designed band-pass filter, and to classify and separate colors using a clustering based unsupervised classification method when a color map is scanned and vectorized. A raster image can also be registered another image with the image warping function. This is often done to correct map distortion and increase the accuracy of later geo-referencing.
An optimal thresholding algorithm is developed to convert a grayscale image to binary form for vectorization. All lines, text and symbols are automatically vectorized and recorded in a vector form, i.e., line segments are represented by the center X and Y coordinates along the line. The accuracy level is maintained at the original scanning resolution (in our example, 400DPI) as the center pixel is always traced and recorded. Text are first vectorized as lines and then recognized using R2V's trainable OCR (optical character recognition) engine.
For complex maps or maps with multiple layers, interactive line tracing is often effective. In R2V, select two points on the image and R2V traces the line until it reaches an intersection or the entire line is traced.
Layers are implemented so different layers can be edited and created the same time using either the fully automatic vectorization or interactive tracing method.
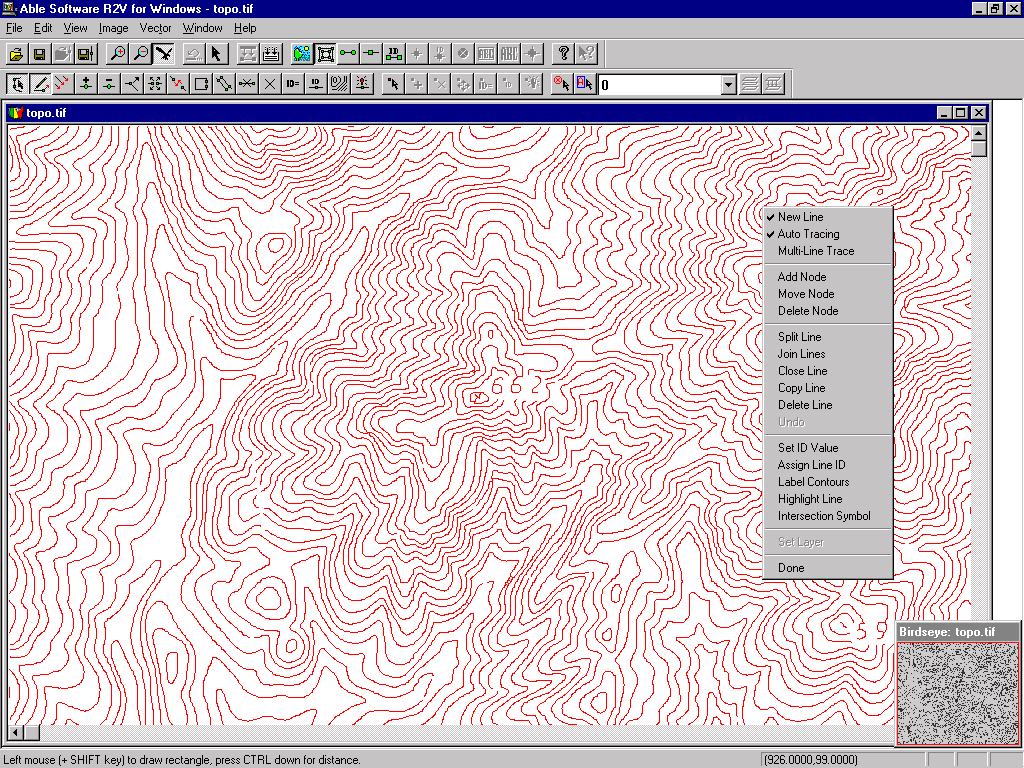
Figure 2 shows the vectorized result of Figure 1, a topographic image.
Broken lines are connected using the line snapping algorithm, which uses a user specified gap threshold value to connect lines that match the snapping criteria. Line smoothing uses a polyline generalization technique to remove rough points caused by local noise and artifacts caused raster image scanning. A line editor is implemented to provide on-screen editing of vector data. It includes adding new lines manually or semi-automatically using line tracing algorithm, line merging and splitting, node editing, and line labeling functions.
Text symbols in a map often come in different orientations and fonts. Detecting and recognizing text on a map has been a challenge because of the complexity and mixture of text objects and vector lines and polygons.
Our text recognition involves following steps:
For maps with polygons, such as parcel or tax maps, polygons are closed with a polygon generating algorithm to create polygon topology and remove redundant lines. The polygon generating algorithm uses a user specified gap threshold to check if a line belongs to a closed polygon. At each intersection, the algorithm uses the search angle to determine the next line segment for the smallest closed polygon.
For polygons and lines, a numerical ID value is attached using the interactive line labeling function or the automatic labeling function if ID values exist in the map and are converted using the OCR function. The ID values are maintained when the vector data is exported to ArcInfo or ArcView system and used together with their attribute database. When vectorizing a parcel map, the parcel ID for each parcel is assigned automatically if they are successfully recognized by the text recognition function and available in numeric form. In the case of digitizing a contour map, elevation values are assigned automatically by going from a lower elevation contour line to a higher elevation contour with a given starting and increment elevation values.
Geo-referencing is a crucial part of data capture for GIS and mapping applications. We have implemented two types of geometric transformation methods, least square bi-linear and Delaunay Triangulation methods.
The least square method is suitable for geo-referencing maps when a small number of control points are available and global geometric correction is needed. The Delaunay Triangulation is more effective when large number of control points are available. With Delaunay Triangulation method, control point locations are maintained as specified after the transformation and local geometric distortion are corrected more efficient. We normally use the bi-linear method when geo-referencing both raster image and vector data for use by ArcInfo or ArcView, which use similar method for geometric transformation.
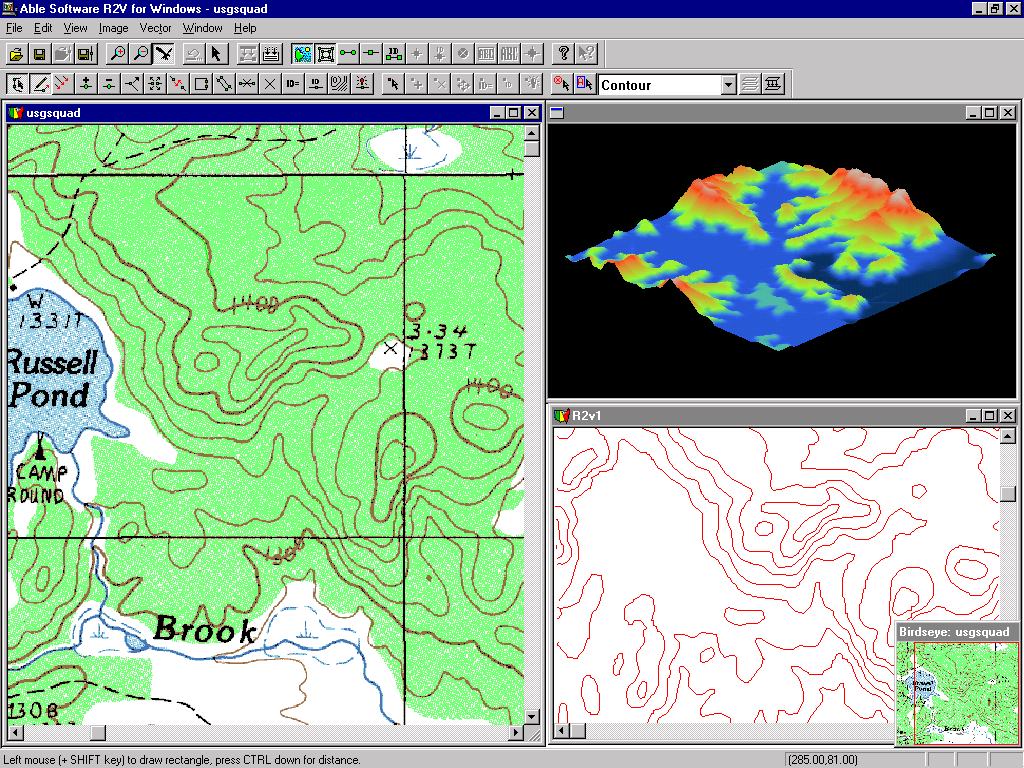
3D data set can be created automatically from the labeled line data and displayed using R2V's 3D display and animation functions. If a natural source image such as aerial photo or satellite image is available for the same region, the image can be easily draped to the surface of the 3D data for more realistic 3D display. The 3D display is adjustable by both azimuth and apex angles, as well as viewing distance. 3D DEM (compatible USGS DEM format) and ArcView grid export formats are used for input and output.
Figure 3 shows a vectorized USGS topographic map using R2V and the 3D display of the contour lines.
The final digitized map with lines and points labeled is then saved to ArcInfo generate or ArcView Shapefile formats for use in a GIS or mapping application. A digitized contour map with all their elevation values labeled can be directly used as a sparse DEM. Figure 2 shows the digitized contour map using R2V's automatic vectorization function. Figure 2 A parcel type map (West Virginia in 1860) is vectorized and polygons are closed using R2V and then exported to ArcView. Figure 3 shows the map vectorized using R2V's vectorization and polygon generating function.
R2V has been used in more than 60 countries for production type of map digitizing. The productivity improvement is significant. At one of the user sites, Thailand Environment Institute, large number of contour and urban parcel maps are being vectorized and digitized using R2V. The time to complete the digitizing and labeling of a single 1:50,000 scale topographic map is reduced to less than 2 days, which was over 10 days using manual digitizing. The vector contour data is then exported to PC ARC/INFO to be integrated into the large scale GIS system.