James T. Gunter, Donald G. Hodges, Christopher M. Swalm, and James L. Regens
PREDICTING THE URBANIZATION OF PINE AND MIXED FORESTS IN ST. TAMMANY PARISH, LOUISIANA: A GIS APPLICATION
ABSTRACT
St. Tammany Parish, Louisiana, has experienced tremendous population growth in the past 20 years resulting in the loss of both agricultural and timber lands to development. This study uses logistic regression to predict the probability of development for forested land in St. Tammany Parish. The software used includes Arc/Infoä , Gridä , ArcViewä , Wessex First Streetä , and SASä . Geographic data sets include satellite imagery from 1981 and 1993, demographic data from the US Census Bureau, population growth estimates from the St. Tammany Parish Government, and road coverages from Wessex First Street.
INTRODUCTION
The Gulf South region of the United States has experienced rapid population growth, reducing the area of industrial and non-industrial private forest in that portion of the country that supplies much of the nation's pine pulpwood and sawtimber (Cordell et al. 1998). St. Tammany Parish (county), Louisiana, (Figure 1) exemplifies this trend. St. Tammany parish is located 30 miles north of New Orleans on the shores of Lake Pontchartrain. Historically, St. Tammany was a mostly rural parish with landscape dominated by agriculture and forestlands. Over the past 20 years, the parish has experienced tremendous population growth resulting in the development of agriculture and forestlands. Increased development and urbanization reduced the forested land base of a parish that had traditionally been an important source of timber.
Industry, policy makers, regulators, and landowners have little information on how urbanization affects forest resources at the parish level. A Geographic Information System (GIS) allows the spatial and temporal dimensions of the biological, physical, and demographic attributes related to development and forest resources to be displayed. A statistical model was incorporated into the GIS to depict the expected changes in forest resources at the parish level as parish characteristics change.
This study developed the GIS and statistical techniques required to examine the relationship between urbanization and timber availability in St. Tammany Parish using primarily publicly available information. Ideally, the GIS and statistical techniques could be applied to larger areas to examine the regional effects of population growth on forest resources. Three specific objectives were addressed by the study:
Accomplishing the objectives required initially obtaining the data and developing the GIS data sets for the study site and creating a SASä data set.. Logistic regression was then used to examine the relationships between urbanization factors (e.g. population density and the transportation infrastructure) and the quantity and location of the parish's forest lands. The GIS was utilized with the estimated logistic regression coefficients to produced a probability of development surface for St. Tammany Parish. The steps involved are described below.
Geographic data sets of random numbers, land cover, census blocks and block groups, federal and state roads, and major access points to New Orleans were obtained or created. All geographic data sets were projected to Universal Transverse Mercator (UTM) zone 16. Additional databases were created for the census block coverage to facilitate the inclusion of demographic information from other data sources. Table 1 lists the information contained in the geographic data sets, data sources, and the associated cover names. A discussion of each geographic data set follows.
Random Points
An 80-meter resolution grid of random numbers was created in Arc/Info's Grid module. Cell values were assigned a random integer value from 1 through 2,000,000 with cells outside the parish boundary receiving a "no data" value. We selected cells with values between 1 and 100,000 from the random number grid. These cells were randomly distributed throughout the parish, and cell values for this grid were set to either 1 (for cells with values from 1 through 100,000) or "no data" (for cell with values greater than 100,000). This grid identified our randomly located parcels within the parish, and will be referred to as "RANDOM" throughout the remainder of the paper.
Land cover data were obtained from two sources: Stennis Space Center/Environmental Enterprises, USA, Inc.; and the United States Geological Survey (USGS) National Wetlands Research Center (USGS 1997). The land cover classification developed at Stennis Space Center was the result of a commercial space technology project by NASA’s Stennis Space Center and the private firm Environmental Enterprises, USA, Inc. of Slidell, Louisiana (Environmental Enterprises, Inc. 1995). Stennis used the cluster modules of Erdas 7.2 with 1981 multispectral satellite (MSS) imagery to categorize land cover into one of 9 groups: coniferous forests, deciduous forests, mixed coniferous/deciduous forests, pasture/agriculture/grasses, cypress/wet deciduous scrub, high density marsh, low density marsh, water, and urban/inert.
Hydric soil groups digitized from the general soils maps of St. Tammany Parish aided in the determination of wetland (cypress/wet deciduous forest, high density marsh, low density marsh) and riparian (deciduous forests) cover types. The resulting land cover image created had 80 meter resolution. Land cover classifications were field verified by Stennis personnel.
The USGS National Wetlands Research Center developed land cover for St. Tammany Parish as part of the National Geographic Assessment Program (GAP). 1993 Thematic Mapper (TM) satellite scenes with 30 meter resolution were categorized into 21 groups by the USGS: fresh marsh, deciduous wetland forests, evergreen wetland forests, mixed wetland evergreen forests, deciduous upland forests, evergreen upland forests, mixed upland forests, dense pine thicket, deciduous wetland shrub/scrub, evergreen wetland shrub/scrub, mixed wetland shrub/scrub, deciduous upland shrub/scrub, evergreen upland shrub/scrub, mixed upland shrub/scrub, agriculture/grasses/crops, vegetated urban, non-vegetated urban, wetland barren, upland barren, intermediate marsh, and brackish marsh.
The USGS also incorporated information from the 1989 National Wetlands Inventory to aid with wetland land cover classification; Hydric soils were not used. ESARL personnel performed extensive field verification of the land cover at 190 randomly selected locations throughout St. Tammany Parish.
Both the Stennis Space Center and the USGS images were imported into Grid TM (Arc/Info TM raster module). The USGS image was filtered to remove small areas of land cover consisting of only a few pixels (specks) and then resampled (with the specks removed) to provide a land cover grid with 80 meter resolution. The resulting USGS grid was then spatially comparable to the Stennis Space Center grid. Next, both land cover grids were reclassified into 7 categories: pine forests, deciduous forests, mixed forests, wetlands, agriculture/grasses, urban/inert/barren, and water. Figure 2 presents the land cover of St. Tammany Parish in 1981 and 1993.
Most of the generalizations from the 21 USGS categories to the new 7-category classification scheme are obvious. However, the field verification of the USGS land cover classification resulted in several needed changes. Field verification indicated that both young pine plantations and thinned pine forests appear as a mixed land cover type on the satellite images. In the reclassification of the USGS land cover, the mixed as well as evergreen shrub/scrub cover types were included in the pine forest category. The pine forest category better reflects the land use than the evergreen or mixed shrub/scrub, or mixed forest categories.
Certain forestry practices (windrowing, bedding, and burning) and grasses within pine plantations will also produce a land cover reflectance that is confused with that of agriculture/grasses/crops. To remedy this problem, areas that were classified as an agriculture/grasses/crops cover type in 1981, but were classified as evergreen or mixed forests in 1993 were identified and reclassified as pine forests. We also identified areas that were classified as coniferous forests in 1981, but were classified as agriculture/grasses/crops in 1993. The field verification revealed that most of these lands were industrial forests that had been replanted with pine. No conversions from forests to agricultural lands were found by field verification. The 1982 through 1992 Census of Agriculture (LEAP 1998) indicates that the number and size of farms, and acreage of farm lands have greatly decreased in St. Tammany Parish since 1982. Conversions from forests to agricultural lands is uncommon in the parish.
With both land cover grids now spatially compatible and with similar land cover, a change detection analysis was performed. Areas that were pine or mixed forested in 1981 and remained pine or mixed forests in 1993, and areas that were pine or mixed forests in 1981 but were urban/inert/barren in 1993 were identified with all other areas receiving a no data value. The hydric soils mask used by Stennis to determine wetland areas was inherently applied in the change detection analysis (i.e., no pine forest was located on hydric soils).
Three covers resulted from the change detection analysis: a point coverage containing our dependent variable, a polygon coverage containing the area of contiguous forest cover in 1981, and a polygon coverage containing the area of contiguous forest cover in 1993. A grid used to identify the dependent variable resulted from the multiplication of RANDOM (values of 1 or "no data") and the change detection grid. The product grid was converted to a point coverage that contained all the centroids of the 100,000 randomly selected cells. Approximately 90,000 of the more than 100,000 randomly selected cells contained agricultural lands, deciduous forest, swamp/marsh lands, or other land covers not considered in this analysis values for these cells were set to "no data". The remaining 12,751 cells were converted to a point coverage that identified parcels that either remained pine/mixed forests from 1981 until 1993, or that changed from pine/mixed forests to urban/inert/barren during that time. To create our dependent variable, a value of zero (0) was assigned to points that were forested in 1981 and 1993, and one (1) was assigned to points that were forested in 1981 but urban/inert/barren in 1993. The point coverage of the dependent variable is referred to as "CHANGE" throughout the remainder of the paper. Figure 3 illustrates RANDOM and CHANGE.
Parcels that contained pine and mixed forest were selected from the grids that contained the 1981 and 1993 land cover. A polygon cover was created providing the contiguous area of pine and mixed forests for each of those years. The coverage of the contiguous area of forest is referred to as "AREA" throughout the remainder of this document.
The 1990 Census contained the demographic information about St. Tammany Parish. This set was the source of demographic information used in the regression analysis. Maps of census blocks from the TIGER TM 92 CDROM from Louisiana (Bureau of Census 1993) were obtained and used to generate a polygon coverage through Arc/Info's TIGER Tool. The state FIPS identifier, parish FIPS identifier, Census Tract-Block Numbering Area (CTBNA) identifier, and block identifier were concatenated in the coverage to generate a unique identifier for each census block in St. Tammany Parish. The coverage containing the uniquely identified census blocks was dissolved to remove contiguous blocks with identical identifiers thus creating a polygon coverage of more than 4000 census blocks; lines that represented roads, rivers, and other similar features were removed by the dissolve.
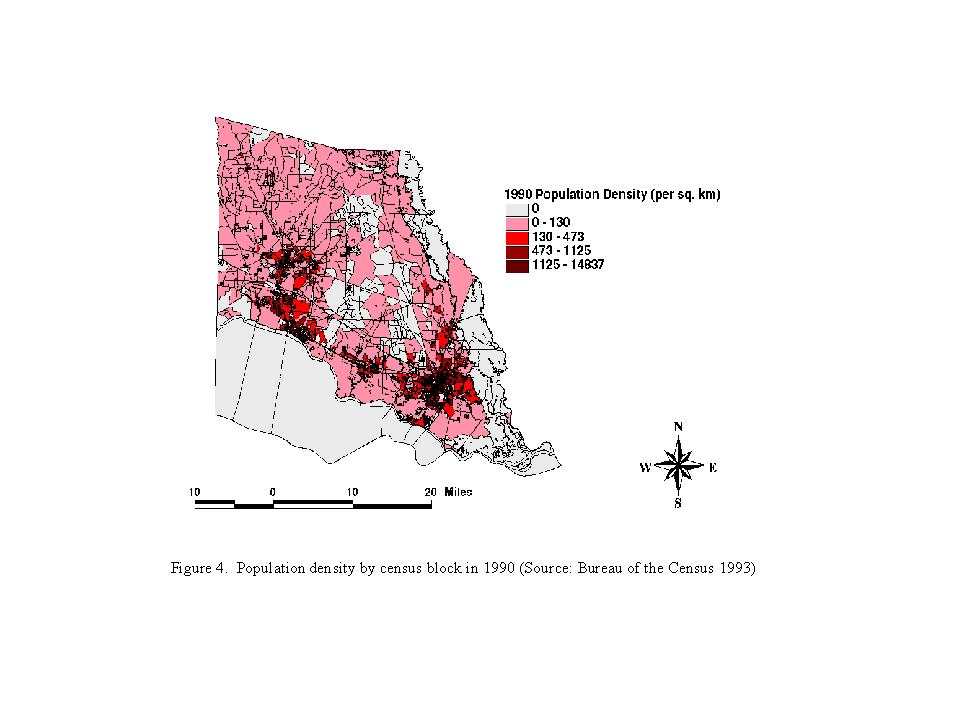
A unique identifier matching the TIGER 92 census block identifier was created for the database from Summary Tape File 1A (US Census Bureau 1993) that contained the total population for each block. The database file was then imported into Arc/Info and joined with the TIGER 92 coverage that contained the census block locations. Population density was calculated by dividing the total population of a census block by the square-kilometer area of the block. By intersecting this coverage with CHANGE, a point coverage containing the population density at the randomly selected parcels was created. This coverage is referred to as "POPDEN" throughout the remainder of this document. Figure 4 depicts the population density of St. Tammany Parish in 1990.
Federal/State Highways and Interstate Interchanges
Interstates, federal, and state highways are able to handle high volumes of traffic and are constructed to higher standards than local roads. These roads serve as the primary arteries to the parish and tend to encourage residential as well as commercial development. The highways data set was identified using Wessex First Street TM, and an ArcView TM shape file was created that contained the US routes and state routes in St. Tammany Parish. Interstate highways were omitted. A data set containing interchanges on interstate highways was also identified through Wessex First Street, and ArcView shape files were created. However, this information is publicly available from the USGS at the 1:100,000 scale and from the TIGER 92 data provided by the Census Bureau.
The two data sets (the federal and state, and interstate interchange shape files) were imported into Arc/Info and converted into a coverage using the SHAPEARC command. The files were imported as line features and converted to 80 meter resolution grids The Euclidean distances to the nearest federal or state highway and to the nearest interstate interchange were calculated using Grid. The grid containing the Euclidean distance to the nearest federal or state highway is referred to as "ROADS". The grid referred to as "INTERCHANGE" contains the Euclidean distance to the nearest limited-access highway interchange.
Distance to large metropolitan areas can be a major determinant of urbanization (Munn and Evans 1998). St. Tammany Parish poses a somewhat more complex problem due to Lake Ponchartrain. As a result, we calculated the distance to the primary access points to New Orleans rather than determine the Euclidean distance to New Orleans. St. Tammany Parish commuters typically use one of three bridges to cross Lake Ponchartrain. Two bridges are located less than 2 km apart in Slidell on U.S. Highway 11 and Interstate10. One point is used to define the location of the these bridges because of their proximity to each other. This point is referred to as the twin spans in this paper. The third bridge is the Causeway from Mandeville to Metairie (a large New Orleans suburb). We marked the entrances of the twin spans and the causeway to create a point coverage. A grid that contains the Euclidean distance to the nearest bridge access to New Orleans was developed for the analysis. This grid is referred to as "ACCESS". Figure 5 presents the transportation network in St. Tammany Parish and identifies the state and federal highways, interstate interchanges, and access points to New Orleans.
Preparing Data for SAS
TMAll grid data sets (ROADS, INTERCHANGE, ACCESS) were masked with an 80-meter resolution grid created from CHANGE. The resulting grids contained only information for the randomly selected parcels and then were converted to point coverages. The point coverages for ROADS, INTERCHANGE, and ACCESS, as well as the polygon coverages AREA and POPDEN, were intersected with CHANGE to create the coverage "SASDATA" containing the dependent and explanatory variables needed for the logistical regression analysis. The Point Attribute Table (PAT) from SASDATA was exported into a comma and quote delimited format through INFO TM (use the export command with the BASIC format option). SAS was able to import the comma delimited file format.
We used logistical regression to estimate the probability that a particular parcel of pine or mixed forest would be developed. The dependent variable (CHANGE) was binary, with zero (0) indicating that the parcel of land was pine or mixed forest in 1981, and remained pine or mixed forest in 1993. A one (1) indicated that the parcel of land was pine or mixed forest in 1981 but was developed (urban/inert/barren) in 1993. Based on prior research (Munn and Evans 1998. Alig et al. 1988, Alig 1986), several independent variables were evaluated; the final model included population density (POPDEN), distance to access points to New Orleans (ACCESS), the distance to a federal or state highway road (ROADS), the distance to the nearest interchange on a limited access highway (INTERCHANGE), and the area of contiguous pine or mixed forest cover in 1981 (AREA).
Equation 1 is the logistical model used for the analysis (Hosmer and Lemeshow 1989).
Equation 2, the logit equation, is the log transformation of Equation 1:
The logit model developed contained continuous independent variables which greatly reduces the number of data sets (covers and grids) that must be generated. Equation 3 is the specific logit model used to estimate the log odds that a pine or mixed forest parcel will be developed:
Projecting Future Timberland Locations
Once the model was developed, projections were made for 2003 using the same model structure. Data for all variables except population density and contiguous land area were held constant. A new value for contiguous land cover (AREA), derived from the 1993 (most recent) Thematic Mapper imagery, was used. Estimates of future population density were obtained from the St. Tammany Parish Government (St. Tammany Management Information Services 1998) and were used for the values for POPDEN. These data were utilized to predict the development of pine/mixed forest lands by 2003.
The location of pine/mixed forests likely to be developed and the remaining pine/mixed forests then could be determined based on the predicted probability of development values. The only changes evaluated for the study were the loss of pine and mixed forests. Changes from agricultural to forests, forests to agricultural, or urban to forests were not evaluated for a number of reasons. First, the objective of the study was to assess the impact of urbanization on forested areas only. Commercial forests were of primary concern so forests with a significant pine presence were selected. In St. Tammany Parish, deciduous forests grow in wet/riparian areas that limit commercial usage.
Moreover, assessing the changes between agricultural and forest lands were complicated by the satellite data used in evaluating land use change. Specifically, detecting agricultural lands from recently harvested forestland was difficult, at best, with the satellite images employed. While this problem was alleviated somewhat by field verification, efforts were focused on examining the forest to urban change patterns.
The results of the regression indicate that the development of pine and mixed forest tracts in St. Tammany Parish were influenced by demographic and spatial factors. Specifically, population density, distance to state and federal highways, distance to commuter access routes to New Orleans, and distance to interstate interchanges are significantly related to development. Area of contiguous pine and mixed forest cover was not significantly related to the log-odds of development.
Table 2 presents the maximum likelihood parameter estimates, standard errors, Wald statistics and probability of a greater Wald statistic for the multivariate model described in Equation 3. The signs of the parameters indicate the direction of the influence a variable has on the log-odds that a parcel of pine or mixed forest will be developed. For example, as POPDEN (population density) increases, the log-odds (as well as odds and probability), that a forested parcel will be developed increases. Conversely, as ROADS, ACCESS, or INTERCHANGE increase, the log-odds that a forested parcel will be developed decreases. AREA (area of contiguous pine/mixed forest in 1981) cover had no significant impact on whether or not a parcel was developed.
The odds ratios reflect the relative influence of each variable in the model when compared to a baseline (Table 3). We define the baseline to be the mean values for POPDEN, ROADS, ACCESS, INTERCHANGE, and AREA. Holding all other variables constant the mean, a census block with a population density (POPDEN) of 168.6 persons per square kilometer was 1.73 times more likely to be developed than a census block with a population density of 68.6 persons per square kilometer. As distance from a forested parcel to a state or federal highway (ROADS) increased 1 km from the mean, the odds of development decreased by 1.69 times. As distance from a forested parcel to the major commuter access routes to New Orleans (ACCESS) increased 10 km, the odds of development decreased by 2.00 times. As the distance from a forested parcel to the nearest interstate interchange (INTERCHANGE) increased 10 km, the odds of development decreased 5.26 times. A parcel that was part of a 7548.3 hectare contiguous area of pine/mixed forest in 1981 (AREA) was 1 time less likely to be developed than a parcel that was part of a 7448.3 hectare contiguous area of pine/mixed forest, further indicating contiguous area of pine and mixed forest does not significantly affect the probability of development.
The Hosmer and Lemshow goodness-of-fit test (c2= 43.355 with 8 df and p= 0.0001) indicates that a better predictive model exists. Information such as ownership, (commercial federal or state governments, local government, farmer, or non-commercial/non-farmer), within corporate limits, zoning, amenities, and incentives/disincentives to development are not incorporated into this model. Inclusion of such information may improve model fit, and such information may be more easily accessible in the future. The variables included in the model presented above significantly affect development, but excluded information, if it can be identified and included, could greatly improve the fit.
A probability surface was created in the GIS by using Equation 1 with the estimated coefficients found in Table 2 and the variable values determined for the entire parish. Recall that each variable listed in Table 2 has a corresponding Arc/Info grid that contains values for those variables. Figure 6 identifies the pine or mixed forest parcels that were developed between 1981 and 1990 at different probability thresholds (6a), and identifies the forested parcels that were observed to have been developed during that period (6b).
Projections to 2003 were developed based on the model parameters estimated above. Population projections were provided by the St. Tammany Parish government (St. Tammany Management Information Services 1998). These values were used as POPDEN with the contiguous forest area in 1993 (AREA), distance to the closest state and federal highways (ROADS), distance to the closest commuter access point to New Orleans (ACCESS), and distance to the nearest interstate interchange (INTERCHANGE) to predict pine/mixed forests development in 2003. Values for ROADS, ACCESS, and INTERCHANGE remained unchanged from the values used to estimate the model parameters. Figure 7 illustrates the probability surface of development for 2003.
These results indicate that the modeling/GIS approach could be useful not only for explaining current land use change trends, but also for predicting future land use scenarios based on projections of the independent variables. This will prove to be valuable to researchers as well as local government planners or land managers. In St. Tammany Parish, for example, the local government has recently adopted growth management zoning. The model developed as part of this study allows planners to evaluate future growth patterns based on population projections and infrastructure changes, identifying portions of the parish that may require growth management zoning. More important to resource management, the results will highlight areas of primary concern to local forest industry in terms of future timberland availability. The study reveals that as much as 16 percent of the forested area and 19 percent of the pine inventory could be lost to urbanization by 2003. This obviously has important implications for private companies and state agencies concerned with future timber supplies in southeastern Louisiana.
Employing a GIS to model forest lands lost to urbanization presents several advantages. First, much of the information needed for the model is publicly available in digital form that can be easily utilized. For example, the USGS provides digital line graphs of the nation's roads and the U.S. Census Bureau provides population estimates and demographic data. Second, a GIS allows analysts to assess not only the amount of forest land that will be lost to urbanization and other uses, but also the spatial distribution of the remaining forests. This may be invaluable for making industrial and policy decisions as well as evaluating the environmental and economic impacts of urbanization in a landscape. Finally, information exists that can be used in conjunction with or incorporated into the urbanization probability model to provide even more accurate estimates of how much and which forest lands will be developed. Information such as local zoning maps, spatially referenced growth management ordinances, and local tax structure will likely be digital in the future, and can be utilized to improve population estimates and identify areas where development is to be encouraged or discouraged.
The model can be expanded to examine a multi-parish region. A Forest Inventory Analysis unit (FIA - typically a 5 to 10 contiguous counties) level re-estimation of the model would allow us to better utilize FIA volume data. Use of FIA volume data was limited in St. Tammany Parish by the small number of survey plots (31) that exist in the parish. A regional scale model should be re-estimated using population density data from the block and block-group level. The models must be compared and evaluated for significant differences. Blocks, although desirable from a spatial-scale perspective, have two significant drawbacks at this time. One is data management. A 5-10 parish region may have more than 30,000 blocks, which can significantly impact the ability to store, manipulate, and verify data. The other drawback to using block-level population density data is simply that predictions of future population density are not available at the block level. Block-group estimates are available. Although predicted population density can be proportionally divided among blocks based on historic ratios (as we did), population density is the most important factor affecting the probability of urbanization. An estimate at the block-group level will eliminate bias that may result from proportionally dividing population among blocks.
Satellite imagery that has been consistently classified would improve the model. Area and volume estimates may be more accurately estimated using a classification scheme that is consistent between periods. The classification scheme should be consistent with FIA forest types or an aggregation of FIA forest types to improve volume estimates. Seedling/sapling, pole, sawtimber size classes should ideally be classified separately. An additional benefit of consistently classified imagery is the use of multiple logistical regression to estimate the probability that forested lands (by forest type and size class), agricultural lands, and wetlands will be developed.
In summary, the GIS/Land Use Change Model developed for this study provides industrial and governmental decision makers with a means for predicting future development in rapidly urbanizing areas and/or the impacts of this development on timberland resources. With further refinements and a regional approach to allow for the use of FIA plot-level data, the GIS/Land Use Change Model can provide reasonable projections of future timberland area, distribution, and volume. Moreover, the approach can be easily applied to other resource management questions, including urbanization effects on erosion and water quality, endangered species habitat, and recreational and aesthetics factors, and can provide projections of both total effects and their spatial distribution.
AKNOWLEDGEMENTS
Funding for this Project was provided by the USDA Forest Service Southern Forest Experimental Station (project numbers SRS-30-CA-96-040 and SRS-30-CA-96-087)
Alig, R.J. (1986). "Economic analysis of factors influencing forest acreage trends in the Southeast", Forest Science, Vol. 32, pp. 119-134.
Alig, R.J., F.C. White, and B.C. Murray (1988). "Economic factors influencing land use changes in the south-central United States." USDA Forest Service Research Paper SE-272, Southeastern Forest Experiment Station, Asheville, NC. 23 p.
Bureau of the Census (1993). "TIGEr/Line Files 1992". Machine-Readable Data Files. Washington, D.C.
Cordell, H. Ken, John C. Bliss, Cassandra Y. Johnson, and Mark Fly (1998). "Voices from the southern forests". Trans. 63rd No. Am. Wildl and Natur. Resour. Conf. pp. 332-346.
Environmental Enterprises, Inc. 1995. Personal Communication. Slidell, Louisiana.
Hosmer, David W., Stanley Lemeshow (1989) "Applied Logistc Regression." John Wiley and Sons. New York. 307 pp.
LEAP (Louisiana Electronic Assistance Program) (1998). Center for Business and Economic Research (CBER), Northeast Louisiana University. Monroe, Louisiana. http://leap.nlu.edu/
Munn, Ian A. and David L. Evans (1998). "The southern commercial timberland base: changes and projections." In: Proceedings, First International Conference on Geospatial Information in Agriculture and Forestry, ERIM International, Ann Arbor, MI. pp. I81-I88.
St. Tammany Parish Management Information Services. 1998. St. Tammany Parish Police Jury, Covington, LA.
United States Geological Survey National Wetlands Research Center. 1997. Personal Communication. Lafayette, Louisiana. http://www.nwrc.nbs.gov/
Wessex, Inc., 1995. First Street. 1015 Tower Road, Winnetka Illinois, 60093. http://www.wessex.com/
AUTHOR INFORMATION
James T Gunter is a Research Scientist/Cartographic Engineer, Donald G. Hodges is an Associate Professor of Environmental Health Science and Assistant Director, Christopher M. Swalm is a Senior Research Scientist/Cartographic Engineer, and James L. Regens is a Freeport-McMoRan Professor of Environmental Policy and Director of the Entergy Spatial Analysis Research Laboratory.
Address
Entergy Spatial Analysis Research Laboratory, Tulane University Medical Center 1430 Tulane Avenue (SL-1) New Orleans, La 70112-2699Contact Information
Phone (504)586-3824, Fax (504)585-6954 Email: hodges@esarl.tulane.edu WebPage: http://www.esarl.tulane.edu/