 Highway planning projects vary in many different ways such as type, size, and
scale. Some common examples are corridor studies, major investment studies, relocation
studies, environmental impact statements (EIS), and environmental assessments (EA).
Highway planning projects vary in many different ways such as type, size, and
scale. Some common examples are corridor studies, major investment studies, relocation
studies, environmental impact statements (EIS), and environmental assessments (EA). James R. West
Improving Highway Planning with the Help of GIS
A major highway planning project takes place over a period of years and involves a wide range of engineering and technical specialties. Transportation project teams are increasingly using Geographic Information Systems, or GIS, as an integral part of the planning and design workflow.
A GIS is an organized collection of hardware, software, and spatial data that enables the team to efficiently capture, store, update, manipulate, analyze, and display geographically referenced information. By establishing a GIS at the outset, the roadway planning team can lay a foundation that will enhance communication and accuracy through every phase of the project. At completion, a powerful database is in place for maintenance and future planning needs.
Highway planning projects vary in many different ways such as type, size, and
scale. Some common examples are corridor studies, major investment studies, relocation
studies, environmental impact statements (EIS), and environmental assessments (EA).
In the highway planning and design workflow, every contributing discipline produces separate project files in accordance with the group's preferred CAD or mapping format and standard. Each project phase requires varying datasets such as the following:
Traditional Methods vs. Today's Methods
Traditional methods of doing highway planning dealt primarily with analyzing spreadsheets, using planimeters to calculate areas, and using hardcopy maps with mylar overlays. Non-intelligent CAD data was also used to display and overlay specific data to the environmental planner. Today's methods have changed considerably taking advantage of GIS technology. This technology has given the planner a tool to perform spatial analyses such as identity, merge, clip, buffers, and joining of tabular data.er
Some common benefits of using a GIS on highway planning processes:
- Improved access to data, which means earlier project completion
- Better access allows more sophisticated analyses
- Heightened system performance encourages users to better utilize data
- Cost effective due to time saving processes
Common datasets used in an Environmental Assessment
- Wetlands - NWI
- Streams - USGS
- Floodplains - FEMA
- Threatened and Endangered Species Habitat
- Historic and Archaeological Sites
- Land Ownership
- Land Use
- Hazardous Waste Sites
- Existing Right-of-ways
- Utilities
- Aerial Photography
- Building Footprints
- Topography (index and intermediate contours)
- Digital Elevation Models (DEM)
- Cultural Resources
Once the datasets are determined for the Environmental Assessment specific steps need to be taken to massage the data. These steps include the use of AutoCAD, MicroStation, Arc/Info, and ArcView. Arc/Info tools are used to perform specific tasks that ArcView cannot handle due to software limitations. Importing data can be performed in ArcView or Arc/Info, while reprojecting data seems to work better with Arc/Info. Building topology for each dataset is very important to do because polygons need to be created for wetlands, new alignments, and property owners. Stationing is also done in Arc/Info, but it can also be done in the CAD environment. This step is necessary to identify each wetland. Positioning of the data is critical when producing map sheets. Because of ArcView's limitations, the data was rotated in Arc/Info and then taken into ArcView for plotting.
Useful ArcView Extensions
- Xtools - Oregon
- Stacked Label Tool
- CADTools
- CAD Reader
- Image Georeferencing Tool
- Geoprocessing Wizard
- Report Writer
ArcView Methodology
- Generating function and value table in Excel
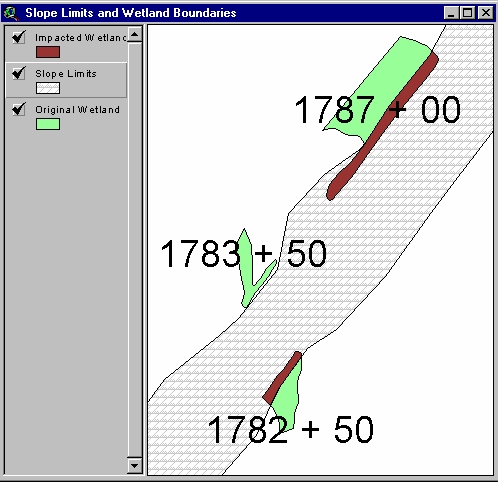
- Loading and displaying spatial data (wetland boundaries, new alignment, streams, contours, property lines)
- Assigning station IDs for each wetland
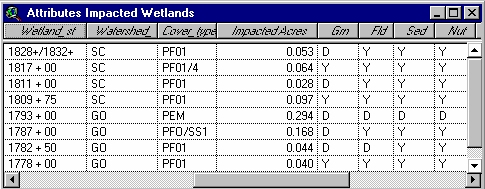
- Joining function and value tables to wetlands polygon features
- Hot linking field data to wetland feature polygons
- Overlaying wetlands with new transportation alignment for analysis
Deliverables
150 maps were produced with ArcView with a scale 1" = 150'
Table and Reports
- Wetland Impact by Functional Value
- Wetland Impact by Type and Size
- Wetland Impact by Cover Type
- Wetland Impact by Town
- Wetland Impact by Water System
- Summary of Wetland Impact and Value
Software Limitations
ArcView has several limitations, such as building topology, rotating view or layouts for output, or resizing CAD text in order to view the data at the appropriate scale. Arc/Info was only limited in converting PolyLineZ shapefiles, which is an unsupported shape type in Arc/Info. These polylineZ files need to be converted in ArcView from 2D to 3D before imported into Arc/Info.
Things to consider when using GIS in an Environmental Assessment (EA)
- Translation of data (2D and 3D)
- Define dataset very specifically such as points, lines, and polygons. (Alignment - polygon)
- Define study area boundaries (dgn seed file)
- Define what software will be doing the stationing (Arc/Info or AutoCAD)
- Establish layering standards
- Rotation of data (paperview vs. model view using AutoCAD)
- Passing annotation between CAD and GIS
- Delivery of data (What format? shapefiles, coverages, dgn, dxf, dwg)
James R. West
GIS Specialist
HNTB Corporation
1201 Walnut / Ste 700
(816) 472-1201
(816) 472-4065 fax
jwest@hntb.com