Scott N. Miller
(1)
D. Phillip
Guertin
(2)
Teaching Spatial Analysis
for Hydrology and Watershed Management
ABSTRACT
The need for GIS courses that include advanced
GIS concepts as well as address the special requirements of a discipline
is rapidly growing. The goal of this paper is to describe a course developed
at the University of Arizona for hydrologists and other earth scientists.
A series of assignments has been developed on important topics such as
interpolation of environmental data, creation and use of DEMs, linkage
of GIS to hydrologic and erosion models, watershed assessment, and effects
of database resolution. The paper reviews course content, philosophy, and
direction. Examples of assignments using ARC/INFO are provided.
INTRODUCTION
Geographic information systems (GIS) are
becoming ingrained in the hydrologic and watershed management communities
for both research and application. With the rapid growth of this field
over the last 10 years, there has been a commensurate increase in the development
of curricula for GIS at the University level. The fact that many of these
courses are taught at lower levels is a function of the technical requirements
of the field; a large amount of introductory material is required in order
for students to be able to apply advanced principles to research and management
problems. However, it is precisely the ability to integrate technology
with imaginative research objectives that will propel forward fields reliant
on GIS. A graduate-level course has been developed in The University of
ArizonaÆs School of Renewable Natural Resources in collaboration with the
USDA-ARS Southwest Watershed Research Center (SWRC) that focuses on the
application of GIS in hydrology and watershed management with an emphasis
on the practical and theoretical roles of GIS as a research and management
tool (Miller and Guertin, 1999; Esri, 1998).
Watershed management and hydrology are
both highly dependent on spatially distributed information. In past years,
classes have been available at The University of Arizona that provide introductory
material in GIS and introduce the topics of cartographic modeling and watershed
assessment. Abundant classes are taught concerning the fields of hydrology
and natural resources, including modeling and quantitative watershed analysis.
The class described in this paper bridges these fields using advanced GIS
and hydrology tools. Since the focus is on practical applications of narural
resource science in a GIS environment, the objective of the course is to
provide a rigorous introduction to techniques linking spatially distributed
data to watershed analyses and modeling. Emphasis is placed on scaling
issues and the impacts of uncertainty and error on research and management
applications.
The topics investigated within a semester
are fluid from year to year, subject to the skills and needs of the students.
However, the primary goal remains the same; that the students become familiar
with advanced topics and emerging scientific issues pertinent to hydrologic
science. As such, this course moves from cartographic modeling through
advanced spatial analysis and geostatistics to the application of distributed
hydrologic modeling. Topics include watershed assessment for erosion potential
and grazing capacity, appropriate interpolation techniques for rainfall
and elevation data, kriging and the derivation of spatial statistics, impact
of scale and error on watershed analyses, and integration of lumped and
distributed rainfall-runoff models with GIS.
The majority of class work is performed
on high quality GIS data layers provided by the SWRC covering the Walnut
Gulch Experimental Watershed, a rangeland watershed located in southeast
Arizona. Walnut Gulch is a unique facility that is heavily instrumented,
with over 100 historical and current rain gauges and a nested subwatershed
design. The watershed is subdivided into 31 primary subwatersheds ranging
in size from several hectares to over 148 km2 (Renard et al.,
1993). The nested design and amount of instrumentation allow for investigations
into effects of scale, interpolation, and GIS procedures on hydrologic
research. Urban studies use theme layers covering Tucson, AZ. A variety
of data are incorporated into the class, including high and low resolution
digital elevation models (DEMs), both detailed and generalized soil and
vegetation data, geologic maps, point sources of long-term climate records,
SPOT and Landsat remote sensing imagery, and interferometric synthetic
aperture radar data. Note that mutliple theme layers of differing resolutions
and quality are available for vegetation, soils, and topography. These
data allow for investigations into error and data quality on watershed
classification, modeling, and management.
One of the truisms of GIS analysis is that
there are numerous avenues available to arrive at a solution. It cannot
be overstated, however, that the choice of technique can significantly
alter the results. The choice of which method to use should therefore not
be made in a vacuum, and the researcher should explore the relative merits
and drawbacks to various GIS tools. The class focuses heavily on this issue
since the ramifications are widespread, but often hidden or ignored, in
the scientific literature. Weekly laboratory exercises focus on the impact
of various techniques on model results and management decisions by requiring
that the same topic be addressed from several directions and the results
scrutinized for discrepancies.
It is presumed from course prerequisites
that students understand the basics of the Arc/Info data model, specifically
relating to the appropriate design of a GIS for a given research or management
objective. A fundamental understanding of Arc/Info and ArcView commands
and tools is assumed. Given these basic skills, students are free to pursue
the pertinent issues of scale, error and uncertainty, cartographic modeling,
geospatial analysis, and distributed hydrologic modeling.
COURSE FRAMEWORK
The course is taught with a standard lecture/lab
format, and there are 5 principle means used to deliver information to
the students. Lectures are used to provide introductory material and theory,
labs are used to merge theory with practice and improve technical ability,
a web site serves to disseminate information and proivide additional hints
and GIS techniques, reading material provides information on the scientific
history of the subjects and keeps the students aware of cutting-edge research,
and each student is required to complete a class project of his/her own
choosing. A textbook (Burrough and McDonnell, 1998) is used for supporting
documentation, but primary sources are made available throughout the semester,
and students are expected to maintain pace with the readings (see Appendix
I for a list of these references). Students are advised to choose term
projects that relate to their graduate studies and the seeds of several
manuscripts have been germinated in this manner (Huth, 1997; Levick, 1998;
Youberg, 1998; Heller, 1999; Levick et al., 1999; Miller et al., 1999a;
Miller et al., 1999b).
In order to build on the studentsÆ GIS
skills and understanding of the Arc/Info data model and fundamentals of
hydrologic research, individual work is required throughout the semester.
Weekly projects are assigned, and while students are expected to hand in
their own results, group work is encouraged, and lab sessions are configured
to promote collaboration. Homework assignments typically stretch beyond
the bounds of the lab, and deadlines are treated loosely; they are used
more to force students to keep pace than as a mechanism for assigning grades.
Assignments are due in electronic form; most lab work takes the form of
writing Arc Macro Language (AML) programs to solve hydrologic or management
questions, and grades are based on the accuracy of results produced by
running the AMLs. Proper documentation of the programs is mandatory. The
class is designed for motivated students working with GIS in their research;
as such the expectations and pace are high.
Taught in the Fall semester as a two-unit
course, for the past two years the class has been limited to a weekly one-hour
lecture and three-hour lab, which were taught sequentially. The instructors
and students deemed this arrangement inadequate, and, starting in the Fall
of 1999, the class will be expanded to three units with twice-weekly lectures
and a three-hour lab. This expanded format will serve two purposes. First,
lectures will not be limited strictly to lab-related information; second,
the separation of lectures and labs should facilitate learning since each
subject will be reinforced following brief intervals. In the past, students
have reported feeling overwhelmed by the quantity of information presented
in a four-hour block each week. While a commensurate increase in information
will accompany the additional unit, the separation among lectures and labs
should assuage concerns regarding the intensity of the class.
SCOPE AND SEQUENCE
It is increasingly clear
that students in earth sciences are well served when they emerge with strong
foundations in scientific techniques and GIS tools. Emerging research in
hydrology relies on the combination of such disparate subjects as interpolation
techniques, watershed characterization, spatial analysis, and physically-based
modeling. To gain a comprehensive understanding, these topics should be
explored individually, and universities are well equipped to provide such
instruction. A need was identified at The University of Arizona for a class
in which these and other topics were synthesized and applied to standard
watershed modeling and assessment tools.
Topics chosen for this class
are based on watershed research needs rather than on the improvement of
GIS skills. That is not to imply that GIS skills are not taught and improved
upon; rather, that the lectures and lab exercises are concerned primarily
with forwarding hydrologic research using GIS as a tool to attain the various
objectives. While several of the topics are traditional watershed management
techniques, their implementation in a GIS is a relatively recent development,
and several emerging research methods are introduced. As such, this class
is designed to provide a foundation in emerging research issues and associated
topics of concern, thereby providing future directions for study.
Individual topics and their
associated laboratory exercises are presented in Table 1. Since this class
is dynamic, this table is non-representative of the scope of work which
will be covered as the class evolves through time. This year, for instance,
will see the introduction of fuzzy classification for soil mapping and
watershed fractal analysis. Please refer to the class web site (http://www.tucson.ars.ag.gov/wsm569)
for up-to-date curricular information. Note that the subject matter grows
increasingly complex through the semester. It has been the instructorsÆ
experience that students grow increasingly more comfortable with the subject
matter and the pace of the class increases as the semester progresses.
This observation underscores the importance of regular exposure to GIS-based
applications. The reliance on technical skill, i.e. understanding the data
model and knowing the range of GIS commands, is a barrier to entry into
the field of spatial analysis and has fostered a need for GIS specialists
to provide support to staff scientists. Classes such as this are intended
to meld science and technology and spur students into using these new-found
skills in their research.
Issues of scale, uncertainty,
and error are increasingly being recognized as critical to earth sciences.
Hydrologic processes are largely scale-dependent, with different processes
driving hydrological response at various scales. Various interpolation
techniques are available to researchers, and the choice of technique may
significantly alter research results. While GIS data are becoming widely
available across the United States and the rest of the world, there is
concern that the impacts of data quality and spatial error on watershed
modeling and assessment are poorly understood. With its range of highly
accurate data, the Walnut Gulch GIS data layers allow the class to probe
these relevant issues. Scalar issues are addressed using the nested subwatershed
design in concert with long-term historical rainfall and runoff data. Various
interpolation techniques can be used to simulate rainfall from over 100
rain gauges to address hidden implications for runoff simulation and management.
The impacts of error can be approached scientifically since several GIS
layers exist at various resolutions and accuracy for vegetation, soils,
and topography. The themes of error, spatial averaging, accuracy, and scale
are fundamental to the class, and assignments are arranged to provide extended
and repeated exposure to these subjects.
Table 1. Scope and sequence
of topics for the Fall semester, 1998. This upcoming semester will introduce
fuzzy sets and fractal analyses.
| Topic |
Lab Exercise |
Weeks |
| The
Arc/Info Data Model; Re-introduction of Basic Skills |
Cartographic
modeling of small town |
1
|
| Land
classification |
Application
of the Universal Soil Loss Equation (USLE) for erosion tolerance and delineation
of management regions |
2 - 3
|
| Capability
assessment |
Determine
grazing capacity on Southwest rangeland using erosion tolerance, vegetation
characteristics |
4
|
| Interpolation
techniques; inverse distance weighting, spline, Thiessen |
Derive
rainfall surface from historical gauge data on a Southwest rangeland watershed |
5
|
| Advanced
interpolation; kriging |
Reproduce
previous weekÆs exercise on rainfall using various kriging techniques |
6-7
|
| Hydrologically
correct digital elevation models (DEMs) |
Download,
import, and smooth standard USGS data for rangeland watershed; run preliminary
hyrdologic analyses |
8
|
| Improved
DEMs; SAR, orthophotography |
Use
high quality survey data to reproduce topography for rangeland watershed
used in previous week; assess differences among models. |
9
|
| Spatial
statistics |
Comparison
of multiple interpolated surfaces using correlative statistics. |
10
|
| Lumped
runoff modeling; impact of GIS resolution on results |
Model
runoff using SCS Curve Number technique on small urban watershed for multiple
rainfall events with various surface models. |
11
|
| Influence
of interpolated surfaces on research |
Use
previously created rainfall surfaces (weeks 6-9) as input to distributed
Curve Number runoff modeling; determine which yields best results. |
12
|
| GIS
and physically-based distributed modeling |
Apply
different GIS watershed characterization tools to provide input to KINEROS
and assess influence on runoff simulation. |
13
|
| Class
project |
Students
complete semester-long projects. |
14-15
|
On the Conflict Between
Creativity and Technical Ability
A significant hurdle to effective
teaching at the level of application and theory is the high investment
in technical ability required of the students. The course is not intended
to be simply a forum for learning new GIS commands and tricks; rather,
technical ability serves as a springboard for ideas and discussion surrounding
the appropriate application of spatial modeling. However, by advancing
into realms to which the students have not had prior exposure, it is inevitable
that some breakdowns occur due to programming difficulties. This is unfortunate
given that the commands and their sequences are secondary to the learning
process, and progress can be impeded by a need to invest in learning new
code, which is nonetheless recognized as a vital skill for any GIS analyst.
To circumvent this issue, class notes relating to necessary commands are
placed on a web site, some discussion is devoted to programming in class,
and students are encouraged to work in collaboration with one another.
While these techniques have
garnered successes, the hurdles of GIS jargon and heavy programming requirements
for advanced applications remains high for some students. An inherent conflict
is apparent in this problem. On the one hand, the class is designed to
spur creative thinking and fresh approaches to problem solving, intellectual
forays requiring a suite of tools that the students do not yet possess.
To aid these forays, it would be advisable to simply give the students
the tools in a "cookbook" fashion. On the other hand, reliance on "cookbook",
or black-box approaches to GIS in research blinds the student to pratfalls
and conflicts that are limitations on the research ideas. It is important,
therefore, to find a balance between providing enough information to spur
creative approaches and yet not shield the student from practical applications
and limitations.
EXAMPLE APPLICATIONS
Three assignments that demonstrate
the range of subject matter will be presented in the following section.
For more detailed information on these or other assignments, including
the algorithms employed in their solutions, please refer to the class web
page (
http://www.tucson.ars.ag.gov/wsm569).
Watershed Classification
and Capability Assessment
Surface erosion, the detachment
and removal of soil from the land surface, can be a significant contributor
to land degradation. Soil loss through overland processes is a natural
process, the rate of which is dependent on a series of interlocking factors,
including rainfall erosivity, soil erodibility, the length and slope of
the eroding surface, and vegetation cover. The annual erosion rate can
be accentuated or reduced by anthropogenic influences, such as poor or
improved land management, construction, or road building. GIS data layers
for the Walnut Gulch Experimental Watershed are used in an exercise to
determine appropriate stocking rates on a semi-arid rangeland watershed
as a function of vegetative and soil characteristics with limitations on
stocking rates a function of soil loss as predicted by the Universal Soil
Loss Equation (Wischmeir and Smith, 1978).
One of the primary uses of
Walnut Gulch is livestock grazing. GIS can be used to compute the allowable
grazing capacity (number of animals/area) which will consider soil protection.
Grazing capacity is an estimate of the number of animals that can be supported
in an area on a sustainable basis and meeting other management goals. Grazing
capacity can be computed as a function of the available forage, the forage
demand per animal (species specific) and adjustments made for management
practices. Forage production (lb/ac) can be obtained from National Resource
Conservation Service (NRCS) soil or range site maps. NRCS maps usually
provide production estimates for individual soil series or range sites
for high, normal and poor precipitation years.
To successfully complete
this assignment, students compose AMLs that must determine (1) available
forage based on vegetation, (2) potential soil erosion based on the USLE,
(3) allowable use, which is limited by the potential for soils erosion,
(4) forage production, which adjusts available forage by allowable use,
and finally (5) grazing capacity.
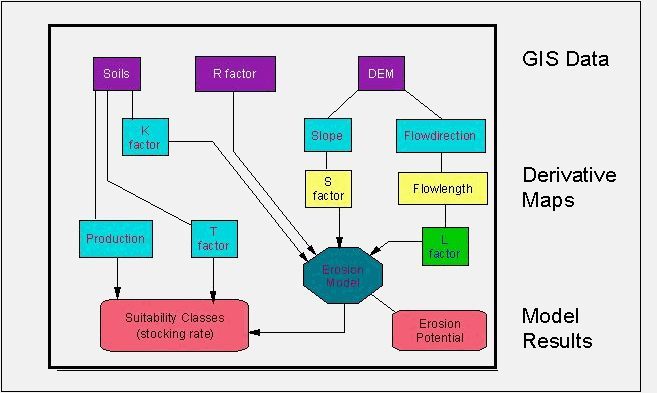 Students are provided with GIS layers
of soils, rainfall erosivity (R factor), and topography (DEM); these are
used to derive intermediate map products, and ultimately a grazing capacity
map upon which management decisions can be made.
Figure 1 outlines the steps used in the determination of grazing capacity.
Students are provided with GIS layers
of soils, rainfall erosivity (R factor), and topography (DEM); these are
used to derive intermediate map products, and ultimately a grazing capacity
map upon which management decisions can be made.
Figure 1 outlines the steps used in the determination of grazing capacity.
Influences of Data
Resolution on Urban Flood Prediction
Hydrologic models often require
detailed spatial information for the area under investigation. GIS provides
the researcher with tools to rapidly and extract relevant data to parameterize
such models. There are, however, both limitations and benefits to this
approach, with questions relating to resolution, spatial variability and
model sensitivity foremost among them. In this lab the students become
familiarized with some of these issues by using a simple runoff prediction
tool in an urban watershed. The goal is to understand the ramifications
of spatial resolution and attribution error on hydrologic model performance.
In this case, the SCS Curve
Number method (USDA SCS, 1972), perhaps the most widely applied hydrologic
model in the world, is used to model runoff for an urban Tucson watershed
for multiple rainfall events with a variety of GIS data. Upon doing so,
the performance of the model is assessed by comparing results to observed
runoff values to determine the appropriateness of various source data.
The High School Wash watershed is located directly to the East of the main
portion of the University of Arizona campus, and actually incorporates
some of the southeastern sections of the campus. GIS data sets of land
cover and soils have been developed at a series of cell resolutions (25,
50, 100, 200, and 300 ft). Long term rainfall and runoff data have been
collected within the watershed and a flume located at its outlet. Twenty-nine
events were extracted from this historical database to provide a means
to assess the impact of cell resolution on runoff accuracy.
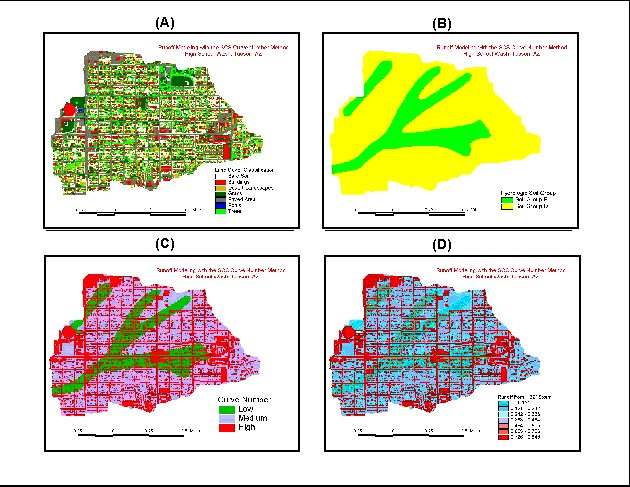 In this project, students
model runoff for each cell resolution for each event. To do so, a combinatorial
function must be created to derive Curve Numbers for the watershed based
on land use and soils data (Figure 2). Map
algebra statements are used to integrate the SCS Curve Number model
with the various GIS layers and precipitation data. In this manner 135
maps of distributed runoff are produced (Figure
2D), and cumulative runoff predicted for the watershed for each
event. Cumulative runoff estimates are then compared to the observed values
by cell resolution. Table 2 presents the simulated runoff results using
mean estimated values from the 29 events and the Nash-Sutcliffe coefficient
(Martinec and Rango, 1989). Note the inverse trend in runoff prediction
with increasing cell size, even though cell resolution was accounted for
in the modeling process. Students are thereby introduced to the evaluation
of runoff simulations since they are expected to interpret the results
using a variety of parametric and non-parametric tests.
In this project, students
model runoff for each cell resolution for each event. To do so, a combinatorial
function must be created to derive Curve Numbers for the watershed based
on land use and soils data (Figure 2). Map
algebra statements are used to integrate the SCS Curve Number model
with the various GIS layers and precipitation data. In this manner 135
maps of distributed runoff are produced (Figure
2D), and cumulative runoff predicted for the watershed for each
event. Cumulative runoff estimates are then compared to the observed values
by cell resolution. Table 2 presents the simulated runoff results using
mean estimated values from the 29 events and the Nash-Sutcliffe coefficient
(Martinec and Rango, 1989). Note the inverse trend in runoff prediction
with increasing cell size, even though cell resolution was accounted for
in the modeling process. Students are thereby introduced to the evaluation
of runoff simulations since they are expected to interpret the results
using a variety of parametric and non-parametric tests.
Table 2. Simulation results
for 29 runoff events on High School Wash, Tucson, AZ. Prediction was made
with the SCS Curve Number method using GIS techniques.
| |
|
Predicted runoff by
grid cell size
|
| |
Observed
|
25
|
50
|
100
|
200
|
300
|
|
Average runoff
|
0.264
|
0.273
|
0.263
|
0.253
|
0.229
|
0.218
|
|
Nash-Sutcliffe
|
|
0.802
|
0.807
|
0.804
|
0.766
|
0.733
|
Distributed Runoff
Modeling
Distributed hydrologic models
require both skilled application and wealth of spatially distributed data.
Parameterizing these models can be onerous due to the amount and complexity
of the input files. We investigate the use of GIS to circumvent some of
these problems and apply the distributed physically-based runoff model
KINEROS (Smith et al., 1995) to a rangeland watershed. The objectives of
this exercise are to introduce emerging research in distributed modeling,
become familiarized with model parameterization in GIS, and understand
the limitations and influences of geographic data on model performance.
The subwatershed characterization tool TOPAZ (Garbrecht and Martz, 1995)
is used to delineate subwatershed elements and a separate program written
by Syed (1999) takes output data from TOPAZ to generate input data files
for KINEROS. KINEROS is run several times using a variety of input data
sources to evaluate their influences on event-based runoff prediction.
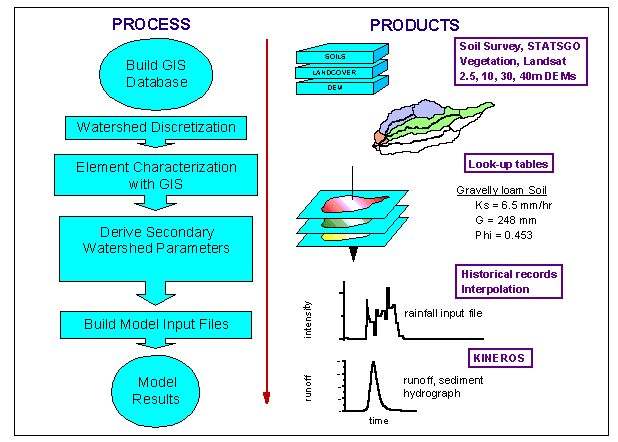
Students are presented with
theme layers of soils, vegetation, and topography for a portion of Walnut
Gulch. TOPAZ is used to discretize the watershed into elements used in
the modeling process based on topography.
 Primary GIS data are then manipulated to produce derivative map
products representing distributed watershed characteristics
necessary for hydrologic modeling such as canopy cover, soil texture, saturated
hydraulic conductivity, and routing sequence (Figure 3).
Historical rainfall data, measured at numerous rain gauges within the
study area, is interpolated across the surface and input to the model
on a per-element basis. KINEROS simulates excess rainfall for each
element and routes the runoff to the outlet according to the scheme
determined by TOPAZ (Figure
4).
Primary GIS data are then manipulated to produce derivative map
products representing distributed watershed characteristics
necessary for hydrologic modeling such as canopy cover, soil texture, saturated
hydraulic conductivity, and routing sequence (Figure 3).
Historical rainfall data, measured at numerous rain gauges within the
study area, is interpolated across the surface and input to the model
on a per-element basis. KINEROS simulates excess rainfall for each
element and routes the runoff to the outlet according to the scheme
determined by TOPAZ (Figure
4).
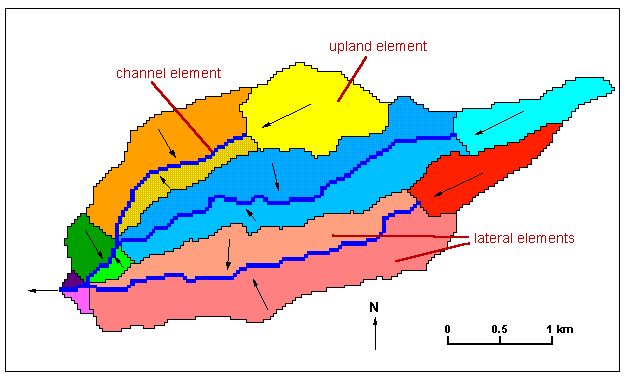
This lab is used to introduce
scale issues in hydrologic modeling. The effects of scale and the
representation
of hydrologic processes are important emerging topics in natural resource
science. Figure 4 shows a small watershed subdivided into 18 elements (3
uplands, 10 laterals, and 5 channels). By lowering the estimated position
at which channels begin on a hillslope, the size and number of elements
changes. By increasing or reducing the complexity, the spatial variability
of hydrologic processes in affected. Increasing the average element size
decreases the complexity of watershed representation and reduces the spatial
variability input to the model. Limiting the spatial variability can have
an adverse effect on model efficiency, but creating an overly complex
configuration
introduces parameter estimation error and may not be necessary depending
on the scale of application. In this lab, students vary the complexity
of watershed representation and evaluate the impact of spatial averaging
on model efficiency.
SUMMARY
A class has been developed
at the University of Arizona that is designed for graduate students using
GIS in their hydrologic and watershed management research. Students are
exposed to emerging topics in spatial analysis and natural resource science
through a series of lab exercises tailored to current topics and student
need. Influences of scale, complexity, and the representation of spatially
variable data on research and management decisions are stressed throughout
the semester. Students are encouraged to probe the limitations imposed
by various data sources to better understand the appropriate synthesis
of spatial data, modeling, and interpretation.
APPENDIX I: READING LIST FOR WSM 569
General
Beven, K.J. and I.D. Moore
(Editors). 1992. Terrain Analysis and Distributed Modelling inHydrology. John Wiley
& Sons, New York.
Burrough, P.A., and R.A.
McDonnell, 1998. Principles of Geographical Information Systems.
Oxford University Press, New York. 333 pp.
Kalma, J.D. and M. Sivapalan
(Editors). 1995. Scale Issues In Hydrological Modelling. John Wiley
& Sons, New York.
Water Resources Planning
and Management, Journal of. 1993. Special GIS Issue. Vol 119(2).
Classification
Eastman, J.R., W. Jin, P.A.K.
Kyem, and J. Toledano. 1995. Raster procedures of multi-criteria/multi-objective
decisions. Photogrammetric Engineering and Remote Sensing 61(5): 513-517.
Omi, P.N, L.C. Wensel, and
J.L. Murphy. 1979. An application of multivariate statistics to and-use
planning: Classifying land units into homogeneous zones. Forest Science
25(3): 399-414.
Warren, S.D., V.E. Diersing,
P.J. Thompson and W. D. Goran. 1989. An erosion-based land classification
system for military installations. Environmental Management 13(2): 251-257.
Interpolation
Creutin, J.D. and C. Obled.
1982. Objective analyses and mapping techniques for rainfall fields: An
objective comparison. Water Resources Research 18(2): 413-431.
Davis, J.C. 1986. Statistics
and Data Analysis in Geology. John Wiley & Sons, New York.
Isaaks, E.H., R.M. Srivastava,
1989. Applied Geostatistics. Oxford University Press, New York,
561 pp.
Kruizinga, S. and G.J. Yperlaan.
1978. Spatial interpolation of daily totals of rainfall. Journal of Hydrology
36: 65-73.
Kwaadsteniet, J.W. 1990.
On some fundamental week spots of Kriging technique and their consequences.
Journal of Hydrology 114: 227-284.
Lee, P.S., P.P. Lynn and
E.M. Shaw. 1974. Comparison of multiquadric surfaces on the estimation
of areal rainfall. Hydrological Sciences XIX, 3 9/1974.
Tabios III, G.Q. and J.D.
Salas. 1985. A comparative analysis of techniques for spatial interpolation
of precipitation. Water Resources Bulletin 3: 365-389.
Wahba, G. 1990. Spline models
for observational data. CBMS-NSF Regional Conference Series in Applied
Mathematics, Philadelphia Soc Ind Applied Maths.
Watson, D.F. and Philip,
G.M. 1985. A refinement of inverse distance weighted interpolation. Geo-processing
2: 315-327.
Terrain Analysis
Band, L.E. 1986. Topographic
partition of watersheds with digital elevation models. Water Resources
Research 22(1): 15-24.
Cowen J. 1993. A proposed
method for calculating the LS factor for use with the USLE in a grid-based
environment. In: Proceedings of the Thirteenth Annual Esri User Conference,
Volume 1. pp. 65-74.
Djokic, D., and D. R. Maidment,
1992. Application of GIS network routines for water flow and transport.
Journal of Water Resources Plannning and Management 119(2): 229-245.
Eash, D. E, 1994. A geographic
information system procedure to quantify drainage-basin
characteristics. Water Resources
Bulletin 30(1):1-8.
Garbrecht, J. and P. Starks.
1995. Note on the use of USGS level 1 7.5-minute DEM coverages for landscape
drainage analysis. Photogrammetric Engineering and Remote Sensing 61(5):
513-517.
Garbrecht, J., P. J. Starks,
and L. W. Martz, 1996. New digital landscape parameterization methodologies.
Proceedings of the AWRA 32nd Annual Conference and Symposium: GIS and Water
Resources, Sept. 22-26, 1996, Fort Lauderdale, FL, pp. 357-365.
Hodgson, M.E. 1995. What
cell size does the computed slope/aspect angle represent?
Photogrammetric Engineering
and Remote Sensing 61(5): 513-517.
Hoover, K. A., M. G. Foley,
P. G. Heasler, and W. W. Boyer, 1991. Sub-grid-scale characterization of
channel lengths for use in catchment modeling. Water Resources Research
27(11): 2865-2873.
Hutchinson, M.F. 1989. A
new procedure for gridding elevation and stream line data with automatic
removal of spurious pits. Journal of Hydrology 106: 211-232.
Jenson, S.K. 1991. Applications
of hydrologic information automatically extracted from digital elevation
models. In: Beven, K.J. and I.D. Moore (Editors). 1992. Terrain Analysis
and Distributed Modelling in Hydrology. John Wiley & Sons, New York.
pp. 35-48.
Jenson, S.K. and J.O. Domingue.
1988. Extracting topographic structure from digital elevation data for
geographic information system analysis. Photogrammetric Engineering and
Remote Sensing 54(11): 1593-1600.
Miller, S.N., D.P. Guertin
and D.C. Goodrich. 1996. Linking GIS and geomorphologic field research
at Walnut Gulch Experimental Watershed. In: GIS and Water Resources, Proceedings
of the American Water Resources Association 32nd Annual Conference and
Symposium, September 22-26, 1996, Fort Lauderdale, FL. pp. 327-335.
Miller, S. N., M. Hernandez,
and L. J. Lane, 1997. GIS applications in the spatial extrapolation of
hydrologic data from experimental watersheds. Proceedings of the Conference
on Management of Lands Disturbed by Channel Incision, May 19-22, 1997,
Oxford, Miss., USA, pp. 633-638.
Moore, I.D., R.B. Grayson
and A.R. Ladson. 1992. Digital terrain modelling: A review of
hydrological, geomorphological
and biological applications. In: Beven, K.J. and I.D. Moore (Editors).
1992. Terrain Analysis and Distributed Modelling in Hydrology. John Wiley
& Sons, New York. pp. 7-34.
Panuska, J.C. I.D. Moore
and L.A. Kramer. 1991. Terrain analysis: Integration into the agricultural
nonpoint source (AGNPS) pollution model. Journal of Soil and Water Conservation
(January-February). pp. 59-64.
Quinn, P., K. Beven, P. Chevallier,
and O. Planchon. 1991. The prediction of hillslope flow paths for distributed
hydrological modeling using digital terrain models. In: Beven, K.J. and
I.D. Moore (Editors). 1992. Terrain Analysis and Distributed Modelling
in Hydrology. John Wiley & Sons, New York. pp. 63-84.
Tachikawa, Y., M. Shiba,
and T. Takasao, 1994. Development of a basin geomorphic information system
using TIN-DEM data structure. Water Resources Bulletin 30(1):9-17
Tarboton, D.G., R.L. Bras
and I. Rodriguez-Iturbe. 1992. On extraction of channel networks from digital
elevation data. In: Beven, K.J. and I.D. Moore (Editors). 1992. Terrain
Analysis and Distributed Modelling in Hydrology. John Wiley & Sons,
New York. pp. 85-104.
U.S. Geological Survey. 1990.
Digital
Elevation Models Data Users Guide. Reston, Virginia. 51 pp.
Sources of Error and Scale
Issues
Bloschl, G. and M. Sivapalan.
1995. Scale issues in hydrological modelling: A review. In: Kalma, J.D.
and M. Sivapalan (Editors). 1995. Scale Issues In Hydrological Modelling.
John Wiley & Sons, New York. pp. 9-48.
Hu, Z. and D.P. Guertin.
1991. The effect of GIS database grid size on hydrologic simulation results.
In: Proceedings of the 1991 meetings of the Arizona-Nevada Academy of Science
û Hydrology Section, Hydrology and Water Resources in Arizona and the Southwest,
Vol. 21: 59-63.
Hunter, G.J. and M.F. Goodchild.
1995. Dealing with error in spatial databases: A simple case study. Photogrammetric
Engineering and Remote Sensing 61(5): 513-517.
Lanter, D.P. and H. Veregin.
1992. A research paradigm for propagating error in layer-based GIS. Photogrammetric
Engineering and Remote Sensing 58(6): 825-833.
Miller, S.N., D.P. Guertin,
and D.C. Goodrich, 1999. Using high-resolution synthetic aperture radar
terrain mapping: influences on hydrologic and geomorphic investigation.Proceedings
of the AWRA Annual Summer Specialty Conference on Wildland Hydrology, Bozeman,
MT, June 30-July 2, 1999, pp. 219-226.
Miller, S.N., D.P. Guertin,
and L.R. Levick, 1999. Influence of map scale on drainage network representation.
Proceedings of the 1999 meetings of the Arizona-Nevada Academy of Science
û Hydrology Section, Hydrology and Water Resources in Arizona and the Southwest.
Stuede, M.M. and D.M. Johnston.
1990. Runoff volume estimation using GIS techniques. Water Resources Bulletin
26(4): 611-620.
Thapa, K. and J. Bossler.
1992. Accuracy of spatial data used in geographic information systems.
Photogrammetric Engineering and Remote Sensing 58(6): 835-841.
Walsh, S.J., D.E. Lightfoot,
D. R. Rutler. 1987. Recognition and assessment of error in geographic information
systems. Photogrammetric Engineering and Remote Sensing 63(10): 1423-1430.
Woodcock, C.E. and A.H. Strahler.
1987. The factor of scale in remote sensing. Remote Sensing of Environment
21: 311-332.
Modelling
Bhaskar, N. R, W. P. James,
and R. S. Devulapalli, 1992. Hydrologic parameter representation estimation
using geographic information system. Journal of Water Resources Planning
and Management 118(5):492-512.
Blaszczynski, J., 1994. Watershed
soil erosion, runoff and sediment yield prediction using geographic information
systems: a manual of GIS procedures. USDI-BLM Report BLM/SC/ST-94/006+7000.
DeVantier, B. A. and A. D.
Feldman, 1993. Review of GIS applications in hydrologic modeling. Journal
of Water Resources Planning and Management 119(2): 246-261.
Goodrich, D.C., L.J. Lane,
D.A. Woolhiser, R. Shillito, S.N. Miller, and K.H. Syed, 1997. Linearity
of basin response as a function of scale in a semi-arid ephemeral watershed.
Water Resources Research 33(12): 2951-2965.
Miller, S.N., J.J. Stone,
D.P. Guertin, and J.G. Hernandez, 1999. Influences of geographical information
system watershed characterization for hydrologic modeling. Proceedings
of the AWRA Annual Summer Specialty Conference on Wildland Hydrology, Bozeman,
MT, June 30-July 2, 1999, pp. 503-507.
Radko, M. A. 1997. Spatially
linking basinwide stream inventories to Arcs representing streams in a
geographic information system. USFS Intermountain Research Station General
Technical Report INT-GTR-345.
Sasowsky, K. S., and T. W.
Gardner, 1991. Watershed configuration and geographic information system
parameterization for SPUR model hydrologic simulations. Water Resources
Bulletin 27(1): 7-17.
Srinivasen, R., and J. G.
Arnold, 1994. Integration of a basin-scale water quality model with GIS.
Water Resources Bulletin 30(3): 453-462.
VanBlargen, E. J., and R.
M. Ragan, 1991. Data acquisition for hydrologic GIS. Hydraulic Engineering:
Proceedings of the 1991 National Conference Sponsored by the Hydraulics
Division of the American Society of Civil Engineers. pp. 876-881.
Warwick, J.J. and S.J. Haness.
1994. Efficacy of ARC/INFO GIS application to hydrologic modeling. Journal
of Water Resources Planning and Management 10(3): 366-381.
REFERENCES
Burrough, P.A., and R.A.
McDonnell, 1998. Principles of Geographical Information Systems.
Oxford University Press, New York. 333 pp.
Esri, 1998. Arc/Info ver.
7.2.1 On-Line Documentation.
Garbrecht, J., and L.W. Martz,
1995. TOPAZ: an automated digital landscape analysis tool for topographic
evaluation, drainage identification, watershed segmentation, and subcatchment
parameterization. USDA-ARS Publication No. NAWQL 95-1, USDA-ARS, Durant,
OK. 16 pp.
Heller, J.A., D.P. Guertin,
S.N. Miller, and J.J. Stone, 1999. GIS for watershed assessment: integrating
spatial and tabular data to derive parameters for a hydrologic simulation
model (ARDBSN). This Issue: Proceedings of the 19th Annual
Esri UserÆs Conference, July 26-30, 1999, San Diego, CA.
Huth, H.J., 1997. Hydrogeochemical
modeling of Western Mountain front recharge, upper Cienega Creek sub-basin,
Pima County, Arizona. M.S. Thesis, Department of Hydrology and Water Resources,
The University of Arizona.
Levick, L.R., 1998. Prediction
of rainfall and snowmelt produced runoff: linking a hydrologic model with
remote sensing and GIS. M.S. Thesis, School of Renewable Natural Resources,
The University of Arizona, 213 pp.
Levick, L.,R., L.J. Lane,
and M.H. Nichols, 1999. Snow cover mapping using AVHRR images and GIS for
snowmelt runoff prediction. Proceedings of International Conference on
Water, Environment, Ecology, Socio-Economics, and Health Engineering, Oct
18-21, 1999, Seoul, Korea.
Martinec, JH., and A. Rango,
1989. Merits of statistical criteria for the performance of hydrological
models. Water Resources Bulletin 25(2): 421-432.
Miller, S.N., and D.P. Guertin,
1998. WSM 569: Spatial Analysis for Hydrology and Watershed Management:
Home Page. http://www.tucson.ars.ag.gov/wsm569.
(a) Miller, S.N., D.P. Guertin,
and D.C. Goodrich, 1999. Using high-resolution synthetic aperture radar
terrain mapping: influences on hydrologic and geomorphic investigation.Proceedings
of the AWRA Annual Summer Specialty Conference on Wildland Hydrology, Bozeman,
MT, June 30-July 2, 1999, pp. 219-226.
(b) Miller, S.N., D.P. Guertin,
and L.R. Levick, 1999. Influence of map scale on drainage network representation.
Proceedings of the 1999 meetings of the Arizona-Nevada Academy of Science
û Hydrology Section, Hydrology and Water Resources in Arizona and the Southwest.
Renard, K.G., L.J. Lane,
J.R. Simanton, W.E. Emmerich, J.J. Stone, M.A. Weltz, D.C. Goodrich, and
D.S. Yakowitz. Agricultural Impacts in a Arid Environment: Walnut Gulch
Studies. Hydrological Science and Technology 9(1-4):145-190.
Smith, R. E., D. C. Goodrich,
D. A. Woolhiser, and C. L. Unkrich, 1995. KINEROS û A kinematic runoff
and erosion model, In: Computer Models of Watershed Hydrology, edited by
V. P. Singh, Water Resources Publications, Highlands Ranch, CO.
Syed, K.H., 1999. The impacts
of digital elevation model type and resolution on hydrologic modeling.
Ph.D. Dissertation, Department of Hydrology, The University of Arizona,
256 pp.
U.S. Department of Agriculture
Soil Conservation Service, 1972. Hydrology, Section 4, Soil Conservation
Service National Engineering Handbook, US Government Printing Office, Washington,
D.C.
Wischmeier, W.H., and D.B.
Smith, 1978. Predicting rainfall-erosion losses û a guide to conservation
planning. USDA Agricultural Handbook No. 282.
Youberg, A., 1998. An evaluation
of selected watershed assessment techniques. M.S. Thesis, School of Renewable
Natural Resources, The University of Arizona, 213 pp.
AUTHOR AFFILIATIONS
(1) Scott N. Miller,
Senior Research Specialist, USDA-ARS Southwest Watershed Research Center, 2000 E. Allen Rd., Tucson, AZ 85719, ph: 520-670 6481, miller@tucson.ars.ag.gov
(2) D. Phillip
Guertin, Associate Professor, School of Renewable Natural
Resources, The University of Arizona, Room 325 BioSciences East,
Tucson, AZ 85721, ph: 520-621-1723, phil@nexus.srnr.arizona.edu