Darko Barbalić
Višnja Omerbegović
CORRECTION OF HORIZONTAL AREAS IN TIN TERRAIN MODELING - ALGORITHM
ABSTRACT:
The TIN model of terrain as a basis of the spatial analysis of reservoir Botonega watershed (Republic of Croatia), resulted in significant number of horizontal areas which were inappropriate presentation of reality. The authors developed and applied the algorithm to overcome this anomaly on acceptable way. The specific feature of proposed algorithm is that it applies the elementary analysis on morphology of horizontal areas as a basis for interpolation of extra break lines. The simple concept of algorithm gives possibility for its further improvement in direction of developing more detailed analysis and correction of horizontal areas as well as in direction of its use as an initial concept for solving other problems in terrain modeling.
INTRODUCTION
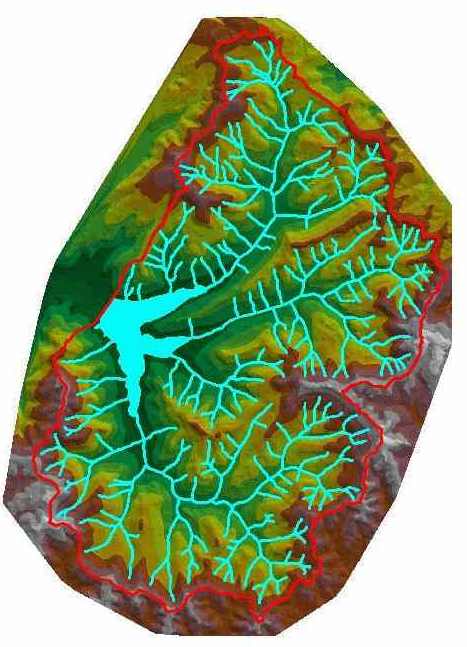
While working on hydrologic analysis of watershed of reservoir Botonega (Republic of Croatia) authors faced specific problem of irregular flat areas. It was induced not only due to poor quality of available input data (contour lines without break lines and elevation points) but also due to TIN triangulation specifics ([7], [6]). As a result, these irregularities made the analysis required for future hydrologic computations (determination of watershed boundaries and flow paths and characteristics, computation of reservoir volume, sediment transport etc.) inaccurate and impractical to perform. On the other side, solution to this problem should provide maximum compatibility in order to enable use of other analysis and mapping tools. Available time for reaching the solution was quite short due to limited project end date.
FIG 1: WATERSHED OF BOTONEGA RESERVOIR
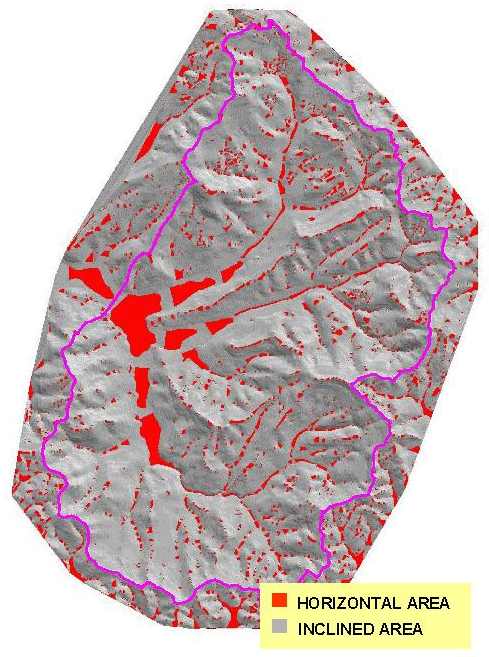
FIG 2: UNCORRECTED TIN - HORIZONTAL AREAS
By visual inspection of TIN terrain model, the three main types of irregular flat areas were detected:
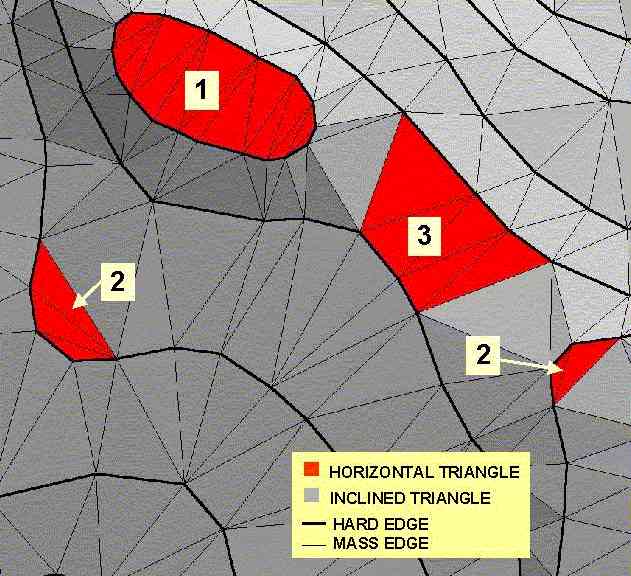
FIG 3: TYPES OF HORIZONTAL AREAS
Correction of first type of irregularity was carried out manually since this irregularity was found in far smaller extent and complementary elevation points were easy to detect on available maps.
For the second and third type of flat areas, manual correction was almost impossible since:
In the literature, available to the authors, following main methods of solution were proposed:
At the beginning, numerical interpolations seemed most likely to produce swift and satisfactory result. Unfortunately trials have shown that newly created TINs contained numerous false pits and peaks. This was case, predominantly in the narrow gorges. Problem is mainly because the methods were created for interpolation of characteristic points and lines of terrain morphology (like peaks and break lines which were not available).
Oppositely, available contour lines are just representation of elevation boundaries and consequently do not have all required morphology data. For that reason a new approach of reconstructing terrain morphology features had to be found.
DESCRIPTION OF PROPOSED ALGORITHM
The method proposed is in the course of reconstruction of missing morphology features of terrain. It analyzes previously created TIN terrain model with irregular flat area and recommends possible break lines. This is enabled by following properties of 3D Analyst TIN object model:
Referring to 3D Analyst terminology, triangle edge belonging to contour line is marked as HARD and triangle edge inset by computer is marked as MASS. However, the complete classification is wider but for purposes of this paper is irrelevant. By visually inspecting uncorrected TIN terrain model it is obvious that flat areas on ridges and narrow gorges consist mostly of two types of flat triangles:
Two neighboring triangles of the same flat area are interconnected via MASS side.
Flat area ends on its front and back edge by two types of triangles:
FIG 4: MORPHOLOGY OF FLAT AREA
It is assumed that break line to be created travels through middle points of MASS sides of flat triangles. Break line ends are at nodes of ending triangles which are opposite to the MASS sides by which are connected to flat area. Elevation of break line is Interpolated linear between end points.
The main problem is appearance of flat triangles with three sides MASS (FIG 4 - 2). They are positioned at the places where flat area separates in two branches and consequently real position and elevation of break line becomes even more uncertain. At that point, decision which branch to follow can be based on two conditions. First are the lengths of bordering sides of neighboring triangles and second are their areas. It can be also determined whether to continue analysis to the end of flat area or to stop there and continue if required in the next iteration. This assumptions are, certainly, questionable and are implemented here because of their simplicity and therefore they should be reconsidered with care in future improvements of algorithm. However, they depend not only on terrain morphology but also on manner of vectorisation of contour lines. Because of that, more delicate analysis would be required to obtain significantly better results.
FLOW CHART
The flow chart with explanation is attached:
In order to make the flow chart easier to read, the following simplifications are made:
|
OBJECTS ( FIG 5): |
|
|
T |
currently processing triangle |
|
Ti |
triangle i, neighbor of triangle T, i = 0, 1, 2 |
|
Pi |
node i of triangle T, i = 0, 1, 2 |
|
Si |
side i of triangle T, i = 0, 1, 2 |
|
Ci |
center of side i of triangle T (point) , i = 0, 1, 2 |
|
OPERATIONS ( FIG 6): |
|
|
:= |
assignment |
|
=, <, > |
comparison |
|
PROCEDURES ( FIG 6): |
|
|
ADD(P) |
puts point P in list |
|
INTERPOLATION |
creation of break line using the points in the list and linear interpolation of elevations |
|
FUNCTIONS ( FIG 6): |
|
|
LEN(Si) |
returns length of side S of triangle T |
|
NEW |
returns following triangle from TIN |
|
SLOPE(Ti) |
returns slope of triangle Ti |
|
TYPE(Si) |
returns type of side i of triangle T (HARD or MASS) |
FIG 5: TRIANGLE NOTATION

FIG 6: SIMPLIFIED FLOW CHART
IMPLEMENTATION - ArcView AVENUE SCRIPT
This method is implemented as ArcView 3D Analyst AVENUE script. However, script is far more complicated than algorithm, but the basics are the same. As input it uses first active TIN theme. Existence of editable LINEZ theme in active view is also required. It is used for placement of newly created break lines (corrections) for following reasons:
TIN terrain model (created with new additional break lines) can also have flat areas (in a far smaller extent) due to possible divisions of flat areas on branches but they can be removed by repeating of procedure. This iterations can be made automatically or by subsequent script calls.
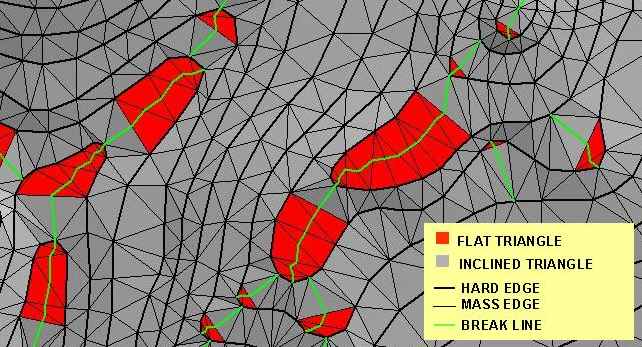
FIG 7 : INSERTED BREAK LINES (DETAIL)
Flat areas on the edge of the TIN are not interpolated because lack of data. There are three variables set on begin of script by which execution can be altered:
|
VARIABLES |
||
|
NAME |
VALUE |
MEANING |
|
mode_of_work (integer) |
1 |
when break line reaches to MASS - MASS - MASS triangle continues in the branch which is connected by the longer triangle side |
|
2 |
when break line reaches to MASS - MASS - MASS triangle continues in the branch which is connected by the shorter triangle side |
|
|
3 |
when break line reaches to MASS - MASS - MASS triangle continues in the branch which is connected by the triangle with larger area |
|
|
4 |
when break line reaches to MASS - MASS - MASS triangle continues in the branch which is connected by the triangle with smaller area |
|
|
iterative (Boolean) |
true |
iterative execution of script until all flat areas are corrected |
|
false |
execution of only one pass of correction |
|
|
clip_break_line (Boolean) |
true |
inserts break line only to the arrival to the first MASS - MASS - MASS triangle |
|
false |
inserts break line to the end of flat area using rules defined by mode_of_work |
|
ArcView and Avenue specifics are described in detail in [1], [2] and [3].
EXAMPLE OF RESULTS
As it was mentioned above this method was used for spatial analysis of Botonega reservoir watershed. The initial input data used for generation of TIN consisted of 2960 km of contour lines (scale 1:25000) and 179 elevation points. This script in three passes created 403 km of additional break lines. As an illustration, the results of watershed delineation are compared with those based on different sources.
Results are marked as follows:
|
WATERSHED DELINEATION RESULTS |
||||
|
METHOD |
WATERSHED AREA |
WATERSHED BOUNDARY |
||
|
km2 |
DIFF. (%) |
km |
DIFF. (%) |
|
|
1 |
73.29 |
0.35 |
41.25 |
6.81 |
|
2 |
< 2.00 |
/ |
/ |
/ |
|
3 |
< 2.00 |
/ |
/ |
/ |
|
4 |
73.01 |
0.04 |
43.13 |
2.55 |
|
5 |
73.03 |
- |
44.26 |
- |
Results of flow path tracing for a part of the watershed are shown on FIG 8.
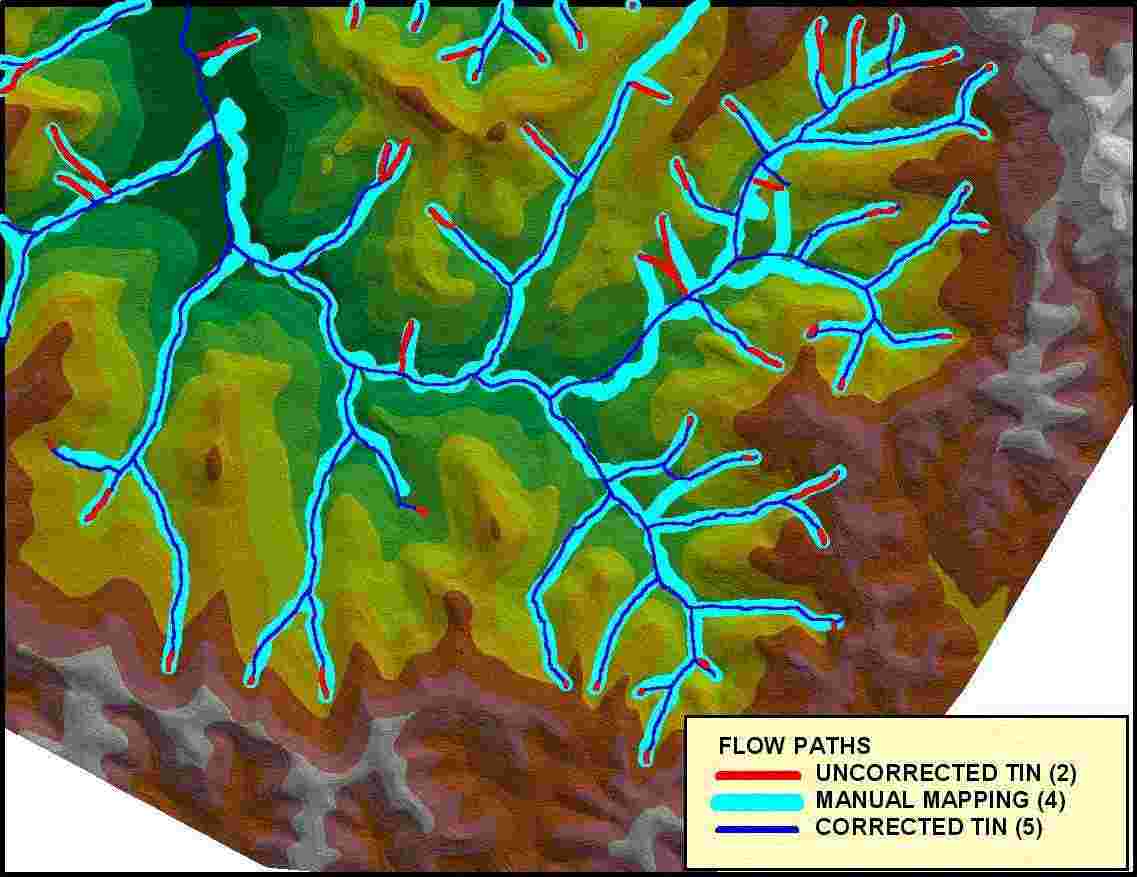
FIG 8 COMPARISON OF FLOW PATH TRACING
CONCLUSION
While working on hydrologic analysis of watershed of reservoir Botonega (Republic of Croatia) authors were confronted to specific problem of irregular flat areas. To overcome this problem and continue analysis with retaining full compatibility with available tools, ArcView AVENUE script was developed. Corrections of irregular TIN terrain model are made by introducing of additional break lines. This method have shown very good results in application. However future improvements are possible. They should include more precise terrain morphology analysis to enable better interpretation of available data.
As mentioned at the beginning of this paper, irregularities on mountain peaks and bottom of pits are not considered and corrected so this could be also included in future improvements.
REFERENCES
|
[1] |
ArcView 3D Analyst, Environmental Systems Research Institute, Inc., Redlands, USA, 1997 |
|
[2] |
ArcView GIS, The Geographic Information System for Everyone, Environmental Systems Research Institute, Inc., Redlands, USA, 1994 |
|
[3] |
Avenue Customization and Application Development for ArcView GIS, Environmental Systems Research Institute, Inc., Redlands, USA, 1994 |
|
[4] |
Cell - based Modeling with GRID, Environmental Systems Research Institute, Inc., Redlands, USA, 1994 |
|
[5] |
Herbert M.J., Strugnell N.C., Kidner D.B., Ware M.: Local and Global Approaches for Constructing TIN's From Contour Data, Joint European Conference and Exhibition on Geographical Information, Barcelona, Spain, 1996. |
|
[6] |
Meijerink A.M.J., de Brouwer H.A.M., Mannaerts C.M., Valenzuela C.R.: Introduction to the Use of Geographic Information Systems for Practical Hydrology, International Institute for Aerospace Survey and Earth Sciences (ITC), Enschede, The Netherlands, 1994 |
|
[7] |
Surface Modeling with TIN, Environmental Systems Research Institute, Inc., Redlands, USA, 1994 |
AUTHORS:
Darko Barbalić, B.Sc.CE, Hrvatske vode, Zagreb, Croatia (darkob@voda.hr)
Višnja Omerbegović, B.Sc.EE, Hrvatske vode, Zagreb, Croatia (ovisnja@voda.hr)