The paper will discuss the ways in which ArcView GIS, interfaced with educational and demographic data, allowed the University of Akron, Center for Policy Studies to identify and eligible population and randomly select the sample of schools for this multi-million dollar research study.
Introduction:
The Institute for Health and Social Policy obtained a grant to study intervention effects and substance abuse outcomes of revised Drug Abuse Resistance Education (DARE) middle school and high school curricula programs. A large sample of schools needed to be garnered for the study. Randomly selecting from all of the approximately 16,500 public school districts in the U.S. was possible from a methodological standpoint, but travel expenses, and logistics would have quickly exhausted the research grant.
It was determined that multiple clusters of school districts surrounding a core large city school district would provide the optimal mix of school diversity while keeping the project within the budget. Research offices were to be set up in each cluster, and a random selection of outlying districts, along with the inner city district would make up the sample. Ideally, each cluster would have schools with a diverse collection of demographic characteristics, and wholly, all of the clusters would be a representative portrait of the country.
The data files are from the National Center for Education Statistics (NCES). They have address files, district/agency files and building level files. We downloaded all of them for the 1997-1998 school year. These were the most recent data available at the time. In the NCES Common Core of Data for 1997-98, there were over 90,000 school buildings and 16,500 districts. Most of these were school districts were in the United States, but there were at overseas locations. These were screened out prior to analysis. Although available to the pubic, data from these sources are often in a base format that requires importation into a software package (Excel, SPSS, etc...) and considerable effort to get them into a genuinely useable format. Commonly these data are plain ASCII text, either delimited or flat.
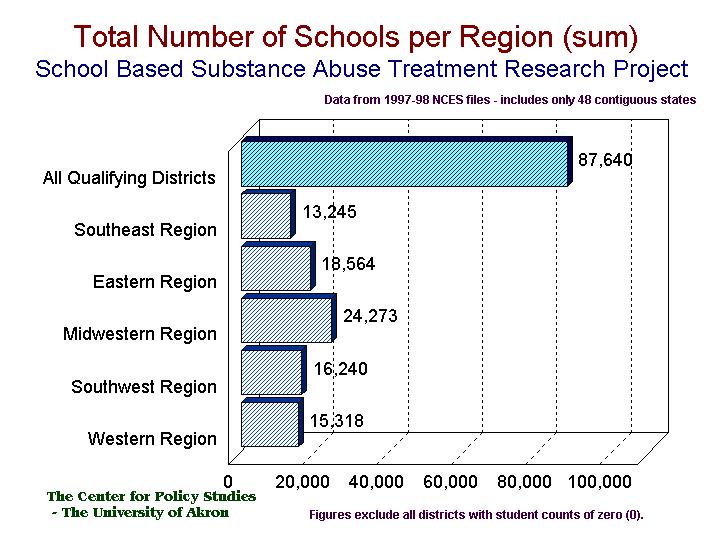
Once the data were imported into SPSS, the agency or district data were appended to the building level data. This created a single national file of all public school buildings in the U.S., and also permitted upward aggregation of building data to the district. Schools were categorized as elementary schools, middle schools and high schools. The number of schools, by category could then be determined by district, county, state, region and so on.
Numerous graphics were created to examine the national, regional and state characteristics and distribution of schools.
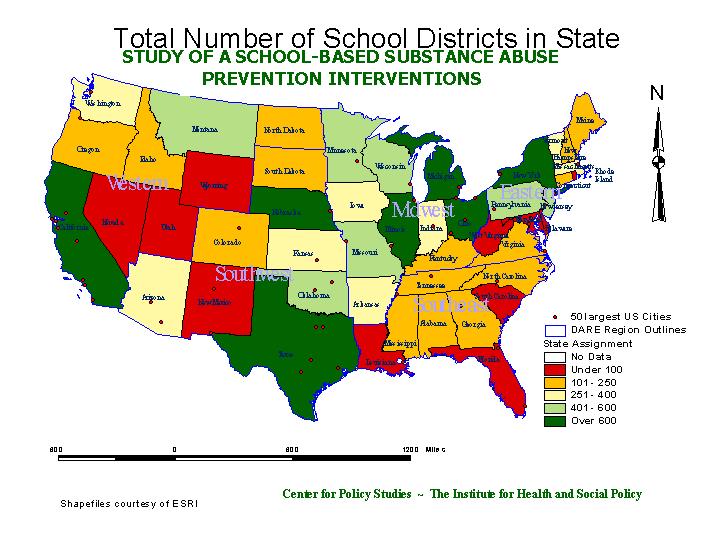
Then aggregated school data were mapped, using ArcView. This is the gross count of school districts by state. It does include some districts that are not appropriate for the study, such as Vocational schools (which often take students from multiple districts), small districts without distinct middle and high schools, and so on.
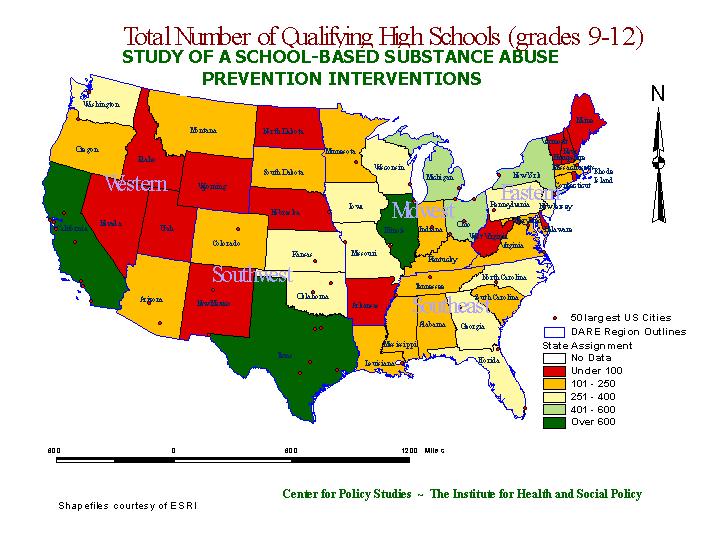
Data were refined, and the this map shows the total number of qualifying grade 9 to 12 high schools, by state and region. There are clear changes in color between the maps, suggesting regional differences in school composition. These included but were not limited to some states having larger districts, and hence some districts with multiple high schools. Also, some states have more districts have different varieties of high schools (grades 8-12, or 10-12, for instance.)
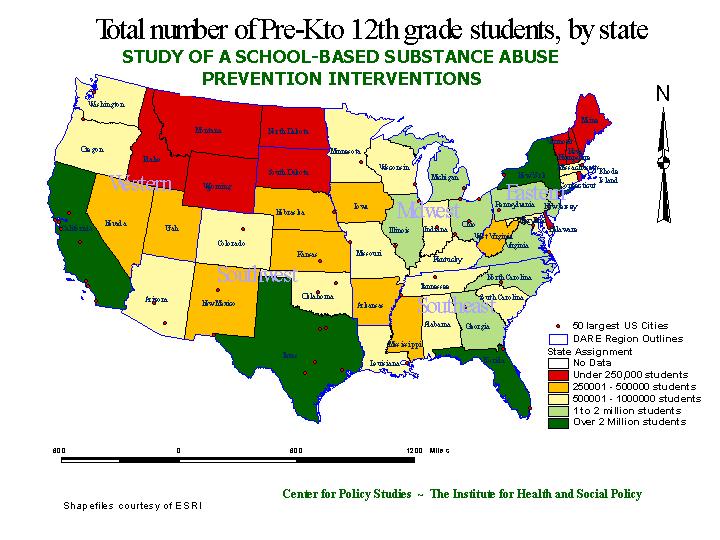
This next map shows the aggregate number of students (as a rough measure of population density) by state.
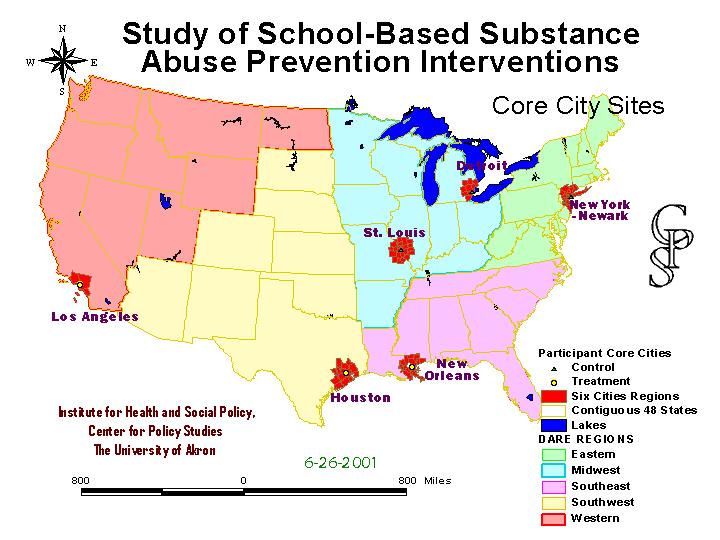
Meanwhile, core (large) city school districts were recruited to act as the anchor for the regional clusters. This maps shows the six study regions surrounded by the counties from which outlying school districts could be randomly selected for the study.
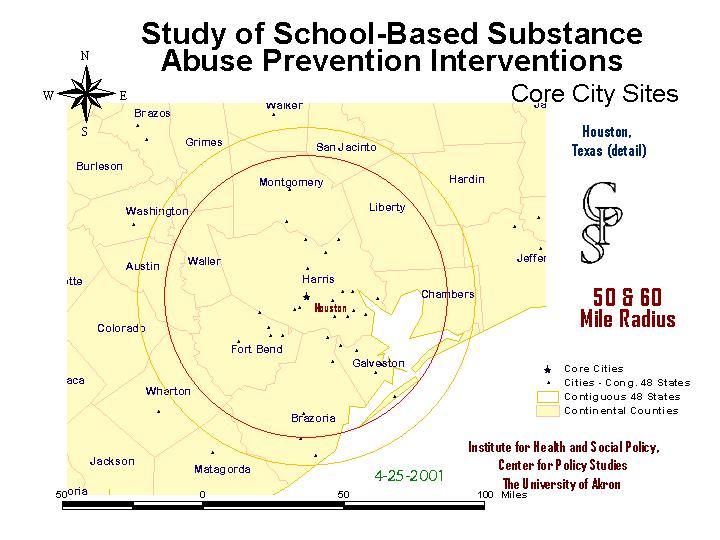
Houston will serve as the first example of the selection technique. A 50 mile radius circle was drawn from the the geographic center of Houston. Using ArcView's select by theme feature, all school districts that were within 50 miles of Houston's center point (or within the circle) were selected as study candidates. The selected districts were exported, and used as a screen to identify potential study districts in the master data file. Districts with a small portion of their territory within the circle were given extra attention as to their feasibility in the study. Individual schools were occasional geocoded, to determine their location within the district. The drive time from the cluster office, which usually depended on the existence or lack or a nearby highway, was also mapped.
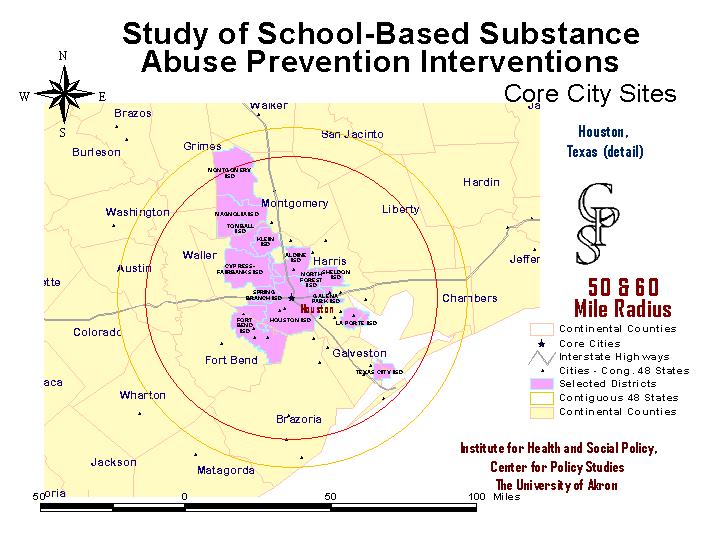
The next map shows a number of randomly selected school districts. ArcView identified the districts geographically available for the study. The master data file, which was in SPSS, had all available variables, and allowed the Center to screen out districts, or individual schools in districts that did not meet study criteria. Of course, not all randomly selected schools would agree to be in the study.
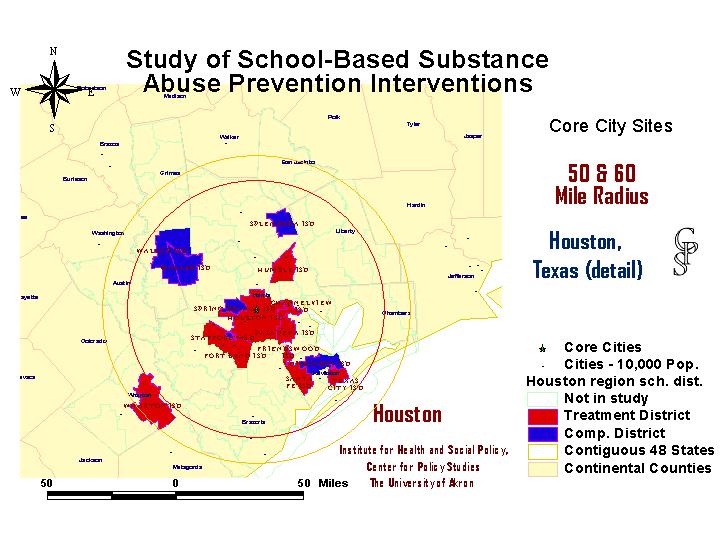
When a school district, the individual school personnel, and the local law enforcement organization all agree to participate in the study, they are randomly assigned to either the treatment or comparison group. This, of course, can be visually displayed on the map. The status of cluster school districts changes frequently as districts are randomly selected. They remain selected but uncommitted until they officially join or decline. If they join, they are assigned treatment or comparison status, and if they decline, they are replaced with another randomly selected district. Maps (and data tables) are produced periodically and on demand, in order to clarify district status issues.
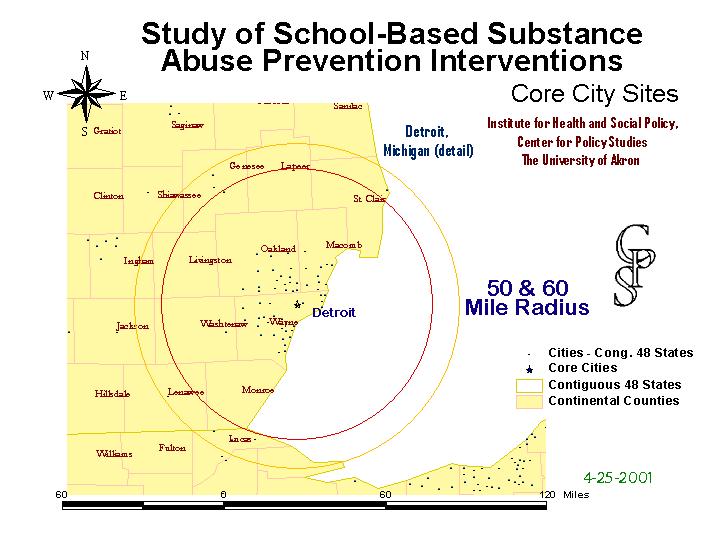
The Detroit cluster, of course, underwent the same process. Here it is with the concentric 50 and 60 mile rings from the city center.
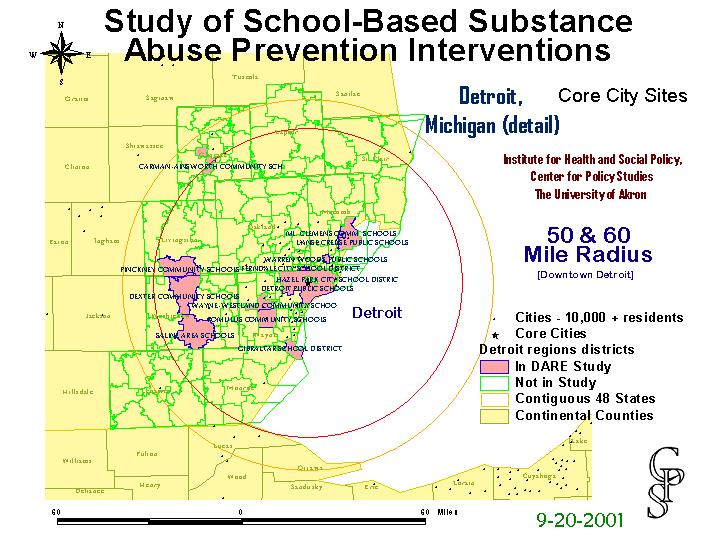
And here is Detroit with a collection of randomly selected outlying districts.
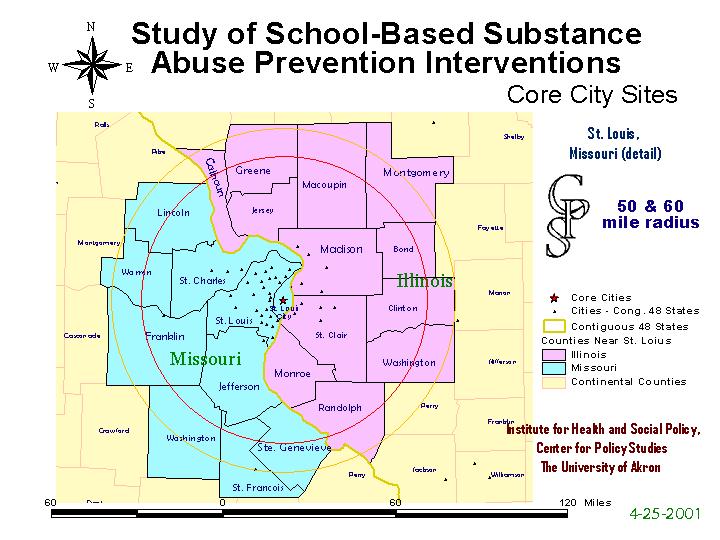
State boundaries did not complicate selection at all, as can be seen by the pre-selection map of the St. Louis cluster.
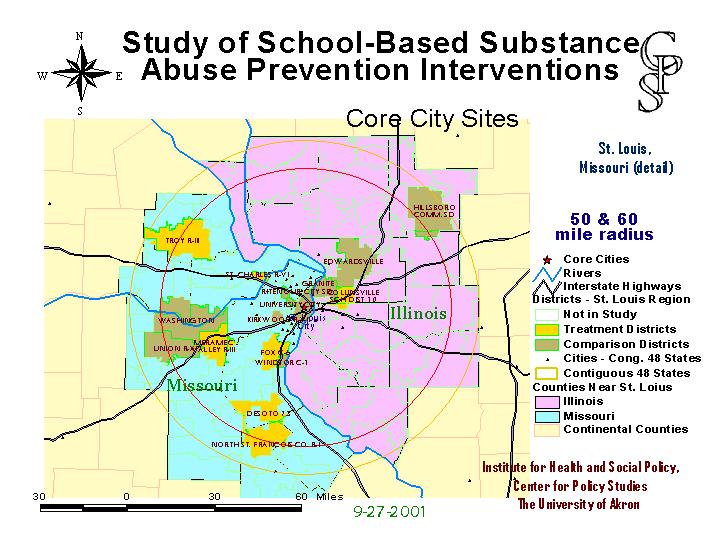
And here is the St. Louis cluster with a collection of randomly selected districts.
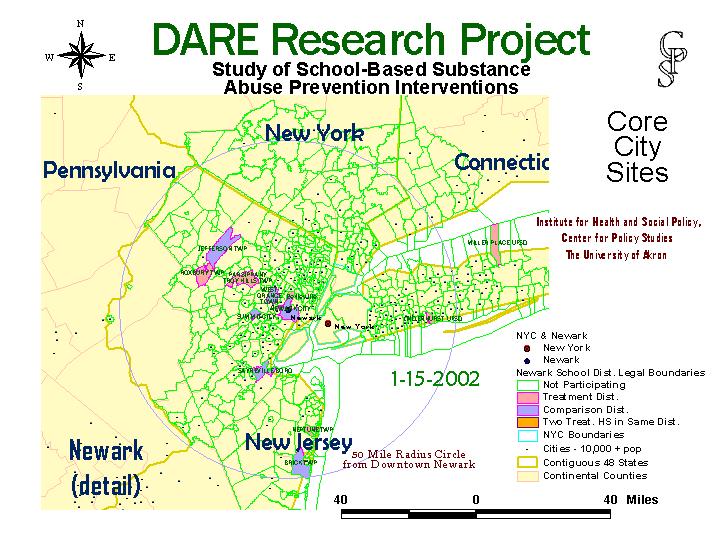
Selection of prospective districts was possible even across three state boundaries. Because of the difficulties caused by the September 11th attack, all parties agreed to switch the core district for this region to the Newark.
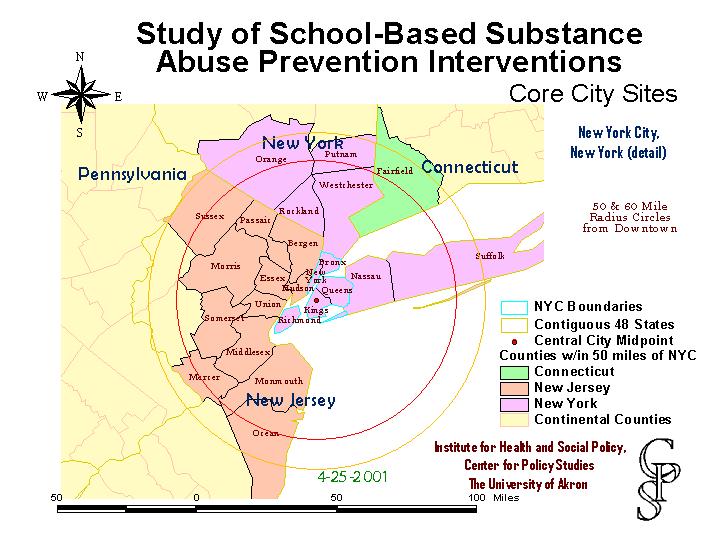
The 50 mile radius rings around New York and Newark city overlapped a great deal, and no districts that had already been selected and agreed to participate needed to be removed from the study ranks. GIS software assisted in cluster transfer a great deal.
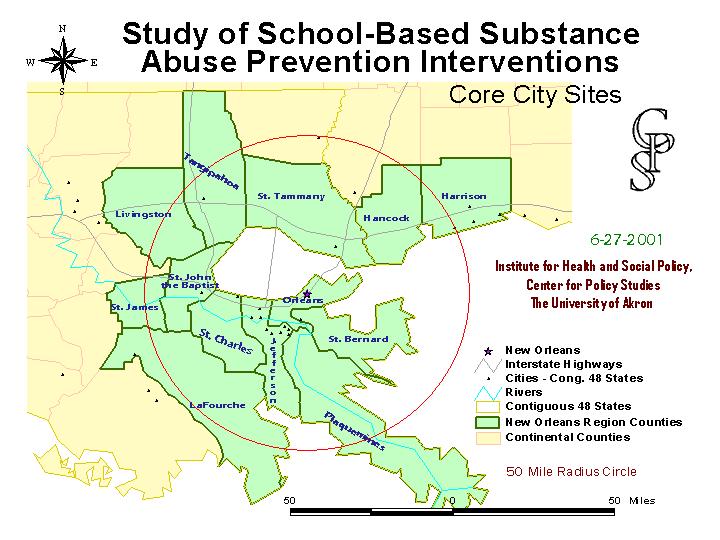
The other core cities are New Orleans....
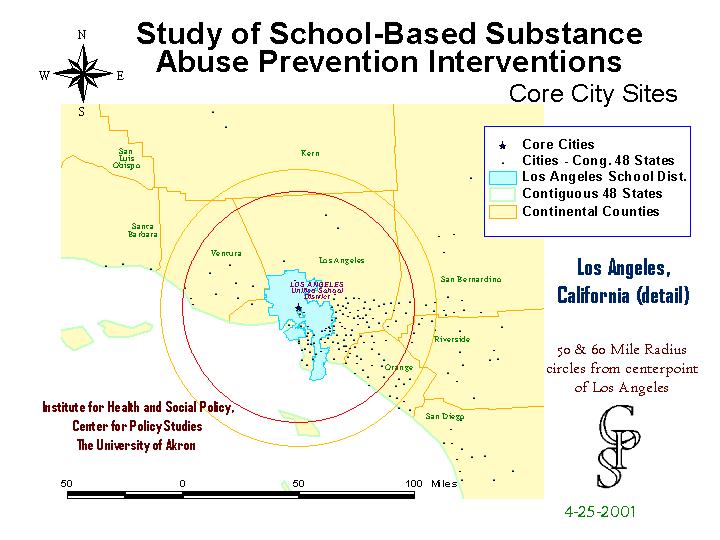
...and Los Angeles, the headquarters of DARE.
The project is currently being implemented in each of these regions, and an international variant is operating in Britain.
For information on the research project itself, contact Dr. Zili Sloboda, at The Institute for Health and Social Policy, 330-972-8675.
The author works for the project in a technical role. This presentation is solely meant to be on the technical aspects of sample selection and construction using GIS software. Any errors, distortions or problems with this report are unintentional, and completely the author's responsibility.
David Huskins, Manager of Data Services, Center for Policy Studies
Institute for Health and Social Policy
The University of Akron
225 South Main St. Polsky Bldg. Room 285 Akron, Ohio 44325-1911
Phone (330) 972-5111 Fax (330) 972-2501
URL: http://www3.uakron.edu/src/