GIS gives the young user immense choice in the cartographic representation of information, yet some maps are better than others. Effective maps are those in which the cartographic structure imposed on information matches the cognitive structures held by the map user. This research project in high schools identifies the nature of young people’s thinking about selected thematic maps and assesses the contribution of collaborative mapping tasks to its development. Key teacher intervention strategies are proposed.
This paper specifically examines young people’s understanding of choropleth maps. Choropleth (or ‘graduated colour’) maps are extremely common in conventional school atlases and the implicit assumption is that they are easily understood. Traditional atlases, however, usually present a single ‘public’ map for each mapped theme, created by professional cartographers and showing ‘knowns’ with low human-map interactivity (MacEachren, 1994). ArcView offers the possibility of discovering ‘unknowns’ through high interactivity, but also provides an opportunity to explore young people’s thinking about how such maps ‘work’. This can be done in a setting which has high ecological validity, i.e. that of collaborative working at a PC in geography classrooms.
The aim of this study is to identify the nature of young people’s mental representations of choropleth maps and to assess the function of collaborative work in making meaning from them.
The structuring mechanisms that organise sensory input and retrieve information from long term knowledge representations have been described as schemata. For Rumelhart and Norman (1985) schemata are ‘data structures for representing the generic concepts stored in memory’ (p.35). They can be both generalised and specific and may have two parts: a fixed part which contains characteristics that are usually true of exemplars and a variable part that deals with characteristics likely to be unique to individuals. Schemata are particularly useful in education in that they enable us to depict knowledge acquisition in a more organic way than a linear hierarchy of the sort advocated by Gagné (1965). In relation to maps, MacEachren (1995) proposes that individuals have both a general map schema and specific map schemata (such as those for thematic maps). The latter develop by modifying, expanding and filling in the details of the general schema. This happens in many ways including formal teaching and applying schemata from other domains. The implication is that whilst most map users have an intuitive grasp of the general map schema, specific map schemata have to be learned. There appear to be few descriptions of choropleth map schemata although several authors have explored the ‘bugs’ that may occur in understanding and reported on strategies that may promote learning. Much attention has been focused on issues related to classification (Cromley, 1996). Interactive tools have been shown to support learning. For example, Andrienko and Andrienko (1997) suggest the use of a ‘slider’ to categorise data dynamically and Egbert and Slocum (1992) developed an exploration system for choropleth maps that allows users to design a map and explore the underlying database.
Much student activity in British geography classrooms is collaborative and there has been increasing interest in the role of peers in scaffolding learning in small groups. The key theoretical construct is the zone of proximal development (ZPD). This cumbersome phrase refers to ‘the distance between a child’s actual development level as determined by independent problem solving and the higher level of potential development as determined through problem solving under adult guidance or in collaboration with more capable peers’ (Vygotsky, 1978, p87).
There is some evidence that collaborative problem solving does seem to improve individual performance. The ‘thinking load can be shared (Barnes and Todd, 1977) particularly if roles are made explicit (Brown and Palincsar, 1988) as well as the basis of decision making (Chi and Bassock, 1989). Dialogue with peers has been shown to enhance self monitoring and remembering (Crook, 1995).
Although the social role in learning is omitted from MacEachren’s account of the developmental basis for map schemata (1995, pp. 195-198) there has, in the last few years, been increasing interest in collaborative map learning (Leinhardt et al., 1998; Bausmith and Leinhardt, 1998). In many classroom contexts where GIS is used, students work together at a PC. How effective is this strategy? What do they talk about? What do they learn? How do they make meaning together from maps?
At the outset, it was decided that this investigation should be based on a ‘real’ classroom context, not an ‘experimental’ one. Discussions were held with several schools about upcoming curriculum coverage and the offer was made to construct a project in ArcView 3.2 that would support learning. In the British geography curriculum, Brazil is a popular topic and a school was identified that was teaching it at two age levels (14-15 years and 16-17 years). Both groups were studying regional disparities although the older group were doing so at a more advanced level. A project was constructed on variations in the quality of life in Brazil that would form an appropriate activity for both groups.
Data for each Brazilian state (in English translation) was downloaded from the Brazilian 1991 census site at:
http://www.ibge.net/english/estatistica/populacao/censodem/default.shtm
This data consisted of rural, urban and total population; illiteracy; higher education; number of people living in: homes without plumbing, homes without bathrooms, homes with direct garbage collection; and the average number of rooms per home.
Students worked in pairs. There were 19 pairs in the 14-15 age group and 8 pairs in the 16-17 age group. The project consisted of two stages. The first stage was a ‘training’ session in which they were shown an ArcView display of Brazilian states (see Figure 1) with a demonstration of how to create a dot map (see Figure 2) and a choropleth map (see Figure 3) of population data. The explanation included a description of how the legend editor worked and they noted the effect on the map display of changing the number of data classes, the basis of classification, rounding numbers and changing the colour scheme. They also learnt how to normalise population by area to make a map of population density. This training session lasted between 20 and 25 minutes.
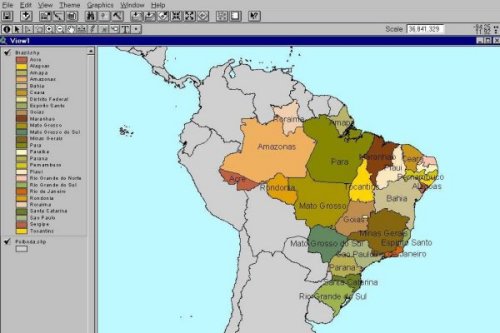
Figure 1. Base map of Brazil.
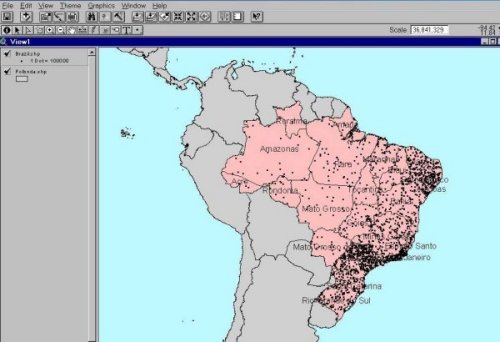
Figure 2. Dot map of population in Brazil.
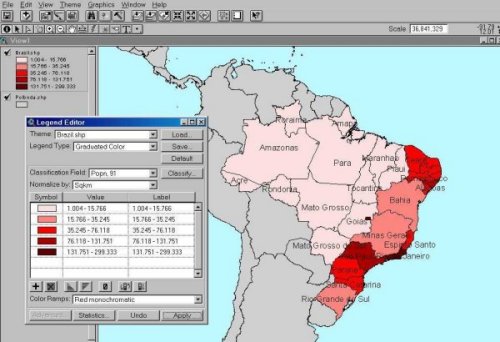
Figure 3. Choropleth map of population density in Brazil.
At their next geography lesson (two or three days later) students were briefly reminded of the software functionality, introduced to the ‘quality of life’ data sets and invited to ‘make some maps that show how the quality of life varies in Brazil’. All pairs made at least three maps (see for example Figures 4 and 5).
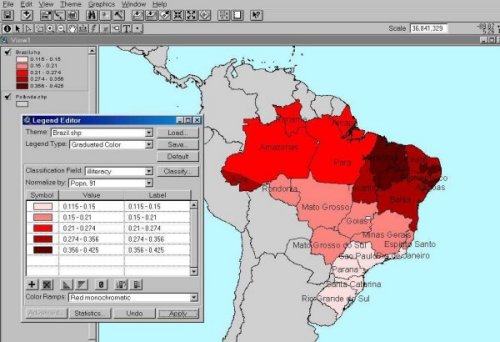
Figure 4. Illiteracy in Brazil.
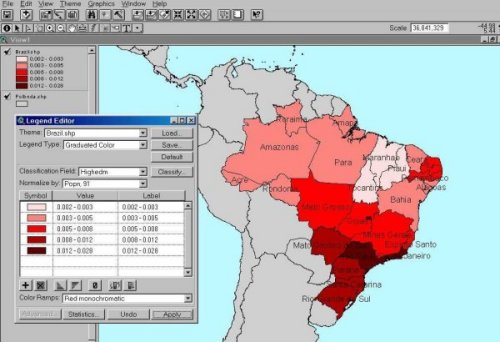
Figure 5. Participation in higher education in Brazil.
This stage took approximately 25 minutes. Students were videotaped whilst undertaking this task with the camera positioned on a cupboard behind them so as to view the monitor between participating pairs of students. A radio microphone was mounted on the top of the monitor. A transcript was made of their talk.
Analysis of the students’ talk was based on rhetorical structure theory. This has its roots in the analysis of textual material but several investigators have shown that similar argument structures are present in dialogue (Grosz, 1978; Reichmann, 1985; Guindon et al., 1986). The structure and hierarchy of ideas is represented through the identification of ‘rhetorical predicates’, which can be used to track the ideational content or structure of argument as it develops from one discourse participant to another. Such predicates include cause, consequence, condition, purpose, etc. which are used to develop argument by linking together factual propositions. Pilkington’s DISCOUNT scheme (1999) synthesises and extends these approaches. It aims to track the initiative taken by participants in exchanges and to identify patterns of exchange, enabling shifts in dialogue role to be investigated as well as the effectiveness of the dialogue in terms of learning functions. The effectiveness of particular styles of interaction can be examined through the tracking of discourse cues to specific rhetorical relations. Student talk was coded using a customised simplification of Pilkington’s (1999) scheme.
Conversational ‘turns’ were broken down into ‘moves’ (‘speech acts or tactics that serve a dialogue goal’; Pilkington, op. cit., p. 18) and each move was categorised on two dimensions: its discourse function and its ideational content. Each functional move category was qualified by a subcategory that represented elements of choropleth map schemata. What follows is a classification scheme still under development.
Using ‘inform’ moves, the student makes observations and statements about the map. ‘Direct’ moves are predicated by action. They are generally instructions for one or both students to carry out a task (for example: ‘let’s do higher education now’). ‘Reason’ moves are declarative statements which identify instances of reasoning learning activity. They include beliefs constructed as a result of the mapping task (for example: ‘as you choose more classes, it shows you more difference between the areas’). ‘Question’ moves invite a response which provides an explanation (for example: ‘do you think there’ll be more illiteracy there or less?’). ‘Other’ moves’ include opening gambits (‘Shall we start?’), closure statements (‘Right, that’s it’) and role allocation (‘Do you want to do the next bit?’).
Each move is subdivided by a focus. These qualify the moves by drawing attention to the cartographic strategies and geographical ideas employed in constructing and deriving information from a choropleth map. Two, overlapping sets of focus subdivisions were identified, derived from the data.
Field (the classification field indicating quality of life variables)
Normalise (typically by total population)
Type (Classification type, e.g. natural breaks or equal interval)
Number (of classes selected)
Round (the pattern of rounding values)
Colour (choice of colour ramp)
Pattern (identification of characteristics of the spatial distribution of a variable)
Co-relationship (identification of relationship between one variable and another)
Consequence (identification of geographical outcome)
Prediction (hypothesising about a distribution not yet mapped)
The map evidence was based on a total of 84 choropleth maps (60 by the younger students, 24 by the older). All pairs produced three maps and two pairs produced four.
The variables were both ‘negative’ and ‘positive’. A high level of illiteracy for example may indicate a lower quality of life whereas a high level of participation in higher education may indicate a higher quality of life. Many students found the mirror image effect on the map (darker colours could represent a better or worse quality of life as exemplified in Figures 4 and 5) confusing although most resolved the map's meaning on brief reflection. Students frequently exaggerated variables when referring to them. This is probably a shorthand way of dealing with a high information load (simplifying saves processing space) but may lead to confusion. Examples are: ‘This is where they can’t read or write’ to describe areas with high illiteracy rates or ‘they have no bathrooms’ in regions where access to piped running water is less than average. There was some evidence of students misunderstanding the shorthand labels given to the variables. ‘Binmen’, for example, was the label attached to the number of people who live in homes from which the garbage is collected directly on a regular basis. One student thought it referred to shanty towns. In the ArcView project used for this study, the scale of the map was frequently not recognised. Students referred to ‘there, near the coast’ for places that were perhaps 500km from the coastline. In the UK terms such as ‘legend’ and ‘normalise’ are unfamiliar. Teachers and students refer instead to a map’s ‘key’ and use the phrase ‘as a proportion of’. Yet these language differences posed no apparent problems in the students’ use of ArcView (the concept may have been problematic but not the label and the use of the term 'normalise' may even have helped understanding).
Few instances of experimenting with colour ramps were recorded. It was anticipated that this simple device would have diverted much student attention. Most groups were content to return to the default after trying a single alternative colour. On the few occasions when dichromatic scales tried, their inappropriateness seemed immediately apparent to participants.
The mean number of data classes selected was 5.7 for younger participants and 6.2 for the older (respective medians were both 5). Only four maps were made with more than 8 classes (the maximum number thought by Jenks (1963) to be distinguishable for ‘average map readers’).
Discourse evidence was based on a total of 843 dialogue moves. Table 1 shows that the largest categories of move are 'inform' and 'reason'. In making their maps, there was much talk between student pairs about what was displayed and why it was like that. Older students exhibited more 'reason' statements and also asked more questions. There were relatively few ‘direct’ moves. Much of the manipulation of ArcView was implicit with little need for 'direct' instructions from one student to another. The small number of ‘other’ moves indicates a high proportion of time on task.
Table 1. Percentage dialogue moves by age group
|
age 13-14 years |
age 16-17 years |
|
|
Inform |
35.8 |
23.1 |
|
Direct |
14.1 |
13.4 |
|
Reason |
30.1 |
36.6 |
|
Question |
12.8 |
18.3 |
|
Other |
6.4 |
8.5 |
Table 2 shows the amount of dialogue devoted to map making strategies with ArcView. About two-thirds of the discourse between students of both age groups was devoted to strategy. Most talk focused on the selection of variables that would indicate regional disparities in the quality of life as well as the number of classes that should be chosen in the cartographic representation. Note how little talk focused on the finer grained detail of map making such as the type of classification and rounding of values. Most students were content to stay with the default settings. These aspects of map making were taken up more by older students who also spent longer discussing normalising variables.
Table 2. Percentage cartographical focus of dialogue moves
|
age 13-14 years |
age 16-17 years |
|
|
Field |
32.0 |
19.2 |
|
Normalise |
6.8 |
11.0 |
|
Type |
3.9 |
6.4 |
|
Number |
21.4 |
18.3 |
|
Round |
2.9 |
6.4 |
|
Colour |
6.8 |
6.4 |
|
Other |
35.9 |
32.0 |
Table 3 shows that approximately 50-60% of discourse was devoted to the geography behind the maps. ‘Consequence’ statements were largely limited to ‘people migrate from the north-east to the south-east’. Younger students moved more slowly to this conclusion and thus used a larger number of dialogue moves in reaching it. Older students made far more predictions about patterns they had yet to map.
Table 3. Percentage geographical focus of dialogue moves
|
age 13-14 years |
age 16-17 years |
|
|
Pattern |
19.8 |
14.6 |
|
Co-relationship |
14.3 |
18.6 |
|
Consequence |
12.2 |
6.4 |
|
Prediction |
6.2 |
19.8 |
|
Other |
47.4 |
40.5 |
There were differences in performance on this task between the younger and older students. Older students engaged in higher order discourse. They asked more questions and reasoned more. They made fewer descriptive moves (such as ‘inform’ and ‘pattern’) and made more explanatory and analytical moves (such as ‘co-relationship’ and ‘prediction’). They engaged in more talk about the detail of mapping strategy.
Some ‘bugs in learning’ were identified. Students often struggled to explain the principle of normalising to themselves and others. Concepts of ratio and proportionality are not well established even in the middle years of secondary schooling and teachers may find it helpful to make sure adequate time is spent rehearsing these concepts when introducing the legend editor functions. It would also be beneficial to make clear the precise meaning of the variables and that much data has ‘directionality’ (i.e. 'more' can mean better or worse).
On the other hand, very few technical difficulties were identified. After a single training session most students were able to devote a high proportion of their time to making maps rather than making the software work. A high proportion of interaction was also spent talking about the geography rather than how to make the map. There was a high level of spontaneous prediction about spatial relationships. These findings are most encouraging for the use of ArcView GIS in schools.
This paper was written whilst the author held a Leverhulme Research Fellowship in GIS in Education.
Andrienko and Andrienko (1997) Gagné, R.M. (1965) The Conditions of Learning. New York: Holt, Rinehart, Winston.
Barnes, D. and Todd, F. (1977) Communication and Learning in Small Groups. London: Routledge and Kegan Paul.
Bausmith, J.M. and Leinhardt, G. (1998) Middle school students’ map construction: understanding complex spatial displays, Journal of Geography, 97, pp.93-107.
Brown, A.L. and Palincsar, A.S. (1989) Guided, co-operative learning and individual knowledge acquisition. In L. B. Resnick (Ed.), Knowing, Learning and Instruction. Hillsdale, NJ: Lawrence Erlbaum Associates.
Chi, M.T.H. and Bassock, M. (1989) Learning from examples via self explanations. In L. B. Resnick (Ed.), Knowing, Learning and Instruction. Hillsdale, NJ: Lawrence Erlbaum Associates.
Cromley, R.G. (1996) A comparison of optimal classification strategies for choroplethic displays of spatially aggregated data, International Journal of Geographical Information Systems, 10 (4) 405-424.
Crook, C. (1994) Computers and the Collaborative Experience of Learning. London: Routledge.
Egbert, S.L. and Slocum, T.A. (1992) EXPLOREMAP: An exploration system for choropleth maps, Annals of the Association of American Geographers, 82, 275-288.
Grosz, B. (1978) Discourse. In D.E.Walker (Ed.) Understanding Spoken Language. Amsterdam: North Holland.
Guindon, R., Sladkey, P., Brunner, H. and Conner, J. (1986) The structure of user-advisor dialogues: Is there method in their madness? In Proceedings of the 24th Annual Meeting of the Association for Computational Linguistics. ACL.
Jenks, G.F. (1963) Generalization in statistical mapping, Annals of the Association of American Geographers, 53, 15-26.
Leinhardt, G., Stainton, C. and Bausmith, J.M. (1998) Constructing maps collaboratively, Journal of Geography, 97, pp.19-30.
MacEachren, A. M. (1994) Visualisation in modern cartography: setting the agenda. In A.M. MacEachren and D.R.F. Taylor (eds.) Visualisation in modern cartography. Oxford: Elsevier.
MacEachren, A.M. (1995) How Maps Work. New York: Guilford Press.
Pilkington, R. M. (1999) Analysing Educational Discourse: The DISCOUNT Scheme. Technical Report No. 99/2. Leeds: University of Leeds Computer Based Learning Unit.
Reichmann, R. (1985) Getting Computers to Talk Like You and Me. Cambridge, MA: MIT Press.
Rumelhart, D.E. and Norman, D.A. (1985) Representation of Knowledge. In A.M. Aitkenhead and J.M. Slack (Eds.) Issues in Cognitive Modeling, London: Erlbaum.
Vygotsky, L. (1978) Mind in Society. Cambridge, MA: Harvard University Press.