Lubos Matejicek
The radionuclides in the sediments of the Irish Sea have been released into the north east Irish Sea from the nuclear facilities sited at Sellafield, in Cumbria. This paper describes a model for predicting the distribution of the radionuclides 239,240Pu over several decades, within the GIS environment. A series of studies of radionuclide deposition has been carried out by the Ministry of Agriculture, Fisheries and Food's (MAFF) Directorate of Fisheries Research (DFR) at Lowestoft.
The aim of this paper is to describe a desktop GIS using ArcView and its language AVENUE for modelling radionuclide deposition. This desktop GIS creates charts of the Irish Sea linked with information on radionuclide distribution, both horizontally and vertically. This desktop GIS is also dynamic; the information linked to charts can be updated and charts will automatically reflect those changes. The time series of activities in various parts of Irish Sea can be then analysed and visualised.
The Irish Sea is a semi-closed body of water with a total volume 2430 cubic kilometres. St George's Channel and the North Channel are the only entrances to the Irish Sea from the Atlantic Ocean. The tides propagate through both these channels and are able to create a vertically homogeneous water column in most areas. The main types of sediments are gravelly sediments extended through the central part of the Irish Sea, sandy sediments on both sides of the central part and two mud patches. The basic description of the physical oceanography and geological structure of the Irish Sea is in Kershaw et al. (1994).
The nuclides are discharged from Sellafield into the Irish Sea's 'regions' where they become associated with particulate material. The plutonium isotopes monitored in the Irish Sea were 238Pu (half-life 88 years), 239Pu (24,000 years) and 240Pu (6,500 years). This paper describes the modelling of the deposition of 239Pu and 240Pu. By 1990, the discharge had generated environmental inventories of about 680 TBq of 239,240Pu (MacKenzie at al., 1994). It is expected that only a small fraction of the plutonium discharged from Sellafield leaves the Irish Sea area (approximately 7 %) and that sediments are mixed biologically (Kershaw et al., 1994).
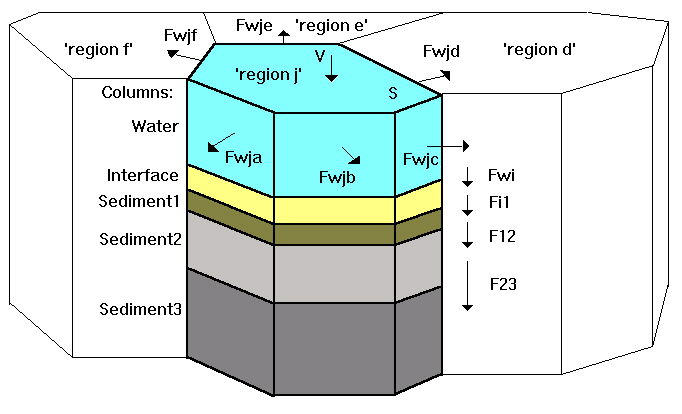
A number of mathematical models have been designed to predict the radionuclide distribution in the Irish Sea (Kershaw at al., 1992). The dynamic model in this paper is described using first order ordinary differential equations. The structure of the model consists of 41 'regions'; a 'region' is defined by its bed material - mud, gravel, etc. Each 'region' is divided vertically into five stacks. The described structure was used in the MIRMAID model (MAFF Irish Sea Modelling Aid), which was developed to predict doses to man from seafood consumption (Fig. 1); a detailed description is in a series of papers (Kershaw at al., 1992).
The dynamic model in ArcView has been developed to predict the quantity of the artificial radionuclides 239,240Pu. Any decrease in the amount of 239,240Pu in the stack depends on the radioactive decay law and the radionuclides "rate in" and "rate out":
dX(t)/dt = -k X(t) - Rate out + Rate in
where 'k' is a positive constant of proportionality independent
of time 't' and 'X'. The description of the model in ArcView for
the 'region' with its vertical stacks is:
dXw/dt = -k Xw - Fwi(Xw, Xi) + Fw(Xw, Xw1,..., Xwn, S1...Sn,) + V,
dXi/dt = -k Xi - Fi1(Xi, X1) + Fwi(Xw, Xi),
dX1/dt = -k X1 - F12(X1, X2) + Fi1(Xi, X1),
dX2/dt = -k X2 - F23(X2, X3) + F12(X1, X2),
dX3/dt = -k X3 + F23(X2, X3),
Xw(0) = Xw0,
Xi(0) = Xi0,
X1(0) = X10,
X2(0) = X20,
X3(0) = X30,
Yw = Xw/S,
Yi = Xi/S,
Y1 = X1/S,
Y2 = X2/S,
Y3 = X3/S,
where Xw, Xi, X1, X2, X3 are the amounts of radionuclide in the stacks of the 'region', Fw is a function of interaction with neighbour 'regions', Fwi, Fi1, F12, F23 are vertical functions of interaction between stacks of the 'region', V is the external input, Xw0, Xi0, X10, X20, X30 are initial amounts, Yw, Yi, Y1, Y2, Y3 are the amounts of 239,240Pu per area unit, S is the size of the 'region'.
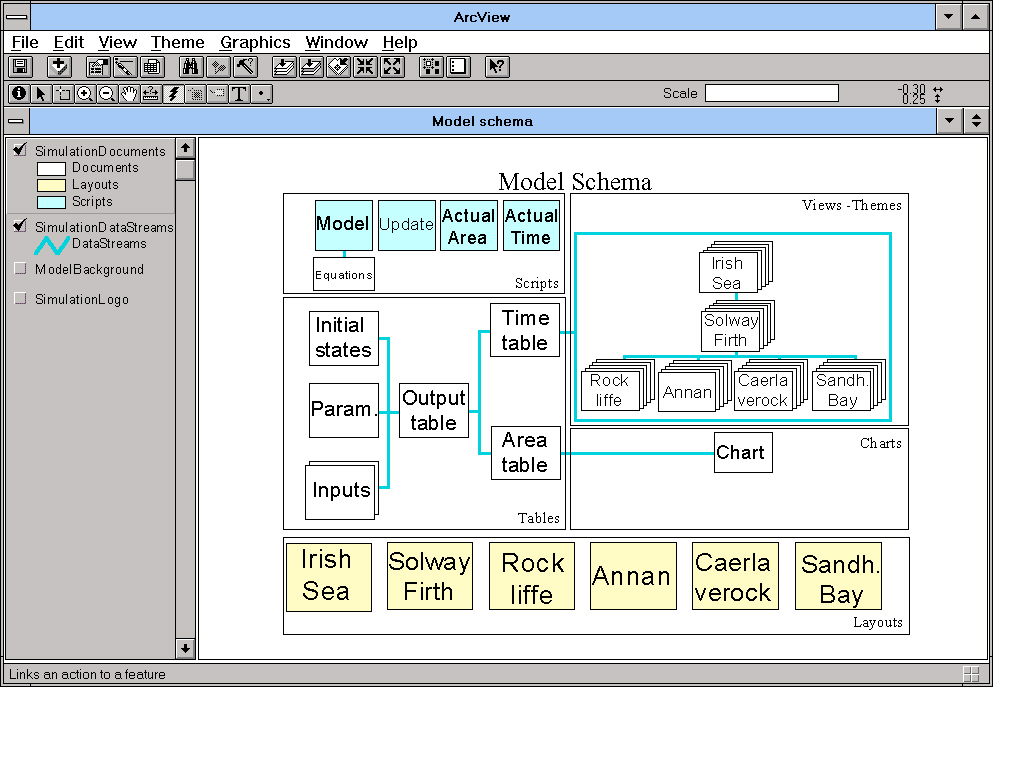
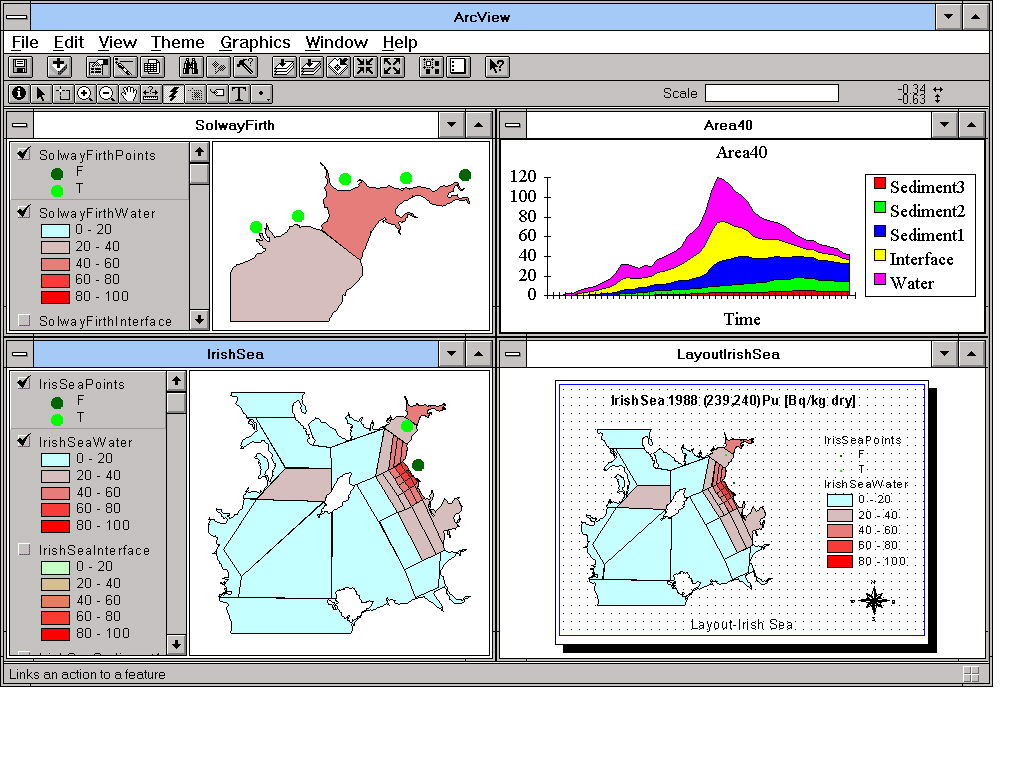
The PROJECT (ArcView project) utilises a VIEW (ArcView view) of the Irish Sea, a VIEW of the Solway Firth, which is located on the east part of the Irish Sea, and the VIEWs of a few areas on the coast of the Solway Firth (Fig. 2). Each VIEW includes five THEMEs (ArcView theme) with a coloured symbolisation showing radionuclide deposition in the vertical stacks. The THEME's attribute table is joined with the TIME TABLE (ArcView table) generated by the model calculation. The TIME TABLE contains the amounts of radionuclide deposition in the stacks at the time specified. The amounts of 239,240Pu during the whole simulation period are plotted on a CHART (ArcView chart). The CHART references tabular data in the AREA TABLE (ArcView table), in which are stored amounts of radionuclide deposition in the vertical stacks in the specified 'region'. The data sources for both TIME and AREA TABLES are selected from the OUTPUT TABLE (ArcView table). The OUTPUT TABLE contains time series data of 239,240Pu quantities for all 'regions' in the Irish Sea. This table is the output of the model calculation. The input tables for the model are the initial states of 239,240Pu in the forty-one Irish Sea 'regions', parameters of the differential equations, and time series of external inputs of 239,240Pu. The output presentations are on the LAYOUTs (ArcView layout): Irish Sea, Solway Firth, Rockliffe, Annan, Caerlaverock, Sandyhills Bay. They contain VIEWs and CHARTs of the ArcView graphic environment. Producing the SCRIPTs (ArcView script) represents the main effort of this project. The SCRIPTs contains AVENUE code and automate the simulation task and selection task from the OUTPUT TABLE.
The basic structure of the SCRIPT for simulation contains user input, initialisation of variables and calculation with the data output (Fig. 3).
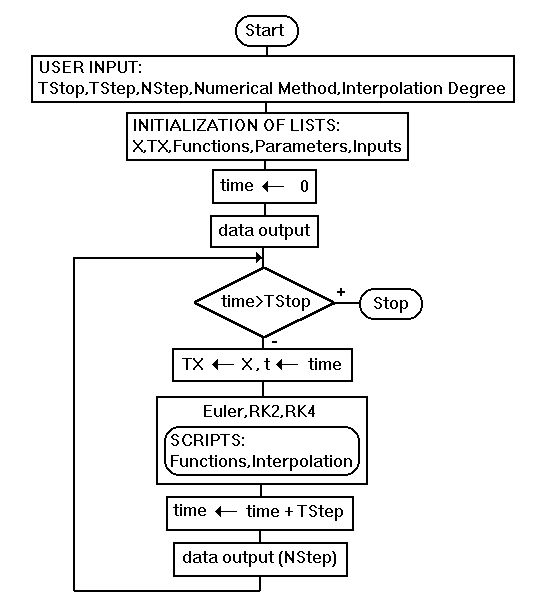
A dialogue box is used to set: the whole simulation period (TStop); the time step of the numerical algorithm (TStep); the sampling interval (NStep) used to select simulations from the total number of simulation steps for logging to the OUTPUT TABLE; the choice of integration algorithm (Euler, Runge-Kutta fixed step second order RK2 and Runge- Kutta fixed step fourth order RK4); and, the degree of Lagrangian interpolation polynomial for table inputs. Runge-Kutta fixed step, fixed order methods are most often applied to integration. The first order (Euler) method is least accurate but uses less computer time. The second and fourth order methods are more accurate. The next step is the initialisation of lists of: the state variables (X); temporary state variables (TX); variables and parameters of functions on the right side of differential equations; and, external input time series. After initialising variables and time the SCRIPT writes out the values of all state variables to the OUTPUT TABLE. After data output the stop flag is tested. If the time value is less then TStop the states and time variables are transferred to the temporary variables and the integration routine integrates over the time interval TStep using the chosen numerical algorithm. The SCRIPT Function contains the right side of differential equations. The interpolation algorithm is in the Interpolation SCRIPT. After integration the time is incremented by TStep and the values of all state variables are written each Nth step (NStep) out to the output table. Then the program loops and again the Stop flag is tested.
The SCRIPTs Actual Time and Actual Area are used for data selection from the OUTPUT TABLE. They transfer values to the TIME TABLE and to the AREA TABLE. The dialogue box of the SCRIPT Actual Time contains the actual time selection. The dialogue box of the SCRIPT Actual Area contains the 'region' number selection. The SCRIPT Update supports update of data structure of the layouts.
Simulation of the radionuclide deposition has been tested in ArcView version 2.1 in the Windows 3.11 environment on a PC with a Pentium processor. The reference simulation system used has been ACSL (Advanced Continuous Simulation Language) version 10.1 in the Windows 3.11 environment on the same computer. ACSL supports modelling systems described by time-dependent, non-linear differential equations. The outputs can be also exported to other systems - but, especially in this ArcView modelling, to the OUTPUT TABLE. The simulation in the ACSL environment used less computer time. Also at this stage ACSL contains more integration algorithms (Adams-Moulton, Gear's Stiff, Euler, Runge-Kutta, Runge-Kutta-Fehlberg) with the fixed or variable step and order. ArcView with the AVENUE language offers more complex support for the purpose of spatio-temporal radionuclide modelling. The user interface was also improved with ArcView's hot link feature. The VIEW of the model schema has the feature linked with other VIEWs, TABLEs, CHARTs, LAYOUTs and SCRIPTs (Fig. 2). The user can access documents or run the SCRIPTs by clicking on a feature in the model schema (Fig. 4).
 The structure of the ArcView's project for the modelling of radionuclide
deposition can be also used for similar environmental systems.
The spatial data are in views and embedded tables. The dynamic
scale of the models is described by equations in Function SCRIPT
and in tables.
The structure of the ArcView's project for the modelling of radionuclide
deposition can be also used for similar environmental systems.
The spatial data are in views and embedded tables. The dynamic
scale of the models is described by equations in Function SCRIPT
and in tables.
Kershaw,P.J., Pentreath,R.J., Woodhead,D.S., Hunt,G.J. (1992): A review of radioactivity in the Irish Sea. Aquatic Environment Monitoring Report No. 32, Ministry of Agriculture, Fisheries and Food, Lowestoft, 65 pp.
MacKenzie,A.B., Scott,R.D, Allan,R.L., Shaban,Y.A.B, Cook,G.T., Pulford,I.D. (1994): Sediment Radionuclide Profiles:Implications for Mechanisms of Sellafield Waste Dispersal in the Irish Sea. Journal of Environmental Radioactivity 23, 39-69.
McCartney,M., Kershaw,P.J., Woodhead,D.S., Denoon,D.C. (1994): Artifical radionuclides in the surface sediments of the Irish Sea, 1968-1988. The Science of the Total Environment 141, 103-138.
This research was sponsored by the Royal Society of London in the frame of the Czech Postdoctoral Fellowship Programme, but is a part of a larger study involving various members of Glasgow University's Department of Geography and Topographic Science and the Scottish Universities Research and Reactor Centre.
Lubos Matejicek
Research Fellow, Department of Geography & Topographic Science
University of Glasgow
Glasgow G12 8QQ
Scotland, UK
Telephone: +44(0)141-330 4782
Fax: +44(0)141-330 4894
email: lmatejicek@geog.gla.ac.uk