GIS at the Danish Defence Research Establishment
By
Lisbeth M. Rasmussen
Danish Defence Research Establishment
Computer Science Department
Human Computer Interaction Section

Name: Lisbeth Merete Rasmussen
Position: M.Sc., Head of Human Computer Interaction Section
Company: Danish Defence Research Establishment
Address: Rygvangs Allé 1
Post-box: 2715
Zip Code/City: 2100 Copenhagen OE
Telephone: (+) 45 39 15 18 05
Fax: (+) 45 39 29 15 33
Email: lr@ddre.dk
Job Experience: 1984- Danish Defence Research Establishment
1987-1994 Acting Head of the Information Processing Section
1995- Head of Human Computer Interaction Section
Work Experience:
Geographical Information Systems as main area of work since 1993.
Have used Intergraph�s MGE with extensions and Mapinfo. Is knowledgeable of Esri�s
ArcInfo, and ArcView, and of GRASS. Have just finisher a report (book) on Introduction to
Geographical Information Systems (in Danish).
Digital maps since 1989.
Man-machine Interaction (including virtual reality) since 1995.
Object-oriented databases since 1991.
Abstract
This article gives a short introduction to the why, what, how GIS at the Danish Defence Research Establishment (DDRE) is used. It describes why DDRE is interested in GIS, and what been done and what is planned to satisfy the Danish defence. It also describes some of the projects DDRE are involved in.
Introduction
The Danish Defence Research Establishment (DDRE) is both doing research and project for the defence. One of the interest areas for the Human Computer Interaction Section (HCI-section) is Geographical Information System (GIS). The background for the interest is described in the chapter 2. The goal is described in chapter 3 below, and the strategy used to obtain this goal in chapter 4. Chapter 5 is about the ongoing and future activities in research and development associated with GIS.
Military operations have always required knowledge about the geography. They take place in time and space and require knowledge about the terrain. Therefore the military has always been large-scale consumer of maps. When GIS made it possible to handle maps more effectively, and update and store digital maps more easily, GIS became an effective tool for the military. Today when GIS is moving beyond two dimensions, it has become even more essential to the military. Today most GIS are still just toolboxes, that makes it possible to store, display, and analyse geographical information. They often require extensive education to run, the analysis requires effective digital representation of the terrain, and they should be able to work together with other systems including other GIS. This gives the following interesting topics/reasons for the interest:
The goals are:
How are the goals then reached? First of all DDRE has build a GIS-laboratory with the necessary hardware, software and data. The contents and some of the possibilities in the laboratory are described in section 5.1. Second, at least one person is familiar with each system. Last DDRE will take part in research projects, which could also include universities, and the National Survey and Cadastre-Denmark.
Function
The function of the GIS-laboratory is as follows:
Hardware
The following hardware is available in the GIS-laboratory:
Software
The following GIS are available in the GIS-laboratory:
Available geographical information
The following important digital maps are available in the GIS-laboratory:
GIS interoperability
The DDRE is looking into the interoperability of GIS with other systems such as Command and Control, other decision support systems, and other GIS.
Digital maps
DDRE will follow the development of standards for digital maps and the Open Geodata Interoperability Specification (OGIS). DDRE will also examine the possibility of intelligent quick updating of maps. DDRE has the library facility of the digital map products, which the Danish defence have a few examples of. DDRE also produces DLMS data for Danish territory, and distribute the European data to the Danish defence.
VR&GIS
The use of geographical information in Virtual Reality (VR) systems will be examined and a test bed made. The possibility of connecting VR and GIS will be examined. This will improve the possibility of effective computer aided exercises.
Visualisation of geographical information
The DDRE will examine and try to solve the problems involved in visualising large geographical data sets. These include problems visualising the data on a paper map on a screen, and problems visualising data in more then two dimensions (3D and time).
Brugervenlighed
Terrain analysis
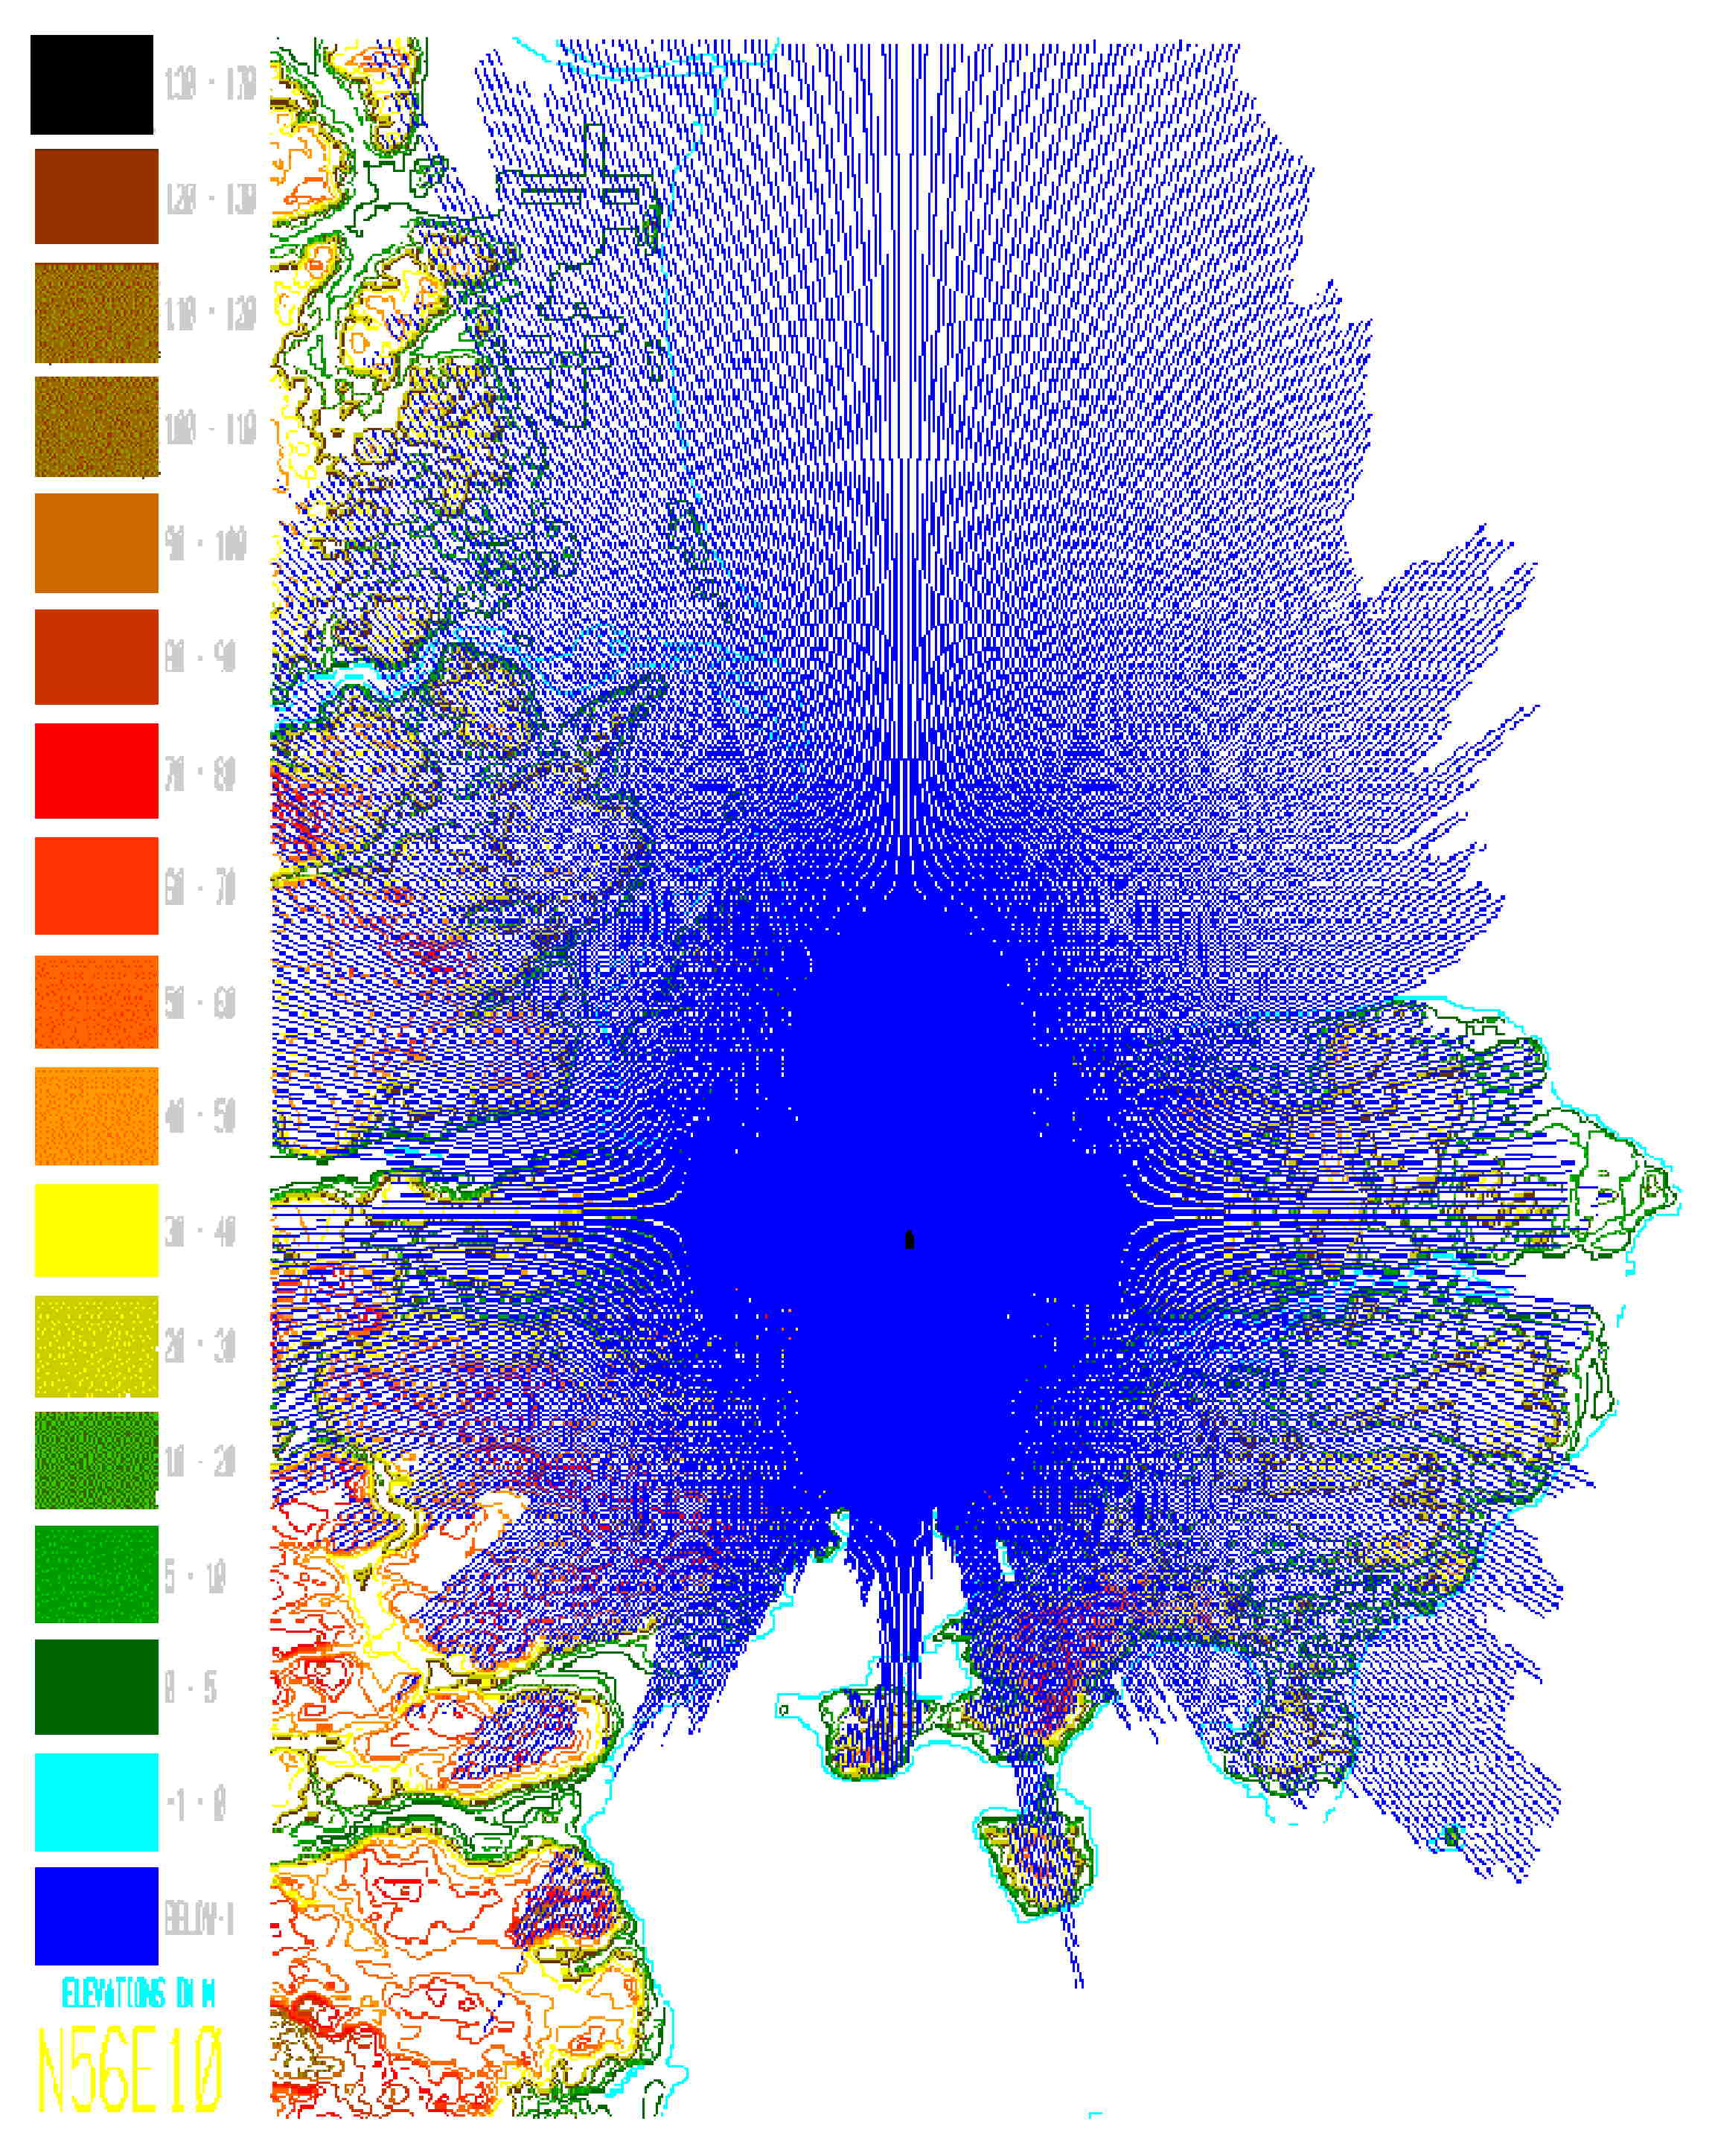
Terrain analysis is one of the most important military analyses a GIS can provide. A complex model of the terrain can be generated, that can be used as a tactical decision aid. It is for example possible to do intervisibility calculations and mission planning, e.g. how and where to move troops. The figures below show some of the uses of terrain analysis.
Figure 1 Line of sight results.
The visible areas for a target in a specific height over ground level from a given position and height is depicted in a blue fan on top of a contour map of the eastern part of Jutland (generated using Intergraph�s MGE Terrain Analyst).
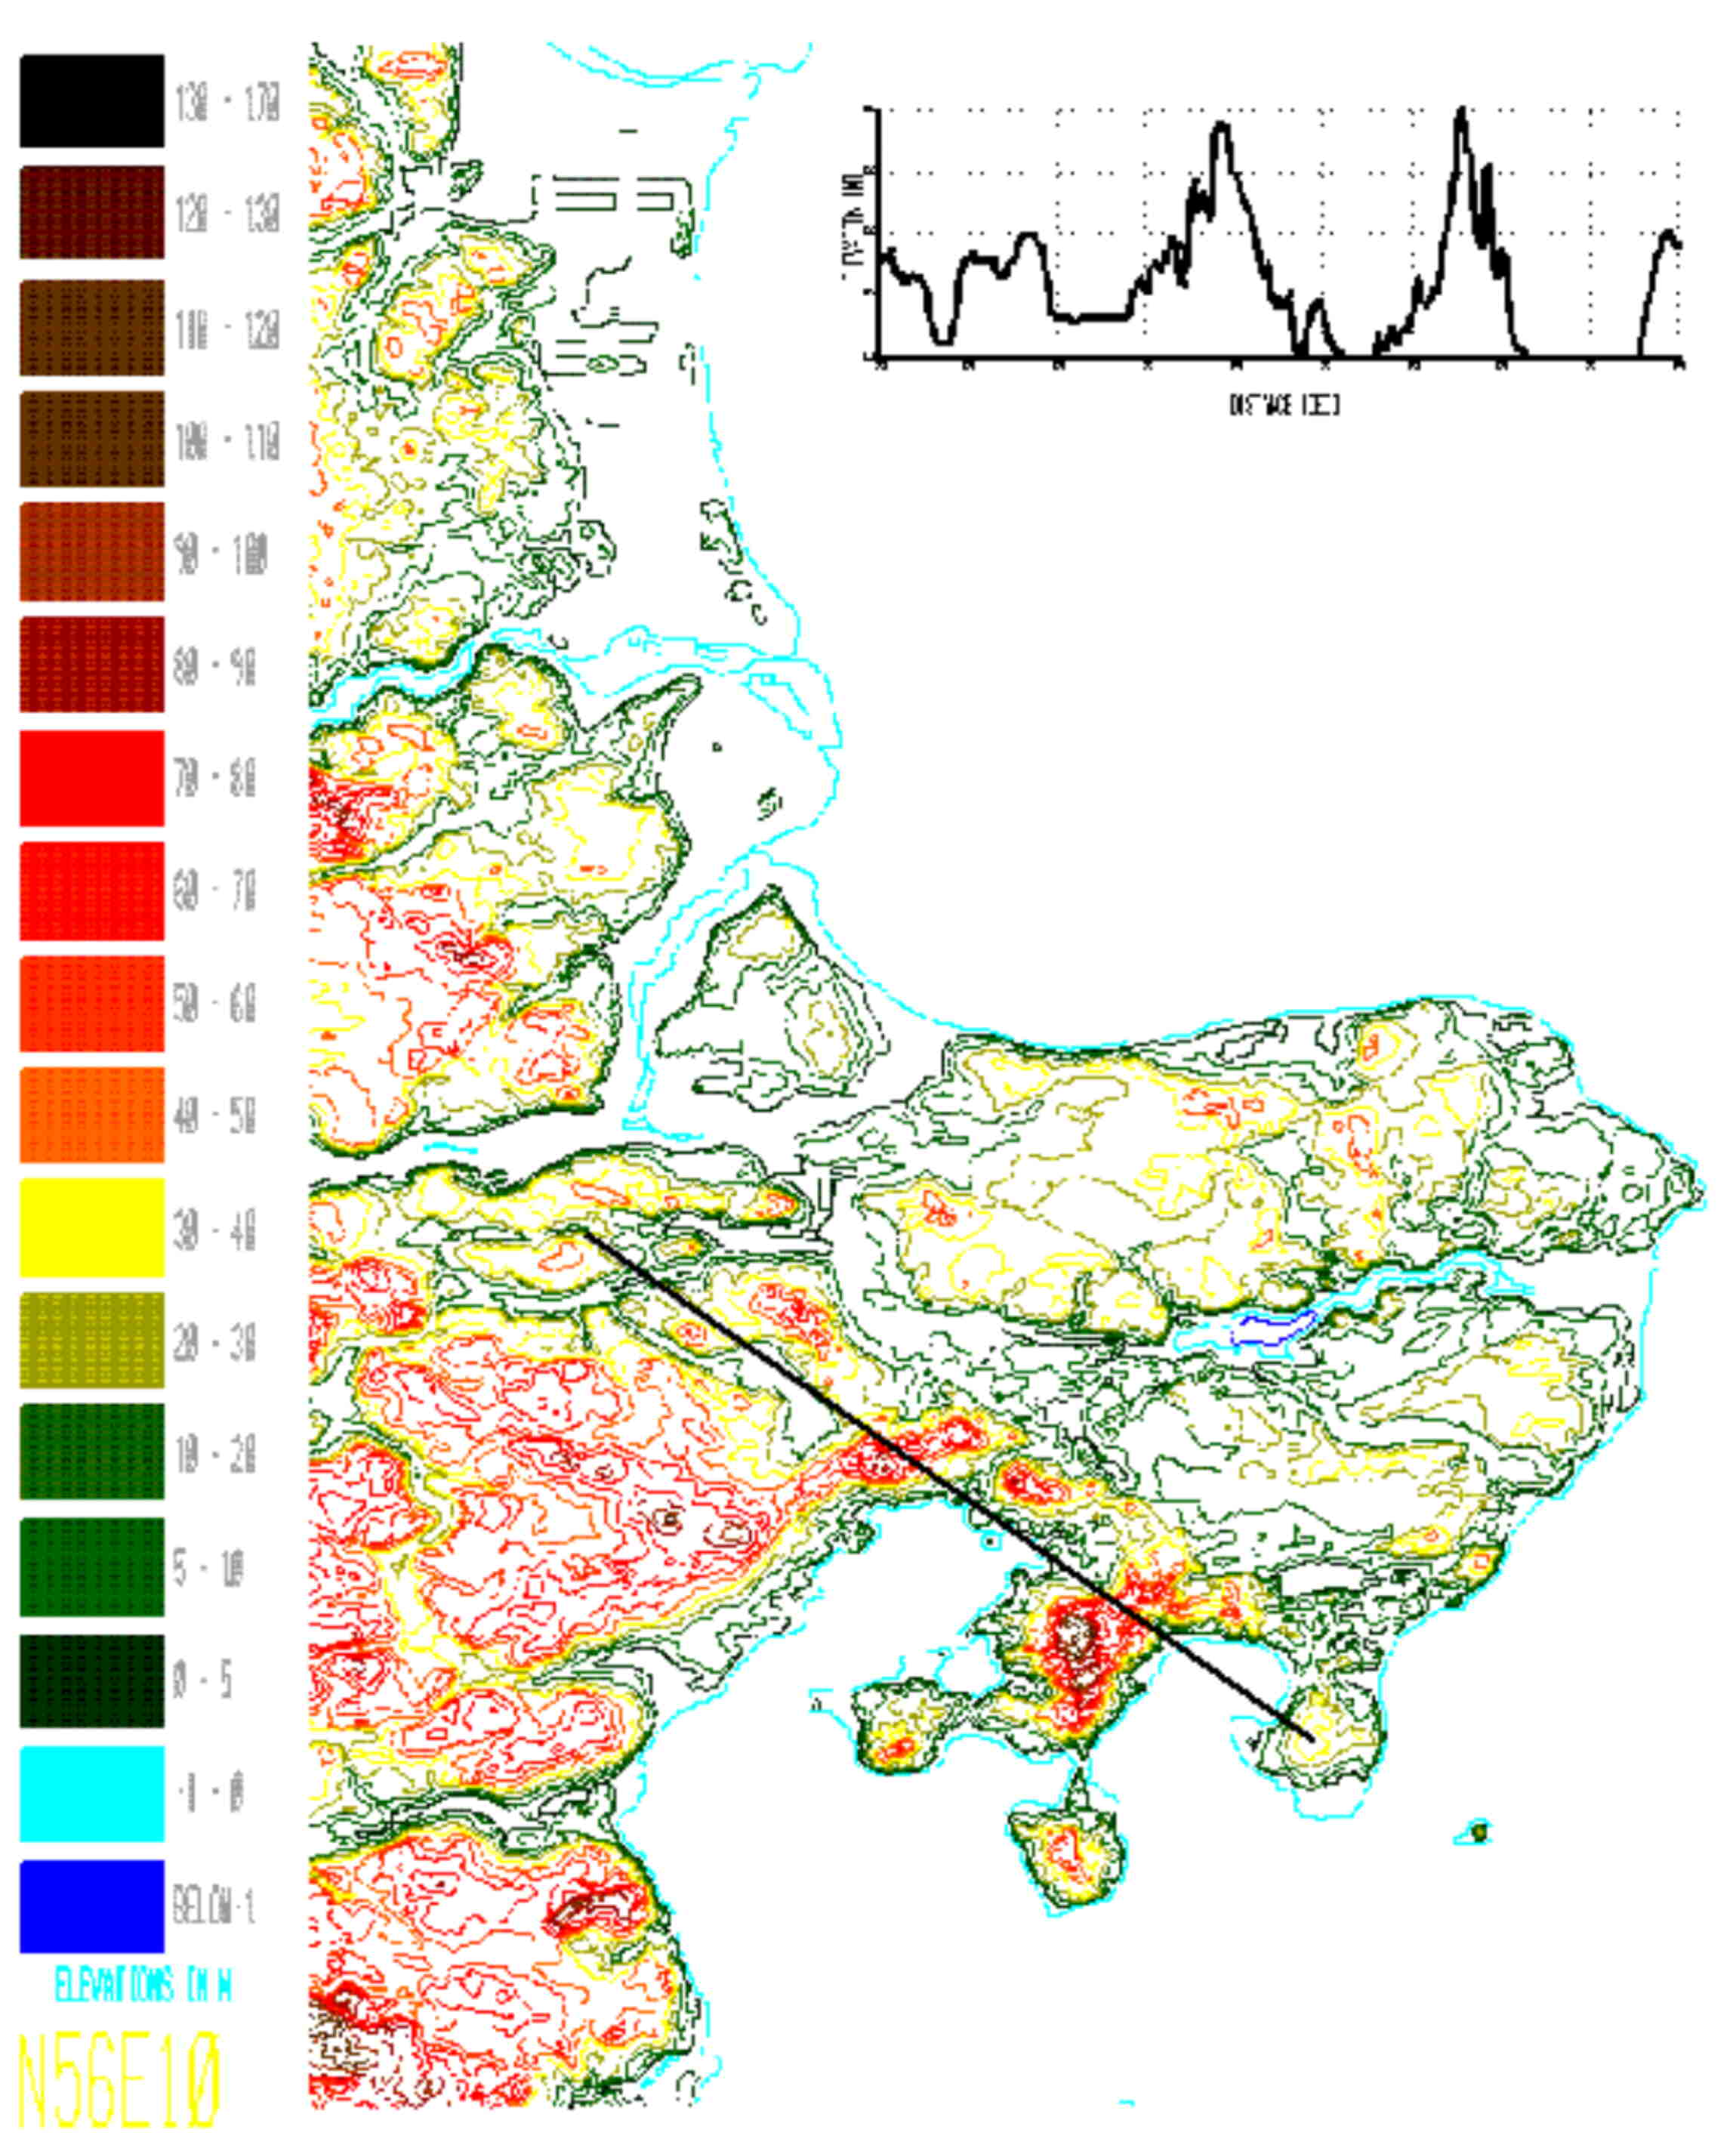
Figure 2 Terrain profile.
Profile of the terrain from a contour map of the eastern part of Jutland (generated using Intergraph�s MGE Terrain Analyst).
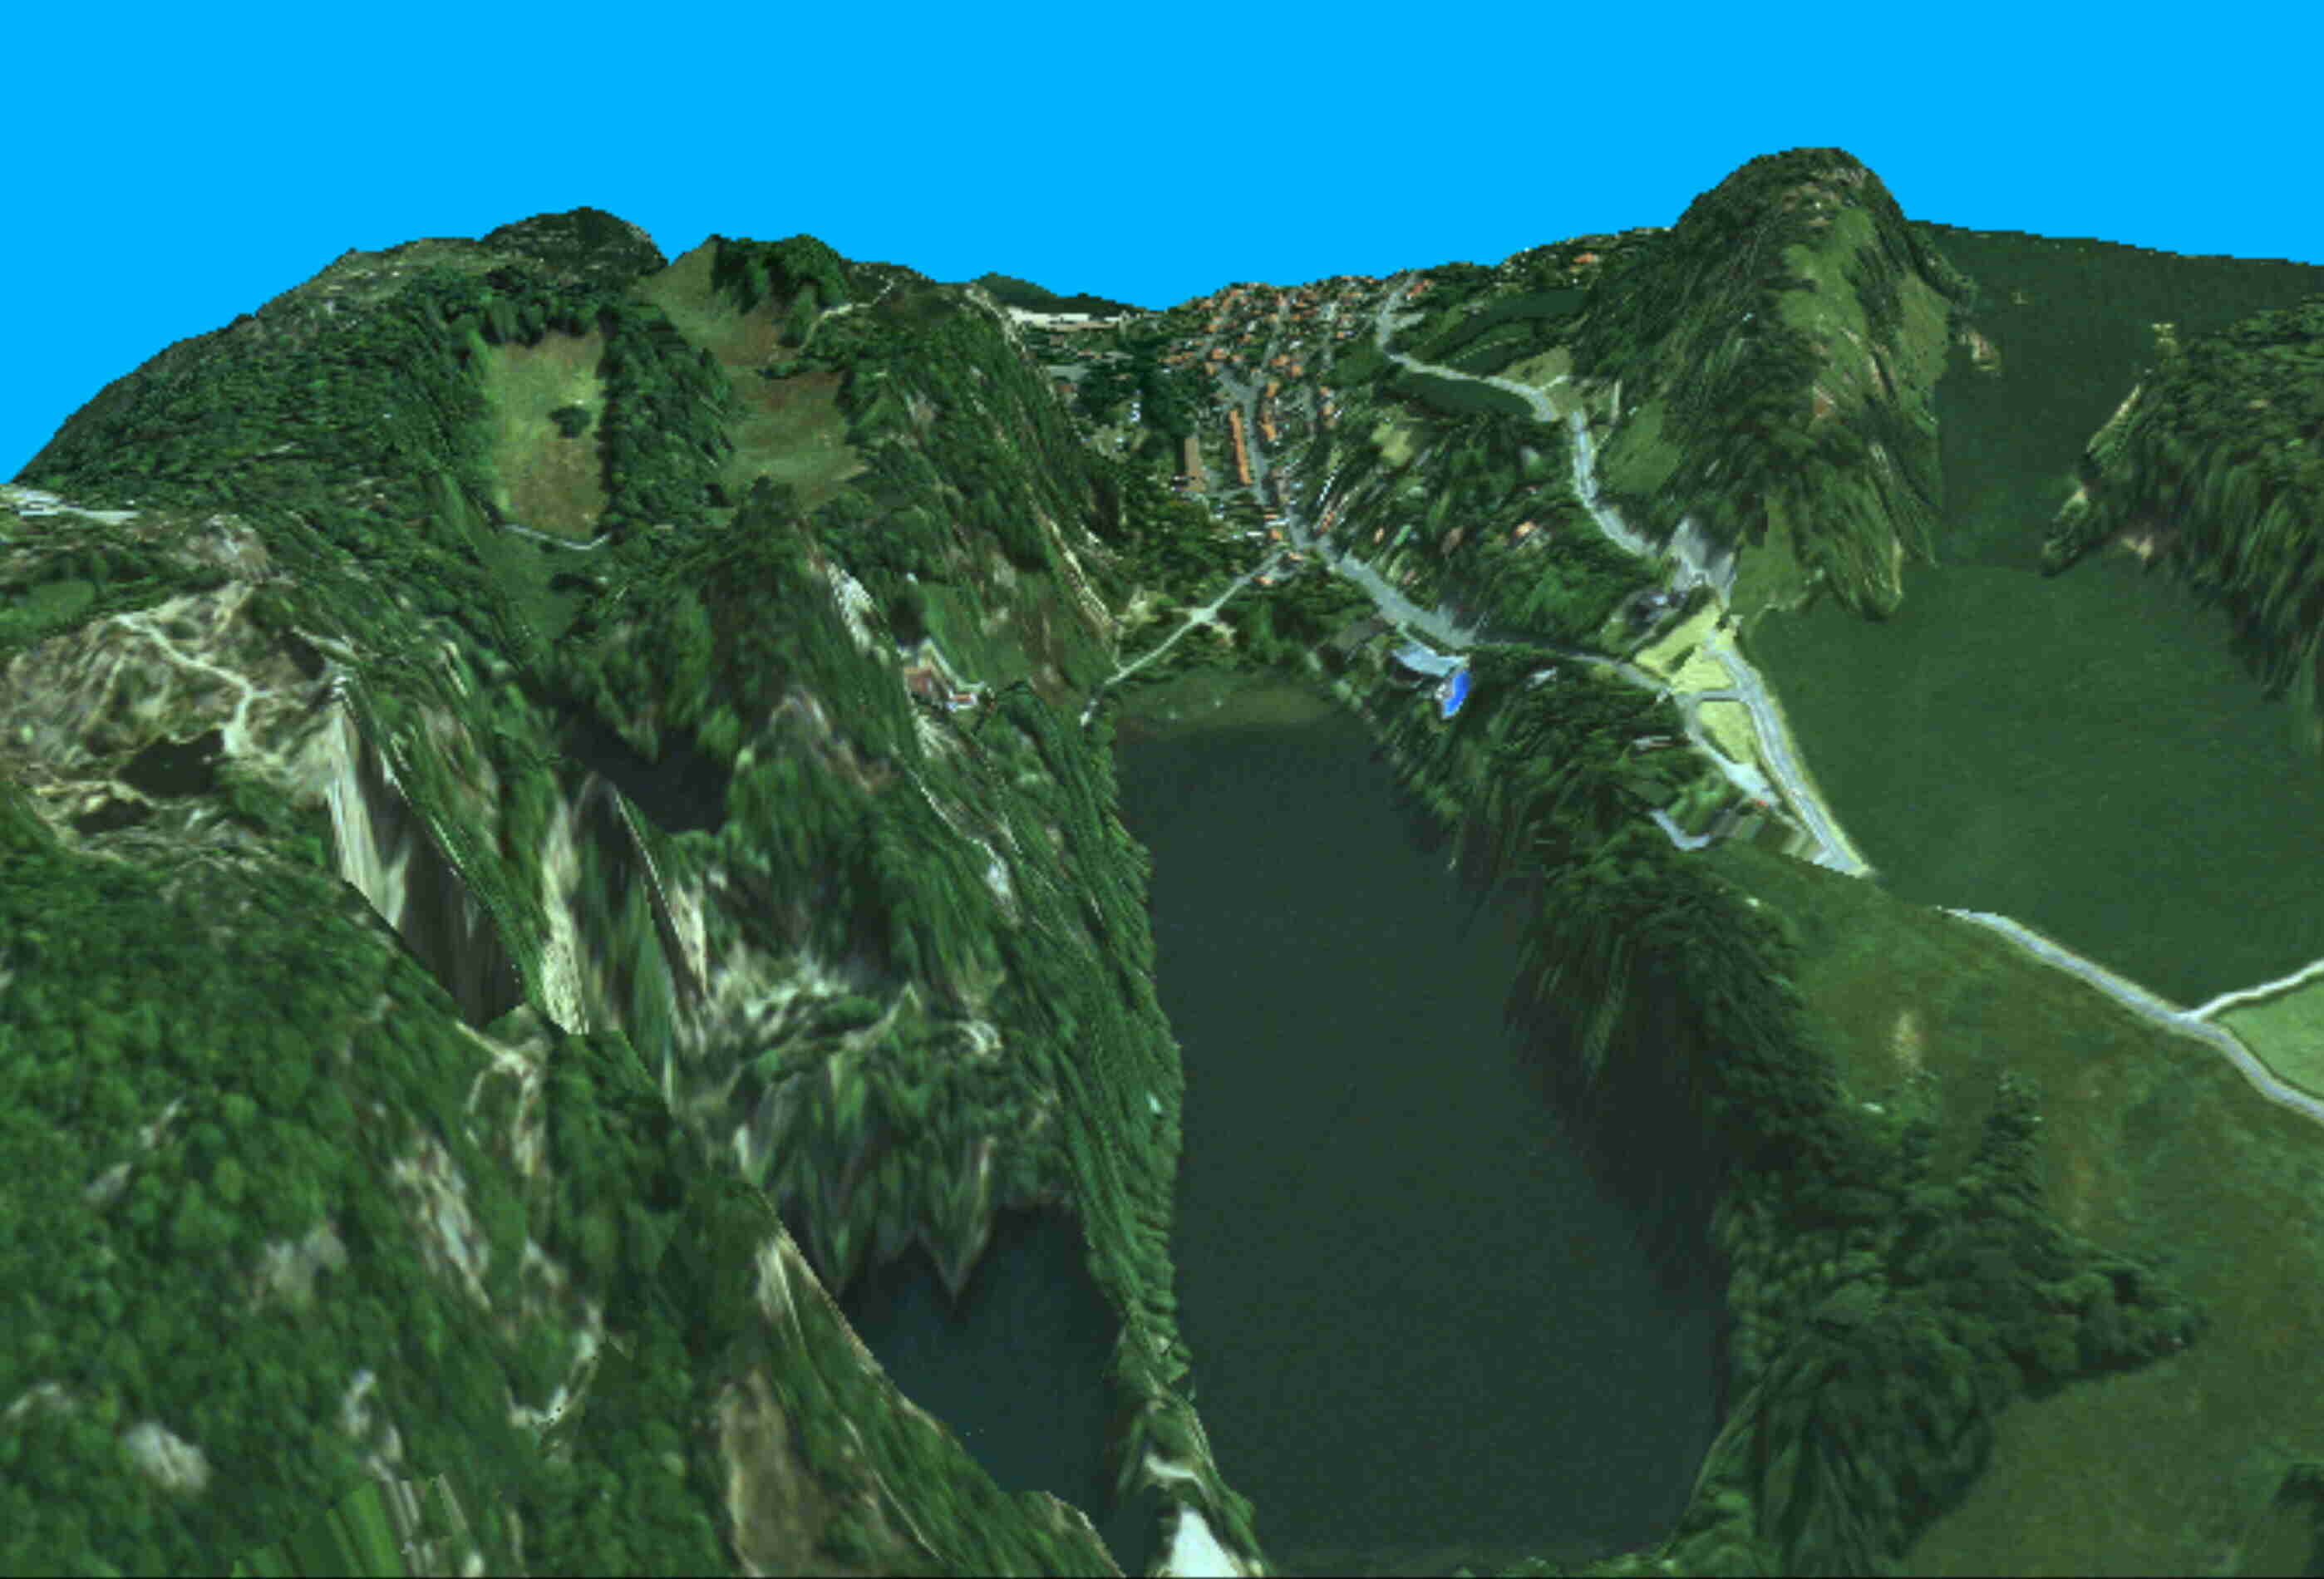
Figure 3 2�D visualisation of the northern part of the island of Bornholm.
A digital terrain elevation model with 20m between points covering an area of 2 x 3 km was overlaid with orthophotos from the area. The picture shows a part of this area, and was generated using Intergraph�s Terrain Analyst (The data ©Kamsax Geoplan).
Transport planning
Transport planning for the defence is not just route analysis using roads (see Figure 4), it is also planning for cross-country movements. To do plan for cross-country movements you need passability maps. The DDRE are involved in a project that will make the generation of the maps more automated.
Figure 4. Route analysis.
Examples of shortest routes between a number of points depicted in different colours on a map just containing roads. Generated using Esri�s ArcInfo.
Computer Aided Exercises
In computer aided exercises (CAX) digital terrain information are needed. DDRE have been involved in testing different CAX�s. Digital geographical information has been delivered to different systems under test. Two systems have received terrain elevation data (DTED), vector data and large combined raster maps. A third system required the data to be partitioned into grids. DDRE have used Intergraph�s MGE Grid Analyst to make grid data from DTED and DFAD and other vector data. Figure 5 and 6 shows a map of the result of turning data into grids. In figure 6 the data have been zoomed into so it shows the grid.
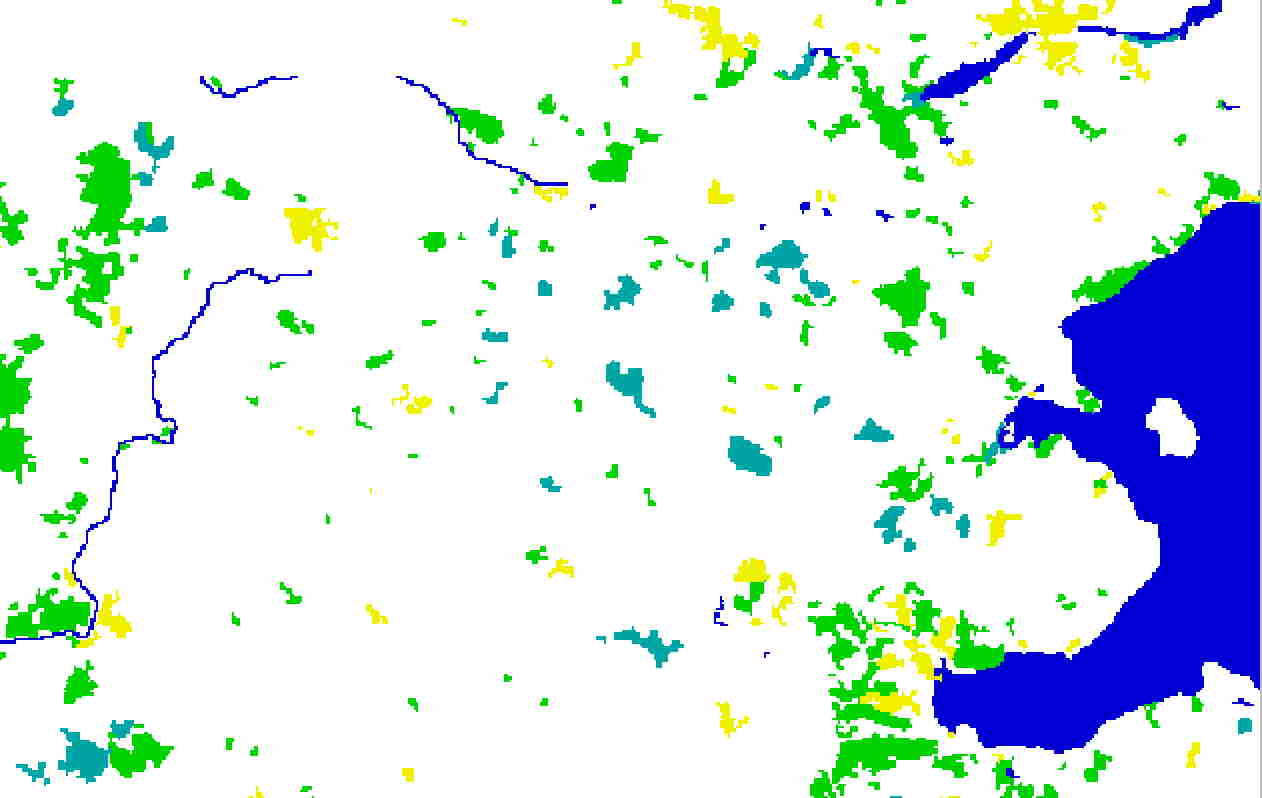
Figure 5 Grid data for a CAX test.
Grid data generated from vector data from southern part of Jutland and part of Funen. Generated with Intergraph�s MGE Grid Analyst.
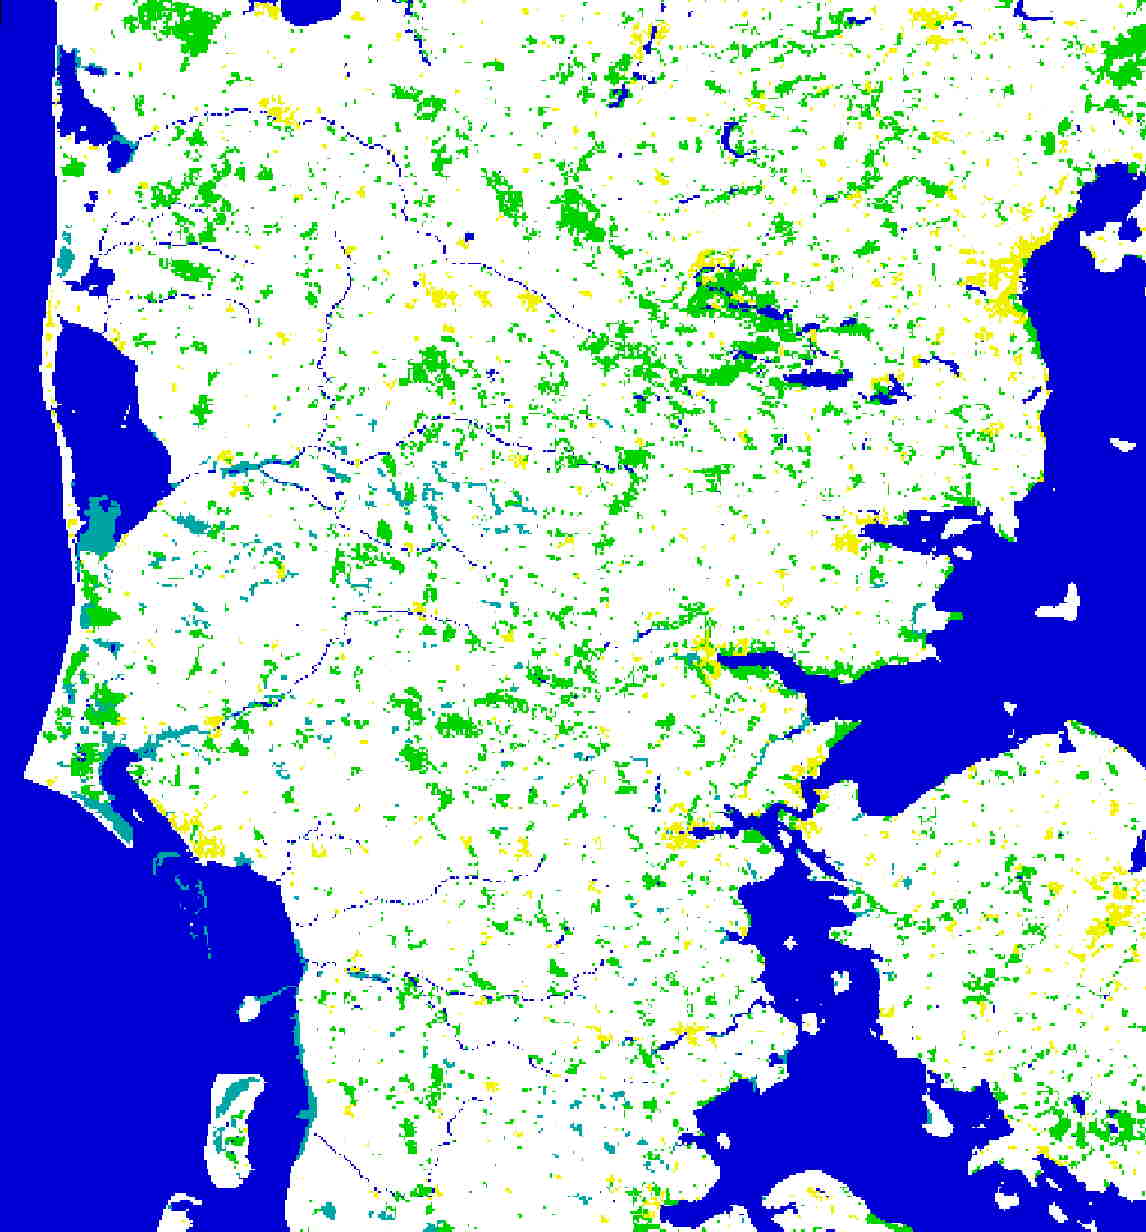
Figure 6 Zoomed view of Grid data for a CAX test.
Zoomed area of the one above. Generated with Intergraph�s MGE Grid Analyst.
Blue is water, green is forest, yellow is populated areas, and grey is wetlands.