GIS implementation
in a Developing Country,
- the case of Bhutan.
 By Hans Skov-Petersen (HSP@FSL.DK)
Department of Urban and Regional Planning
Danish Forest and Landscape Research Institute (WWW.FSL.DK)
Ministry of Energy and Environment (WWW.MEM.DK)
Hørsholm Kongevej 11, DK-2970 Hørsholm, Denmark
Telephone: +45 45 76 32 00, Fax: +45 45 76 32 33
Last update: 15/8 1997
The author was posted as GIS mapping specialist
at LUPP from October, 1992 to November, 1994. Further, he has
been working on the project at a number of occasions and is still
attached as consultant. The views expressed in this paper are
the authors, rather than a reflection of DANIDA's, The Land Use
Planning Projects or the Royal Government of Bhutan's official
opinions.
- Abstract.
- Introduction.
- Danish GIS activities in developing countries.
- The kingdom of Bhutan.
- The setting of Land Use Planning Project (LUPP).
- Map production and procedures.
- Implementation considerations and strategies.
- Selected References.
- More nice pictures from Bhutan.
A PC ARC/INFO based system was established within
the Land Use Planning Section of the Ministry of Agriculture,
Royal Government of Bhutan. The primary task was to produce a
national coverage of maps in scales of 1:50,000, 1:100,000 and
1:250,000, based on data collected from satellite image hard copies,
existing topographic maps and field work. Later, the system has
been used for production of a vast range analytical and mapping
tasks; including local planning maps in 1:25,000 and terrain modelling.
The GIS unit, initially established in 1992, is still in full
operation.
The choice of a scaleable 'low end', PC-based
GIS, is regarded as crucial for the success of the implementation
of the system, both in terms of human resources, institutional
development and technically.
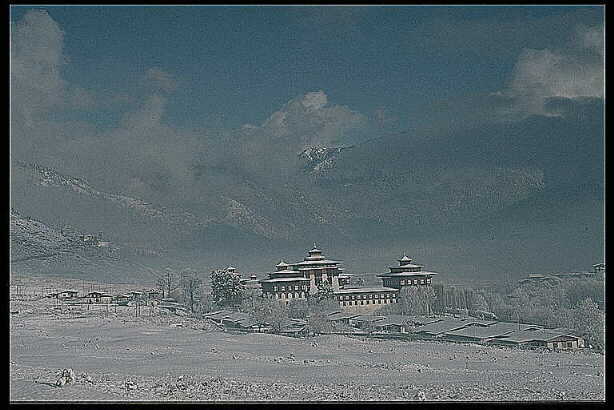
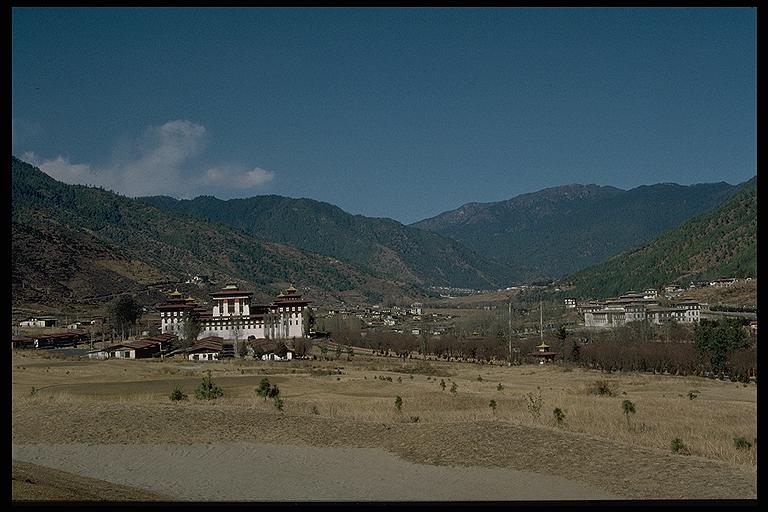
Tashichho Dzong: The governmental head quarter
and main monastery in the capital Thimphu. Rare winter snow.
Back to Content.
 The Land Use
Planning Project (LUPP) is funded by the Danish development assistance
(DANIDA). The project was fielded in October, 1992, and will,
in its present form, continue until July, 1997.
The Land Use
Planning Project (LUPP) is funded by the Danish development assistance
(DANIDA). The project was fielded in October, 1992, and will,
in its present form, continue until July, 1997.
The ambitions, in terms of GIS, were in the beginning
fairly modest. The need was a facility for efficient production
of maps, by combination of information from a variety of data
sources. Only later the expected wish for analytical capabilities
came true.
The challenge of producing useful and accurate maps
and a digital map database for the entire nation of Bhutan, considering
the limited number of people and time available, was overwhelming.
It would have been impossible if it wasn't for the facilities
provided by modern GIS-technology.
The choice of a low-end system is considered crucial
for the success of the project. The development of desktop GIS's
is mainly targeted on the data presentation and, to a lesser extent,
analytical capabilities. In most developing countries, where data
collection still has a major role to play, the need of well developed
and supported low-end tools like PC ARC/INFO and DAK.
Back to Content.
The Danish government donates approximately 1 % of
the GNP to Overseas Development Assistance (ODA). In 1995 the
donation via the Danish Development Assistance (DANIDA) under
the Ministry of Foreign Affairs was 9.07 billions DKK (approximately
corresponding to 1.6 billion USD). The budget is equally split
between bi- and multilateral activities. In addition the Danish
Environment and Disaster Relief Facility (EDRF), administrated
by the Ministry of Energy and Environment in 1995 donated 705
Million DKK (approximately corresponding to 1.3 million USD) to
development projects. It is the intention that this fund should
increase to 0.5% of the Danish GNP by the year of 2002 DANIDA,
1996).
The usage of GIS is playing an increasing role in
development projects. A brief survey was carried out in the spring
of 1997 to assess the GIS activities in Danish development projects.
Major organisations, NGO's and private companies were asked to
list projects having GIS-components by country and sector. The
table below (Table 1) presents a summary of the results. The survey
is not exhaustive, but covers a significant part of the activities.
|
| | Region
| |
|
| Sector
| Africa
| Asia
| East Europe
| South East Asia
| Sum of Sector
|
| Agriculture and Animal Husbandry
| | 3
| 1
| 1
| 5
|
| Cadastre
| 1
| 1
| 7
| | 9
|
| Environment
| 1
| 1
| | 1
| 3
|
| Geodetic
| |
| 3
| | 3
|
| Natural Conservation
| 1
| | 1
| 1
| 3
|
| Regional Planning and Development
| 2
| |
| 2
| 4
|
| Utility
| 2
| 1
| 1
| 2
| 6
|
| Water Management and Planning
| 2
| 4
| 1
| 3
| 10
|
| Sum
| 9
| 10
| 14
| 10
| 43
|
Table 1. Brief list of Danish development projects,
having GIS activities. Number of projects by geographical region
and sector.
Organisations involved includes: Carl Bro, Cowi Consult,
Danish Hydraulic Institute, Denconsult, Kampsax, National Survey
and Cadastre - Denmark, Nordeco and Ornis Consult. I will hereby
take the opportunity to thank managers and employees for taking
the time to facilitate the information.
The usage of GIS have obvious potential in development
projects. GIS works best in vast areas, having a low level of
information, - two measures that often are fulfilled in developing
countries. Further, development projects often develop entire
organisations and information infrastructur, including major primary
data collection. This gives an enhanced background for successful
GIS-implementation.
Denmark, being a geographically small country, with
a very high level of information, can be seen as a place of lesser
opportunities, in terms of GIS challenges. Danish GIS academics
often go abroad in order to pick up these challenges.
Back to Content.
General information about Bhutan. All numeric
figures are approximate.
| Area | 40,000 km2
|
| Population | 600,000.
|
| Capital | Thimphu.
|
| Neighboring countries |
India and China. |
| Geographical situation. (Do you want to see a map?)
| 26°30' to 28°30' Latitude, North, and 88°45' to 92°15' Longitude, East
|
| Altitude | 170 to 7600 Meters above sea level
|
The Danish assistance to Bhutan will in the years
to come concentrate on health, environmental and natural resources
management and urban development (DANIDA, 1997). The ODA to Bhutan
was in 1995 54 million DKK (approximately corresponding to 9.5
million USD).
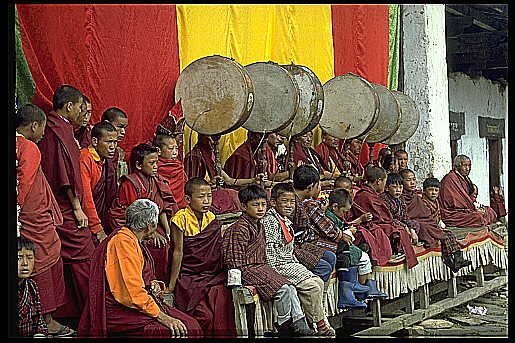
Religious ceremony in the central Bhutan.
Back to Content.
The Land Use Planning Project (LUPP) is funded by
the Danish development assistance (DANIDA). The project was fielded
in October, 1992, and will, in its present form, continue until
July, 1997. For the remaining part of 1997 an interrim face have
been established. From the beginning of 1998 a 5 year extension
of the project will been initiated. The overall objective is to
strengthen the Ministry of Agriculture, Royal Government of Bhutan
in its capability of performing land use planning. The project
is operated from an office, centrally placed in Thimphu, with
tight links to the regional administrations. Since the most abundant
type of land-use is agriculture and forestry, the project was
placed in the Planning and Policy Division of the Ministry of
Agriculture.
The project have four components: Land Resources,
Farming Systems, mapping and administration. The first two years
the project emphasized on collection and compilation of existing
information relevant for the planning activities. Production of
land use/land cover maps in scales of 1:50,000, 1:100,000 and
1:250,000 was a predefined output for the Land Resources and mapping
activity. At that time the project was staffed with four expatiates
and 13 Bhutanese.
Back to Content.
It was decided to follow the original map sheet system
and projection of the Indian sub-continent. 1:50,000 map-sheets
was quarter-degree Lat/Long, in both directions, covering the
country by 81 map sheets. The projection is Lambert Conformal
Polyconic. For co-registration of coverages, a national TIC coverage,
holding all sheet-corner-coordinates, was constructed. All 'base-map-coverages'
are still stored as tiles matching the original 1:50,000 map-sheets.

The classification system for the land use/land cover
was generated in close collaboration with the relevant Bhutanese
agencies. The classes was interpreted from SPOT PAN hardcopies
(1:50,000). For each polygon classified, the mode of verification
was recorded, i.e. whether it had been verified in field by LUPP
staff, it had been verified by other Government staff having local
knowledge or the interpretation had been based entirely on the
satellite images.
All topographic information, including 200 m contour-lines,
rivers and streams, administrative boundaries and settlements
were digitized from 1:50,000 topographic maps provided by Survey
of Bhutan. Most of the topographic maps were based on information
collected in the early sixties, and intensive inspection had to
take place, especially regarding names.
 All roads in Bhutan
have been constructed after 1960.The present network was digitized
from the satellite images, in cases supported by information captured
by means of GPS.
All roads in Bhutan
have been constructed after 1960.The present network was digitized
from the satellite images, in cases supported by information captured
by means of GPS.
All arc- and polygon-features were digitized in stream-mode.
For each layer a set of standards regarding various tolerances,
acceptance of dangles, non labeled polygons etc. were followed.
For each digitized layer a plot on transparent paper
were overlayed with the original map or image to access obvious
errors. When all layers for one map sheet were finished, a comprehensive
assessment of the quality, according to the prescribed standards
was made. Finally all maps were scrutinized by the district offices
and other relevant officials. When all 1:50,000 map sheets had
reached this stage, the production of the above 1:250,000 and
1:100,000 were initiated.
A national land cover map in 1:250,000 was
produced from the 'core' map-data-base and a set of 1:100,000 land
cover maps (one for each district of the country) was produced.
Each map displaying an area-statistic for the land cover and various
standard cartographic information, including map index, production
documentation, legends, etc. The information of these maps where
generalized; vertexes weeded out from arc, polygons under a certain
area eliminated and the land cover classification system 'collapsed'
to fewer classes. The originals for these maps were produced at
the project printer, followed by reproduction by means of optic
color separation.
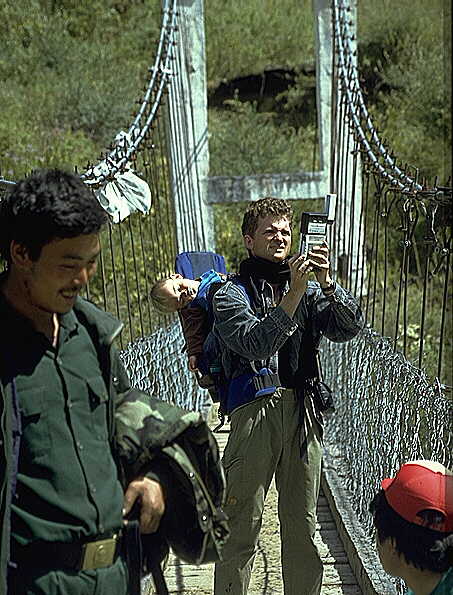
GPS measurement in the field during a training session
 The 1:50,000 maps are
available directly from LUPP in Thimphu. They are produced on
request, since the total needed number of each sheet is limited.
Errors and changes are reported from the users, changes are entered
on a running basis. To document the 'version' of the maps the
date of the resent-most file used for the specific map sheet is
printed on the map. Further, the land cover area statistic is
calculated each time a sheet is plotted. The sheets are produced
by means of a menu-driven SML procedure, enabling in/exclusion
of layers, different color modes, exclusion of legends, batch-
or single sheet mode etc.
The 1:50,000 maps are
available directly from LUPP in Thimphu. They are produced on
request, since the total needed number of each sheet is limited.
Errors and changes are reported from the users, changes are entered
on a running basis. To document the 'version' of the maps the
date of the resent-most file used for the specific map sheet is
printed on the map. Further, the land cover area statistic is
calculated each time a sheet is plotted. The sheets are produced
by means of a menu-driven SML procedure, enabling in/exclusion
of layers, different color modes, exclusion of legends, batch-
or single sheet mode etc.
The digital administrative boundaries gave a natural
opportunity to develop a system for display of various statistic
information. The polygons of the Districts and the Village blocks
were numbered according to the system used by the central statistic
authorities, in that way enabling relation to any data registered.
The farming systems data-base, another output of LUPP, was designed
to meet the same standards.
As part of the local planning activities, production
of 1:25,000 maps have been initiated. The maps have been used,
paying attention to the well-known problem that, when 'blowing
up' maps, the accuracy can't be expected to be better than their
origin. A 90 x 90 m digital elevation model was available. On
this basis 40 m contour lines and various terrain features, such
as slope and aspect, have been included. Further, agricultural
activity on steep slopes and relative flat area, not at the moment
occupied by agriculture, have been included in the map-series.
A system of quality assurance (QA) was implemented
as an integral part of the database and map production. The QA
was set up to involve both the GIS-operators, the project non-GIS
staff and the end users, - the planners and agricultural extensionists
in the ministry of agriculture and the regional administrations.
The figure shows a brief chart of the QA process.
Back to Content.
Implementation considerations
and strategies.
Objectives of the mapping activities
The objectives and expectations to the mapping activities
were from the beginning fairly modest. A production of land use
maps in 1:100,000 on a regional level and 1:500,000 on the national
level. The production should as an outset be based on a set of
manually drawn map-manuscripts in a working scale of 1:50,000.
Digital techniques were only briefly considered as an editing
tool in the data collection phase.
Collaborative organisations
A few other governmental bodies were prior to the
fielding of LUPP (late 1992) working with GIS and AM. The Department
of Forestry (DOF, Ministry of Agriculture) was producing maps
for selected areas by means of PC ARC/INFO. The Survey department
(Home Ministry) was running some early trials of digitizing, using
the Swedish produces AM/GIS software AutoKA. The fact that DOF
was already using PC ARC/INFO was part of making the choice of
PC ARC/INFO for LUPP obvious. The collaboration between LUPP and
DOF has expanded over the years both in terms of exchange of experiences
and data.
Other Organisations have used the LUPP GIS laboratory
as an outset for their emerging GIS-activities. This includes
Department of Geology and Mines and National Environmental Commission.
LUPP staff has been used as advisor and trainer. At some occasions
staff from other organisations have been joining LUPP for extended
periods for on-the-job training.
Data background
Practically digital map information was present when
the project started. All needed information had to be digitized
nationally. The choice of software had to pay very much attention
to the data-capture facilities. The analogue map background (1:50,000)
was in fairly good condition and almost nationally complete.
Human resources development
Obviously no staff of GIS-knowledge was available
in Bhutan when the project started. Never the less the staff initially
attached to the GIS laboratory learned tremendously fast and worked
very hard. The goals of the GIS activities would not have been
accomplished without them.
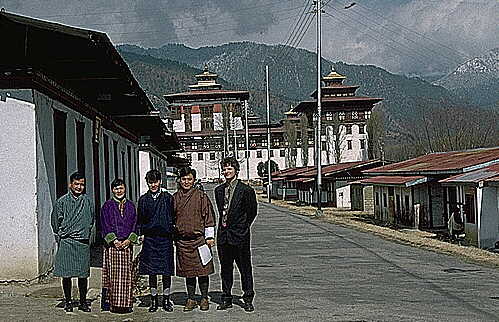
Land Use Planning GIS-Staff, winter 1996-1997
Parallel to and integrated with the GIS activities
were the land use mapping activities. Map manuscripts were produced
by the Land Resources unit of the project, then handed over to
GIS for digitizing. The production of the manuscripts was made
as a part of the training sessions running for regional planning
and extension officers. It was running in three phases: 1) Basic
training (1 week in the capital of Thimphu). Including Field surveying
techniques, map reading, GPS, presentation of the basic concepts
and practices of digital cartography etc. 2) 2 weeks field course.
Practically filed survey and production of baseline map manuscripts
(manuscripts completed by UPP staff at the return to the Thimphu
office). 3) Field course at the return of the first version of
the 1:50,000 land use maps. Practically usage of the maps and
correction of errors.
This mode of joint training and production served
several purposes: The maps were made more relevant to the end-users,
the quality of the final products were enhanced and, - not the
least, - the institutional necessity of organizational collaboration
was initiated. The goal of producing land use maps was made a
common one for the planners and the mappers.
Technological considerations
The local availability of technical support for PC
hardware repair and maintenance were in 1992, close to nil. When
equipping the project a complete set of spare-parts and fine mechanic
tools was included and hardware issues played an important role
in the training of the staff. Anything at a higher level than
PC's, e.g. UNIX workstations would have been completely out of
the question without also making appropriate support present.
Where no local support is available, or it cannot
be expected that the advisors or local project-staff can maintain
and repair high-end hardware, a lower technological standard must
be set. Further, it is important that the systems are made scaleable,
i.e. configurations must be designed to enable 'stand-alone' operation
for the system units. E.g. 1)Each (PC-) workstation should be
able to run undependable of each other in situations of LAN faults,
2) it should be possible to run plotters directly from the PC's
parallel port, 3) UPS's (se below) should be supplied to each
unit, rather that as a central supply etc.
A LAN-based system is an obvious necessity for smooth
and efficient operation of a GIS. But in a situation of LAN fault,
it should still be possible to operate the system until spare-parts
and support (in terms of technician, correspondence etc.) reaches
the site. In some cases it can also be an advantage to split the
system units into tasks. I.e. one PC is used solely for digitizing,
one for plotting (plotter connected parallely as an alternative
to a LAN connection) etc. A set of crossed 0-modem cables and
a simple communication software can prove very useful in a tight
situation.
In most developing countries special attention must
be paid to power supply. In most developed countries Uninterruptible
power Supply (UPS) is implemented to ensure continued operation
of LAN servers in a case of complete power drop out. Further,
in developing countries PC's and other fine electronic equipment
must be ensured continued power of a stabile voltage. A suede
of UPS's, voltage stabilizers and surge-protectors are often facilitated
for the purpose. It is important that the supply is split on a
series of UPS's etc. to ensure that the possible break down of
one units doesn't block the entire system.
Organisational development
As the more or less informal collaboration between
LUPP and other organizations grew the need of a formal strategy
for collaboration became visible. In a smaller country like Bhutan
the need for coordinated efforts in terms of institutional capacity
building, technical expertise, training facilities, data collection
etc. are even more expressed that in larger countries.
A future objective is to involve the regional officers
directly in the correction of existing map layers, production
of data for local planing purposes and production of local planning
maps. It is the intention to install ARCVIEW in four out of 20
districts (Dzonkhas). The system design and setup, considering
technical, organizational and human matters will be a challenge
to the central Land Use Planning staff.
A few words on the limitations of the current
setup
In the later phases of the project the limitations
of the chosen setup have become apparent. The lack of raster analysis
capability in PC ARC/INFO for DEM was obvious. At present IDRISI
is used for the purpose but further functionality is needed. The
option of Spatial Analyst (ARCVIEW) can be considered as an alternative
to the GRID module of a possible NT-workstation full ArcInfo
installation.
Additionally the limitations of PC ARC/INFO in terms
of speed and analytical capabilities when dealing with large quantities
of data have become clean. It can be done, - but it takes a serious
amount of work-arounds.
Back to Content.
Bernhardson, T. 1989. Geografiske Informationsystemer
(also available in English). Vett & Viten, A/S 1992. Isbn.
82-412-0107-9.
DANIDA, 1996. Landestrategi for Bhutan. Ministry
of Foreign Affairs. Denmark.
DANIDA, 1997. Denmark's Development Assistance, 1995-96.
Ministry of Foreign Affairs. Denmark.
Huxhold W.E. and Levinsohn, A.G. 1995. Managing Geographic
Information System Projects. Oxford University Press, N.Y.
Skov-Petersen, H. 1995. Using PC ARC/INFO for a National
GIS System. ARCNEWS, winter 1995, Esri.
Back to Content.
Back to the Top.

Setting up prayer flags
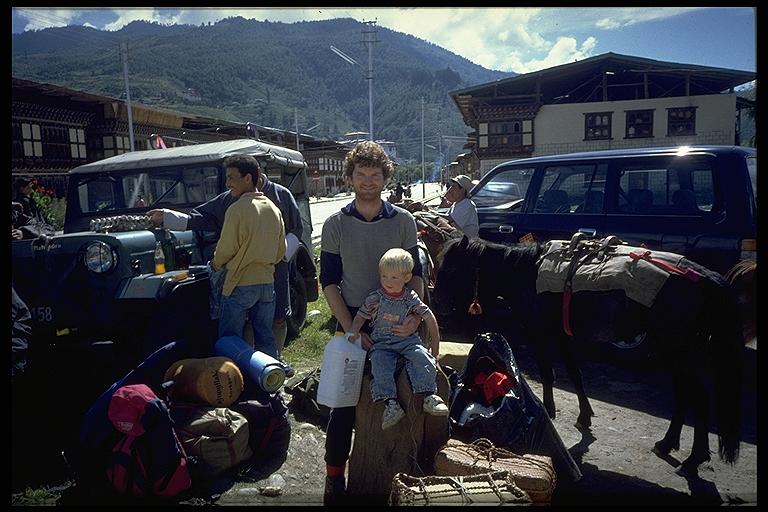
At the offset of a treck
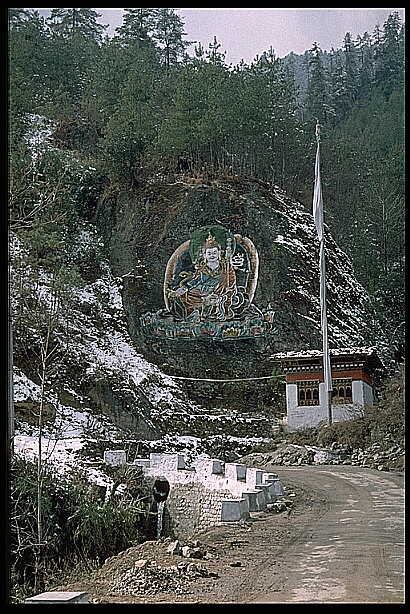
Religious decoration on a cliff
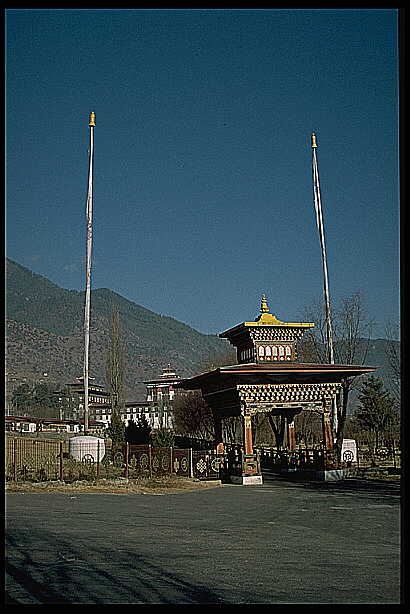
Tashichho Dzong: The governmental head quarter
and main monastery in the capital Thimphu.
Maps.
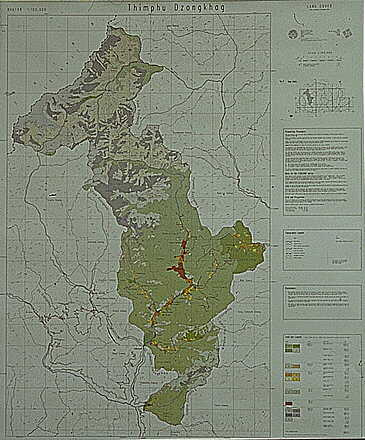
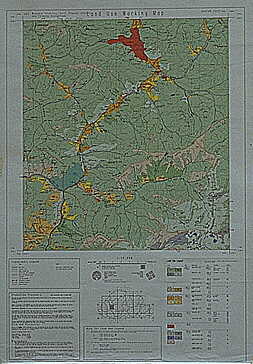
1:100,000 regional land use. Out of a series of 20
map sheets.
One more sample of a 1:100,000 map?
1:100,000 regional land use. Out of a series of 20
map sheets
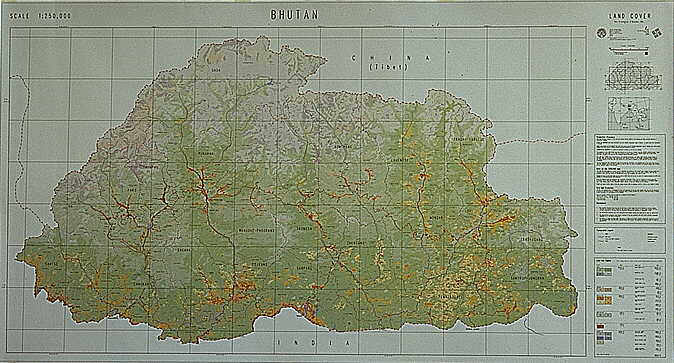
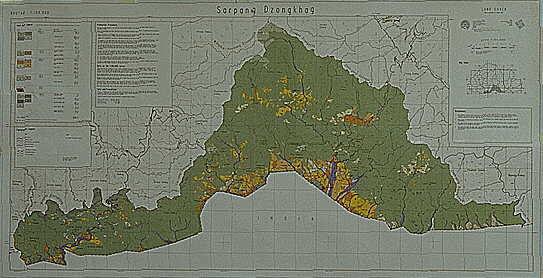
1:250,000 regional land use. Out of a series of 20
map sheets.
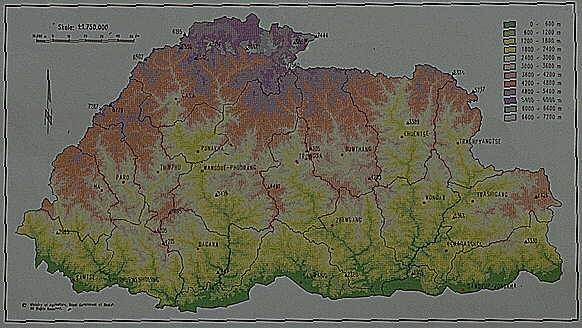
Sample altitude map.
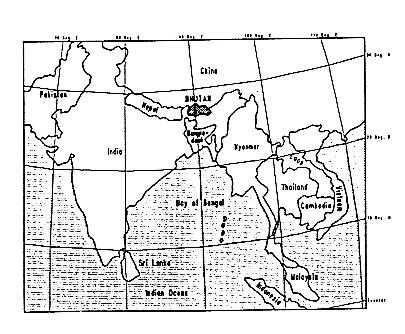
Bhurtans geografical situation in the eastern Himilayas.

- Primary digitizing.
- Operators self check, by overlaying plot and original map
or map-manuscript. Performed after finalization of each map layer.
- GIS-managers check of the quality compared with QA-guidelines.
Performed after finalization of all layers for one map sheet.
- A 1:50,000 map sheet is circulated first to the involved officers
at Land Use Planning Section, then among regional planning and
extension officers. Only after this stage data and hard copies
are released to general use.
- Production of final 1:50,000 maps. Is always produced directly
from the data base, - i.e. maps will always reflect the present
content. Maps are marked with the latest data of change of any
of the files and coverages involved.
- Data is converted to 1:100,000 and 1:250,000. Coverages are
generalized, polygons of similar attributes are removed etc.
- 1:100,00 and 1:250,000 test plots are checked by relevant
internal and external officers.
- Final production.
Back to Content.
Back to the Top.