Looking to the past to understand today – The spatio-temporal modelling of biogenic VOC emissions for the St-Martin-de-Londres region (France) using ARC/INFO softwareGertrud Schaab & Roman Lenz Institut für Angewandte Forschung, FH Nürtingen, Schelmenwasen 4-8, D-72622 Nürtingen, schaab@fh-nuertingen.de Contents
Abstract. Biogenic emissions of volatile organic compounds (VOCs) from plants play a major role in tropospheric ozone formation. Hence, reliable estimates of VOC emissions from vegetation are needed as input to regional air chemistry models. Both light and temperature influence the daily and seasonal course of biogenic emissions. The use of the complex SORAM model fully integrated within the GIS-software ARC/INFO enables us to model light and temperature in great spatial and temporal detail, including the effects caused by terrain. Thus for a region in the South of France, long-term changes in biogenic emissions due to plant succession as the result of land abandonment are simulated over a period from 1946 to 1979. These historical simulations over 34 years allow us to predict a trend some 20 years later for today’s biogenic VOC emissions. The main topics of the paper are the data preparation within GIS, the GIS-based modelling and the results concerning the long-term changes. IntroductionThe Mediterranean area is recognized as a major source of tropospheric ozone (O3) in Europe. Here volatile organic compounds (VOCs) emitted from plants play a major role in the ozone formation due to the region’s richness in aromatic plants. But also because strong irradiances and high temperatures are favouring photochemical reactions of nitrogen (Nox) and VOC precursors (Seufert et al., 1997; Versino, 1997). For regional air chemistry models, reliable estimates of biogenic emission fluxes are needed. While the EC project BEMA (Biogenic Emissions in the Mediterranean Area, 1994–1997, see Seufert, 1997) focused on the investigation of the fate and amount of VOCs from Mediterranean vegetation, the follow-up project VOCAMOD (Biogenic Volatile Organic Compound Emission Modelling from European Forest Canopies, 1998-1999, see Steinbrecher et al., in print) aims to close the gap between the emission rates screened at the branch level and the emission fluxes measured above the forest canopy by considering chemical reactions and atmospheric turbulance as well as effects caused by the 3-dimensional surface of the canopy or terrain. Both light and temperature influence the daily and seasonal course of biogenic VOC emissions. Based on BEMA measurements, models originally developed in the United States have been modified to account for differences in emission rates and driving parameters (Lenz et al., 1997). The scaling approach described in this paper uses a geographical information system (GIS) to model light and temperature in great spatial and temporal detail by taking the 3-dimensional surface of the terrain into account. The idea to model
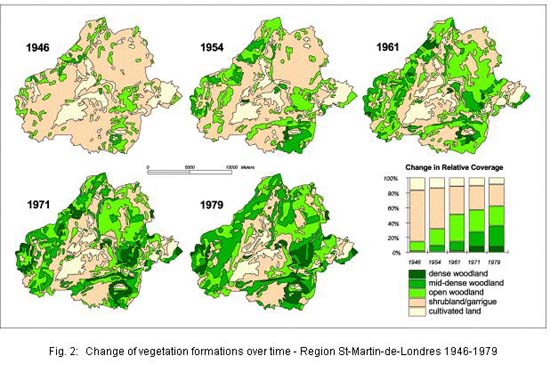
biogenic VOC emissions for the St-Martin-de-Londres region arose from a map (Debussche and Hétier, 1984) showing change in vegetation
formations for five different years between 1946 and 1979 (Fig. 2; the original eight classes and mixed areas have been
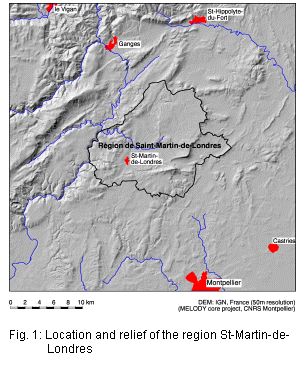
aggregated). The 187 km² area is located around the village St-Martin-de-Londres about 20
km NNW of Montpellier in the far South of France (Fig. 1). Today’s vegetation in the Mediterranean region is the
result of intensive anthropogenic deforestation since ancient times. Most of the forests
left are degraded due to man-made fires, grazing and selective timber collection (Müller-Hohenstein, 1991; Seufert et al., 1995).
On one hand the Mediterranean area is still experiencing land degradation if not even
desertification through human mismanagement. On the other hand degraded canopies can
develop to forests via regeneration stages where land abandonment has taken place.
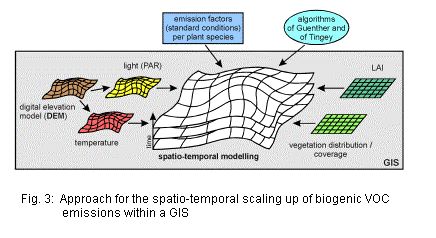
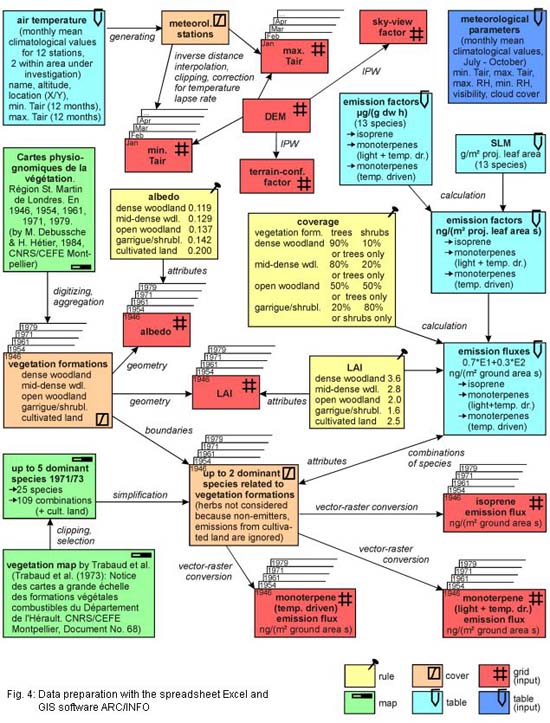
In the area under investigation, plant succession since 1946 has resulted from the discontinuation of undergrowth timber cutting, sheep breeding and viticulture. This led to the spread of tree species onto formerly cultivated land (Debussche et al., 1987). However, the maps of Fig. 2 illustrate that cultivated land decreased only slightly over time. While in 1946 69% of the area was covered by garrigue (shrubland), in 1979 is was only 29%. Open woodland had its maximum coverage in 1961 with 36% but decreased later because the more dense woodland formations increased. In 1979 28% of the area was covered by mid-dense woodland and 8% by dense woodland. There was no dense woodland in 1946. Information about the recent state of vegetation formations for the area is not available. However, by looking at the development over a time period of 34 years in the past, a trend is given of the likely impact of land use/cover changes on the amount of today’s VOC emissions emitted by the (semi-)natural vegetation some 20 years later. Fig. 3 summarises the approach and thus the main data needed for the spatio-temporal modelling of biogenic VOC emissions within a geographical information system (GIS). Emission factors (i.e. emission rates under standard conditions of 30°C temperature and 1000 µmol m-2 s-1 incident photo–synthetically active radiation (PAR)) related to plant species have to be corrected for their diurnal and seasonal course by light and/or temperature via algorithms. To account for variability in the environmental parameters caused by the 3-dimensional surface, the modelling is based on a digital elevation model (DEM). Distribution and coverage of the vegetation have to be known as well as the leaf area index (LAI) describing the biomass. The data preparation was carried out using spreadsheet (Excel) and GIS (ARC/INFO) software (Fig. 4).
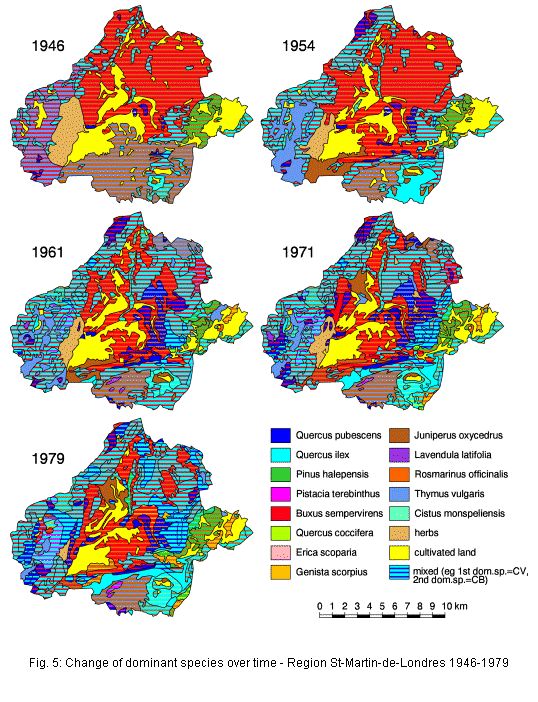
Other data preparation steps shown in Fig. 4 but not described so far cover input data sets or parameters for running the SORAM model. The maps showing change of vegetation formations were digitised and aggregated to five classes (see Fig. 2). To relate emission factors to vegetation formations the composition of species needs to be known. Here a map showing up to five dominant species for the Département de l’Hérault at the beginning of the 70s (see Trabaud et al., 1973) was used to relate dominant species to the vegetation formations of the five different years. This procedure is based on the assumption that the occurrence of species is not changing as much in the long term. Herbs were not classified because they are non-emitters. Cultivated land was not considered for modelling biogenic VOCs due to the failure of realistically assigning cultivated plant species for different years based solely on the one detailed species map from 1971/1973. The results are coverages (vector data sets) for the five years carrying attributes of up to two dominant species (see Fig. 5) as well as of vegetation formations. The vegetation formation coverages were transformed into grids (raster data sets) setting LAI values taken from the literature (Debussche et al., 1987) as attributes. Emission factors (not shown in this paper; see Schaab et al., in preparation) for isoprene, light and temperature driven monoterpenes and temperature dependent monoterpenes based on projected leaf area were derived from emission factors based on dry weight and specific leaf mass (SLM) values. Emission fluxes at standard conditions for all possible species and vegetation formation combinations were calculated considering LAI and some rules concerning the coverage. By relating the emission fluxes being processed within Excel to the GIS coverages of species related to vegetation formations, grids for the five different years and emission classes were generated. For modelling air temperature spatially climatological values from twelve stations throughout the northeastern part of the Département de l’Hérault covering the period 1975-1996 (Département Hérault Conseil Général, 1975-1996) were considered. The values of mean monthly minimum and maximum temperature of the day fixed to the point coverage of the meteorological stations were distributed into the area by an inverse distance interpolation plus taking the temperature lapse rate due to changes in altitude (0.6°C per 100 m; Rambal, 1992) into account. The values were stored in monthly grids. Here modelling was restricted to July which was considered to be the month with maximum biomass. July 17th was determined to be the average day of the month. The simulations for that day assume the same meteorological situation for all five years, hence climatological values were applied.
Modelling toolThe model used is
the SOlar RAdiation Model called SORAM (see Fig. 6 or http://www.iaf.fh-nuertingen.de/iaf/forschung/soram/index.htm)
being fully integrated within the GIS software ARC/INFO (i.e. as an AML programming code)
and based on a DEM to account for shading and horizon effects within complex surfaces. For
detailed information see Schaab (1999).
Key features are: i) the determination of atmospheric transmissivity from routinely
measured meteorological data, ii) the anisotropic modelling of the diffuse component of
solar radiation, The model has already shown its usefulness for scaling up
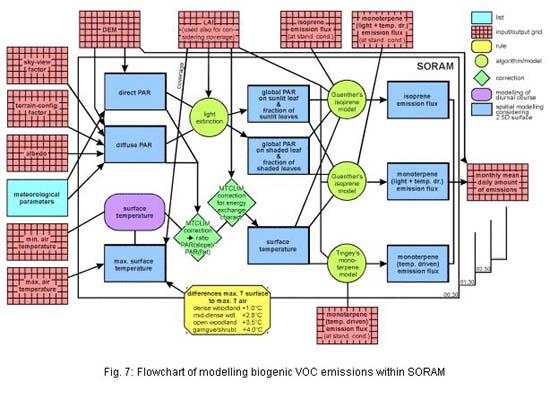
monoterpenes from the pine/oak forest St. Quercio (Castelporziano, Italy) (see Schaab et al., 1999). The flowchart in Fig. 7 illustrates the modelling steps taken at the land–scape
level. Solar irradiance incident on the surface is
simulated in high complexity for both direct and diffuse solar radiation (see Schaab et al., 1998). Light extinction is modelled
according to the sun/shade model (de Pury
and Farquhar, 1997) which was extended to the three dimensions of space.
Being a single layer model shaded and sunlit leaves are nevertheless treated separately by
dynamically distinguishing between sunlit and shaded canopy as a function of solar
position.
Temperature is modelled considering a sinusoidal diurnal course. Mean differences between maximum air temperature and maximum surface temperature derived for the vegetation formations from remote sensing data (Rambal et al., 1985) are taken into account to get closer to surface temperature. Further corrections are made based on the empirical corrections of air temperature of the mountain microclimate simulator (MTCLIM; see Running et al., 1987). This makes it possible to differentiate spatially between slopes receiving different radiant energy input as well as to adjust for different energy exchange characteristics. Since the vegetation is treated within a single layer model, vertical temperature modifications within the vegetation canopy are left unconsidered. Light and temperature are simulated spatially for every time step. Dependent on the state of the two parameters the biogenic VOC emissions are modelled in its diurnal course correcting isoprene as well as the light and temperature dependent monoterpenes by an algorithm developed by Guenther (Guenther at al., 1993) and those monoterpenes dependent on temperature only by an algorithm developed by Tingey (Tingey et al., 1980).
ResultsFor a thorough discussion of the emission modelling results see Schaab et al. (in preparation). Here only effects caused by the spatial modelling approach are shown. The change in biogenic VOC emissions due to land use/cover changes between 1946 and 1979 is presented as well as a trend given for today’s emissions.
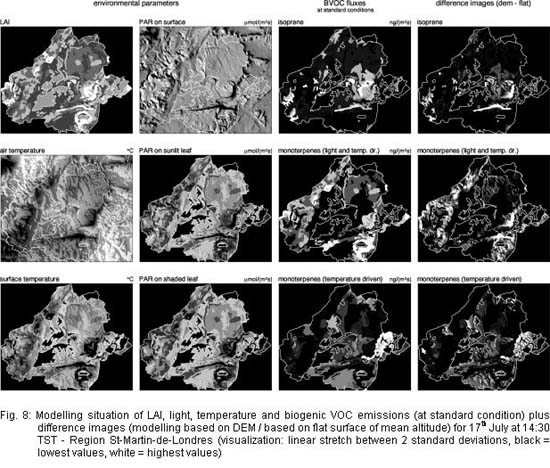
The images of the third column in Fig. 8 present the relative differences in biogenic VOC fluxes at standard conditions due to the species’ distribution within the terrain. To the left the modelling situation of light and temperature is shown for the 17th of July at 14:30 TST (true solar time) clearly revealing the influence of the terrain. While the pattern of irradiance incident on the surface can be noticed in the spatial distribution of air temperature, the influence of LAI is visible in the images of surface temperature, PAR striking a sunlit leaf as well as PAR striking a shaded leaf. The difference images at the very right were derived by running the model twice: i) considering the 3-dimensional surface of the terrain and ii) applying a flat surface with the regional average elevation, thus emphasising effects caused by the terrain. For isoprene and light and temperature driven monoterpenes, shadows cast by the terrain cause greatest deviations.
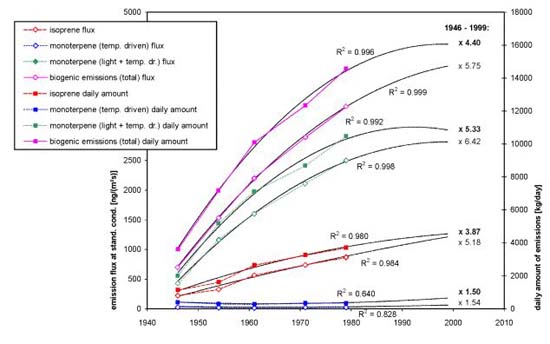
The daily amounts of biogenic VOCs in July can also be shown grouped only by compound classes (see filled symbols in Fig. 10). Values derived for five different years over an temporal extent of 34 years enable prediction of today’s emissions 20 years later than the most recent available map. The daily amount of temperature driven monoterpenes has not changed much over time. The amount of isoprene has increased steadily with emissions three times higher in 1979 than in 1946. Light and temperature driven monoterpenes show a far stronger increase with a factor of 5.2. Looking at the total biogenic VOC emissions from the region St-Martin-de-Londres for 1979, the daily amount increased by a factor of 4.0 compared with 1946. Modelling biogenic VOC emissions spatially and temporally over a full summer day indicates a factor of 4.4 for 1999 compared with 1946, some 53 years ago. When simply averaging total emission fluxes at standard conditions for the projected area under investigation (see open symbols) the trend is predicting a factor of 5.8.
Because of uncertainties already related to the data input (e.g. emission factors, species distribution) relative rather than absolute results should be emphasised. When predicting change in potential biogenic emissions, the averaging of emission fluxes at standard conditions resulted in an over-estimation compared to a spatially and temporally differentiating modelling based on a digital terrain model. The predicted 4.4-fold increase can serve as a guide to the likely impact of plant succession on total biogenic VOC emissions for the garrigue-type landcover in the Mediterranean area. SORAM has proven to be very useful for scaling up biogenic VOCs at the landscape levelbut its use is not restricted VOC emissions. Because solar radiation a important driving variable many exchange processes between earths surface and atmosphere (e.g. carbonnutrient water cycles) of generalphysically-based approach being independent sequential measurementsSORAM also seems valuable tool assessing spatial differences in other ecosystem processes. Such a complex modelling task as the scaling up of biogenic VOC emissions asks for an evaluation of GIS as the appropriate environment. Concerning the preparation of the spatial data inputs a GIS can be judged to be a very convenient instrument. As a drawback, the limited calculation efficiency within complex simulations has to be mentioned. While developing SORAM, benefits were gained from the user-friendly programming as well as the integrated data capture, management, analysis, modelling and visualisation within the ARC/INFO system. Now with a powerful model at hand, a SORAM version in a compiled programming code would offer advantages in processing speed and independence from a particular GIS platform. Also, the linking of SORAM with other models that require the spatio-temporal distribution of solar radiation would thus be simplified. However, interfaces with the most common GIS software should be supported to facilitate the preparation of data inputs and a further processing of the results. Debussche, M. and Hétier, J.P. (1984) Cartes physiognomiques de la végétation. Région de St. Martin de Londres. En 1946, 1954, 1961, 1971, 1979. CNRS/CEFE Montpellier, scale 1:100'000. Debussche, M., Rambal, S. and Lepart, J. (1987) Les changements de l’occupation des terres en région Méditerranéenne humide: Évaluation des conséquences hydrologiques. Oecologica Applicata8(4), 317-332. Département Hérault Conseil Général (1975-1996) Annales climatologiques Départementales. Publication réalisée avec le concours de Météo-France et l’Association Climatologique de l’Hérault (till 1987: Commission Météorologique Départementale: Annales climatologiques. Département de l’Hérault). de Pury, D.G.G. and Farquhar, G.D. (1997) Simple scaling of photosynthesis from leaves to canopies without the errors of big-leaf models. Plant, Cell and Environment 20, 537-557. Guenther, A.B., Zimmerman, P.R., Harley, P.C., Monson, R.K. and Fall, R. (1993) Isoprene and monoterpene emission rate variability: Model evaluation and sensitivity analyses. In: Journal of Geophysical Research 98(D7), 12,609-12,617. Lenz, R., Selige, T. and Seufert, G. (1997) Scaling up the biogenic emissions from test sites at Castelporziano. Atmospheric Environment 31(S1), 239-250. Müller-Hohenstein, K. (1991) Der Mittelmeerraum. Ein vegetationsgeographischer Überblick. Geographische Rundschau 43(7-8), 409-416. Rambal, S. (1992) Quercus ilex facing water stress: A functional equilibrium hypothesis. Vegetatio 99-100, 147-153. Rambal, S., Lacaze, B., Mazurek, H. and Debussche, G. (1985) Comparison of hydrologically simulated and remotely sensed actual evapotranspiration from some Mediterranean vegetation formations. International Journal of Remote Sensing 6(8), 1475-1481. Running, S.W., Nemani, R.R. and Hungerford, R.D. (1987) Extrapolation of synoptic meteorological data in mountainous terrain and its use for simulating forest evapotranspiration and photosythesis. Canadian Journal of Forest Research 17, 472-483. Schaab, G. (1999) Modellierung und Visualisierung der räumlichen und zeitlichen Variabilität der Einstrahlungs–stärke mittels eines Geo-Informationssystems. Dissertation, TU Dresden, Fakultät Forst-, Geo- und Hydro–wissenschaften. Schaab, G. and Lenz, R. (1998) Modellierung der Sonneneinstrahlung in einem GIS: das ”SOlar RAdiation Model” (SORAM). GIS Geo-Informations-Systeme, Zeitschrift für raumbezogenen Information und Entscheidungen 11(4), 8-14. Schaab, G., Lenz, R. and Seufert, G. (1999) A temporal-spatial solar radiation model to improve scaling of biogenic emissions from a sparse Mediterranean pine/oak forest. Physics and Chemistry of the Earth (B) 24(6), 673-680. Schaab, G., Lenz, R., Steinbrecher, R. and Lacaze, B. (in preparation): Assessment of long-term changes of potential biogenic emissions for the region St-Martin-de-Londres, France. To be submitted to Atmospheric Environment. Seufert, G. (ed) (1997) BEMA - A European Commission project on Biogenic Emission in the Mediterranean Area. Special issue of Atmospheric Environment, 31(S1). Seufert, G., Bartzis, J., Bomboi, T., Ciccioli, P., Cieslik, S., Dlugi, R., Foster, P., Hewitt, C.N., Kesselmeier, J., Kotzias, D., Lenz, R., Manes, F., Peres Pastor, R., Steinbrecher, R., Torres, L., Valentini, B. and Versino, B. (1997) An overview of the Castelporziano experiments. Atmospheric Environment 31(S1), 5-17. Seufert, G., Kotzias, D., Spartà, C. and Versino, B. (1995) Volatile organics in Mediterranean shrubs and their potential role in a changing environment. In Global change and Mediterranean-type ecosystems, eds J.M. Moreno and W.C. Oechel, Ecological studies 117, pp. 343-370, Springer Verlag, New York. Steinbrecher, R., Ciccioli, P., Duyzer, J., Kellomäki, S., Lenz, R., Seufert, G., Tenhunen, J., Valentini, R. (in print) Biogenic volatile organic compound emission modelling for European forest canopies. A contribution to GENEMIS. GENEMIS2, Annual Report 98, Eurotrac2 Secretary, GSF, München. Tingey, D.T., Manning, M., Grothaus, L.C. and Burns, W.F. (1980) Influence of light and temperature on monoterpene emission rates from slash pine. Plant Physiology 65, 797-801. Trabaud, L., Lacaze, B., Boulet, C., Etienne, M., Fulcrand, B., Jacquinet, J.C. and Kelly, D. (1973) Notice des cartes a grande échelle des formations végétales combutibles du Département de l’Hérault. Document No. 68, CNRS/CEFE Montpellier. Versino, B. (1997) Introduction and objectives. Atmospheric Environment 31(S1) (BEMA special issue), 1-3. Acknowledgements
|
|||||||||||||
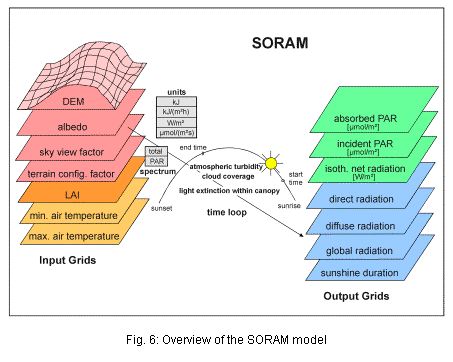 iii) the consideration of the
limitation of the horizon for direct and diffuse solar radiation, iv) the consideration of
the cloud coverage, and v) the modelling of light extinction within closed and homogeneous
canopies by a dynamic single layer model. The SORAM model has several noteworthy
strengths: The model does not require sequential measurements. The necessary input is
generally available. Thus it is not restricted to certain test sites or days. Because of
its realization as a physically-based model it can be applied to different scales (canopy
stand, landscape level). Also, it has many possible uses besides the up-scaling of
biogenic VOCs.
iii) the consideration of the
limitation of the horizon for direct and diffuse solar radiation, iv) the consideration of
the cloud coverage, and v) the modelling of light extinction within closed and homogeneous
canopies by a dynamic single layer model. The SORAM model has several noteworthy
strengths: The model does not require sequential measurements. The necessary input is
generally available. Thus it is not restricted to certain test sites or days. Because of
its realization as a physically-based model it can be applied to different scales (canopy
stand, landscape level). Also, it has many possible uses besides the up-scaling of
biogenic VOCs.