The Utility of
Geographical Information Systems (GIS) and Spatial Analysis
In Tuberculosis
Surveillance in Harris County, Texas, 1995-1998
Matthew L. Stone
ABSTRACT
The main purpose of this research study was to examine the
spatial distribution of tuberculosis (TB) cases by area in Harris County, Texas
over a three-year period, 1995-1998, using geographical information systems
(GIS) software and spatial analytical techniques.ĀĀ Analysis looked at the TB incidence
distribution in
OBJECTIVE
The main purpose of this research study was to examine the
spatial distribution of tuberculosis (TB) cases by area in Harris County, Texas
over a three-year period, 1995-1998, using geographical information systems
(GIS) software and spatial analytical techniques.Ā In doing this, it was anticipated that this
research study would demonstrate some of the valuable assets of GIS in disease
mapping and surveillance.Ā It is expected
that the information gathered by this research study will assist public health
workers by identifying and providing effective examples of using epidemiologic
data, public use statistical software and GIS in formulating study questions,
generating and testing hypotheses, and critically evaluating maps that are
prepared using GIS software and spatial statistical methods.ĀĀ In addition, useful resources (analytical
and descriptive maps) have been produced for the Houston Tuberculosis
Initiative, a population-based, active surveillance and molecular epidemiology
study of tuberculosis cases reported to the City of
INTRODUCTION
A Geographic Information System (GIS) is a very important tool for use in disease mapping, as well as public health surveillance activities to assist in identifying high-risk groups.Ā Because GIS is software for mapping and also has an embedded relational database component, it makes the management and analysis of public health surveillance data very organized for determining spatial and time trends.Ā Disease cases can be viewed in their surrounding social context and patterns of their geographical distribution can be analyzed by using various spatial statistical methods that account for differences in location characteristics (e.g.; latitude and longitude).Ā In addition, due to its ability to identify and map environmental factors associated with disease vectors, GIS is increasingly important in infectious and vector-born disease surveillance.7,25,26,38,46 All of these characteristics, coupled with the ease of use with the proper training, allow for the mapping of surveillance and disease data to be within reach of even the smallest health departments.Ā GIS can assist epidemiologists by adding descriptive images that are systematically created according to proper scientific protocol as well as allow for evaluations of potential cluster investigations when combined with robust statistical methods and software.Ā Detailed mapping can be produced with GIS and revised an infinite number of times with little effort, enabling the creation of a variety of new types of maps that could be useful in public health management and practice.ĀĀ An ideal outcome would be that communities have the capability to link together health information from various data sources for efficiency and centralization in order to recognize spatial data patterns that may suggest where cost-effective public health interventions can be applied.40
The Role of GIS Technology
in Public Health Efforts
The use of geography in epidemiologic studies is not a new
phenomenon.Ā Probably the most widely
cited study for first incorporating the combination of field epidemiology and
geographical analysis is John SnowÆs analysis of local water pumps and their
relationship with the spread of cholera in
GIS mapping can also allow researchers to examine many different types of questions involving the particulars of a specific location, the distribution of certain phenomenon, the changes that have occurred since a previous analysis, the impact of a specific event, or the relationships and systematic patterns of a region.6ĀĀ The GIS database becomes a model of spatial information that can be used in epidemiologic and health research in order to recognize the specific spatial structure of a process.23Ā A particular spatial structure includes the individuals affected and how they are connected in communities, as well as the dynamics of these communities and their organization into larger units.36Ā The geographic component of the GIS becomes a method of classifying data records into groups (administrative areas) separately from the personal characteristics of the individuals and allow for examination of aspects of location that are not captured by variables observed directly for the individuals.44Ā However, when detailed location information is available for individuals, it is not necessary to aggregate information into groups. It is possible to fit models that include spatial correlation components and do so without compromising confidentiality of the individuals by using varying levels of resolution to display patterns.Ā The nature of GIS allows for flexibility in utilizing different techniques for mapping data through the use of area-based (counts of cases) and point-based (actual incident cases) data types.
Factors Influencing a
Spatial Analysis of TB
Unfortunately, until more recently, the use of GIS in the study of infectious disease and, more specifically tuberculosis, has been less documented than that of chronic or environmentally related illness.Ā In fact, some believe that there is little appreciation amongst public health professionals of the value in mapping communicable diseases or associated risks.Ā ōLimited resources, large datasets, and concern for the maintenance of patient anonymity, combined with under-recognition of the benefits of conducting geographical analysisģmean that the spatial references required for disease mapping are frequently not made available.2ö This does not have to be the case though, as GIS allows the researcher to display data at different resolutions and aggregations in order to protect confidentiality.Ā This should not limit the use of analytical methods to describe geographical variation in the distribution of infectious diseases that will be readily understood and used by public health professionals.
A national plan dedicated to the elimination of tuberculosis (TB) in the United States by 2010 (defined by a case rate of less than 1 per 1,000,000 population) has been in place since 1989 by the Centers for Disease Control and Prevention (CDC) and the Advisory Council for the Elimination of Tuberculosis (ACET).12, 35ĀĀ The most recent data for reported incident cases of TB in the United States shows a low of 16,377 cases during 2000 compared to 17,531 cases for 1999.11ĀĀ Although data show a significant decrease in TB cases during most of the last decade, there is still concern among medical and public health professionals to provide new diagnostic and therapeutic tools to continue this progression towards TB elimination and to deal with the impending tide of individuals with latent TB infection that serve as a reservoir of future cases.1Ā In fact, one of the greatest scientific advances in TB detection methods has been the use of genetic molecular characterization such as restriction fragment length polymorphism (RFLP) analysis.Ā Population-based studies have shown that identification of TB case clusters is significantly enhanced by profiling certain copies of TB DNA (defined as probes) and has become a standard tool used in TB epidemiologic studies.43
Tuberculosis, in general, is frequently associated with marginalized populations such as the homeless, persons living at the poverty level, and those living in overcrowded housing, such as immigrants.Ā Numerous studies, both in the United States and abroad, have shown these factors as well as human immunodeficiency virus (HIV) infection, increasing cases among foreign-born individuals (in the U.S.), drug use, multi-drug-resistant TB (MDR TB) and living in various institutional settings are responsible for a large proportion of the TB cases reported annually.5,8,9,13,15,17,37,39,45
In 1999, the CDC provided revised recommendations for TB prevention that included issues for: using elimination strategies based on local epidemiology, establishing new strategic partnerships to effectively reach the diverse population of people at risk, enhancing the use of current tools for TB prevention and control, developing new tools for TB elimination, recommitting to the global battle against TB, and supporting broad-based efforts for TB prevention and control at all governmental levels in the U.S.Ā Of specific relevance for this research study is CDCÆs view that surveillance and program evaluation data show areas for improvement.12 ĀĀThere are particular concerns about individual contacts maintaining compliance with or even starting TB therapy, as these are the individuals most likely to become future TB cases.Ā According to the CDC, strategies that target groups at high risk for TB and treat those infected have often been poorly applied.12ĀĀ In order to effectively deal with this surveillance issue, one objective should be to develop and implement systems to conduct active case finding among high-risk populations, when appropriate.12ĀĀ As an example, TB-control staff members could be trained to use local epidemiologic data, coupled with GIS, to consistently identify high-risk groups that are deemed appropriate for targeted testing (e.g. immigrant populations) and to ensure that a greater proportion of infected persons begin and complete therapy.Ā
Incidence of
Tuberculosis in
Although there was a steady decrease in cases overall (from 12.7/100,000
to 9.2/100,000)11 , the incidence in
RESEARCH QUESTIONS
- What is the geographical point distribution of all reported tuberculosis cases in Harris County, Texas from October 1995 through September 1998?
- What are the spatial patterns of tuberculosis cases and clinically defined clusters in Harris County, Texas from October 1995 through September 1998 and what is the statistical significance of these patterns?
- What is
the estimated incidence of tuberculosis in Harris County, TX at the 2000
U.S. Census block group level from October 1995 through September 1998 and
are there statistically significant low or high rate areas (compared to a
standardized rate for
- What is the geographic distribution of tuberculosis cases of the same genetic type among individuals in reference to a specific mode of transmission (public transportation) and is there an apparent geographic clustering of these similar genetic types?
METHODOLOGY
Study Population
Secondary data analysis was
performed on a subset of data collected during the 36-month period from October
1995 to September 1998 by the Houston Tuberculosis Initiative Program
(HTIP).Ā HTIP is an ongoing,
population-based, active surveillance and molecular epidemiology study of
tuberculosis cases reported to the City of
Database Organization
and Geocoding
In order to allow for spatial analysis and mapping of individual TB cases, the address of each case at time of entry into the study was geocoded.Ā This involved assigning a latitude and a longitude for the address utilizing specialized geocoding software20 and a database of street network files.22ĀĀ The process of address matching involved matching the street address number, street, city, and zip code with the corresponding street segment in the street network file.Ā Over 98% of the cases (n=1459) were exactly matched by the geocoding software. Some of the edits involved in the address matching of the final 22 cases involved corrections of: misspellings; mistakes in street typing (Road instead of Street); and problems with street numbering. Only one case was unable to be matched as there was no valid address information for this case.Ā Subsequently, this case was dropped from the final analysis.Ā
When analytical methods were used
that included the observed points only, without aggregation to specific areas,
the subset of 1480 cases was used.Ā
However, because some of the spatial methods used in this analysis
required boundary restrictions and aggregation of points to specific areas
(block groups, census tracts), only the boundary of
Most of the spatial analytical methods used in this project were based upon point pattern methods where the objective is to determine if there is a tendency for events (TB cases) to exhibit a pattern; some form of regularity or clustering.3 ĀĀThe cases were the geocoded addresses from the data set as described above and the attributes were the spatial coordinates (latitude and longitude) and the various independent variables under consideration.Ā The data under study represented Āa complete map of events of tuberculosis between October 1995 and September 1998 (because the number of 1995 cases were so few, they were aggregated with 1996 cases, creating the time period 1996-1998 for analysis purposes) and the study region was comprised of the area of Harris County, Texas. ĀThe main purpose of this analysis was to follow exploratory spatial analysis methods to generate possible hypotheses for future analyses and to suggest possible explanatory models to describe the observed processes.Ā There are various ways in which one can view a spatial point pattern and the following exploratory methods outline the processes utilized in this research study to examine properties of intensity (mean number of events per unit area; 1st order properties) and spatial dependence or interactions (relationships between numbers of events in the study area; 2nd order properties).Ā
Kernel Estimation
The function of kernel estimation
was to obtain a smooth estimate of a bivariate probability density from an
observed sample of observations. For any chosen kernel and bandwidth, values of
intensity can be examined at locations on a suitably chosen grid over the study
area to provide a useful visual indication of the variation in the
intensity.Ā The individual kernel
estimates for each cell are summed to produce an overall estimate of density
for that cell.Ā Through this method we
are provided with a summary of how events tend to cluster throughout the study
area as a means of assessing 1st order properties.Ā ĀĀThe
study area was a rectangular grid placed over the whole of
In order to adjust density
estimates for heterogeneous population distributions (such as population at
risk of disease in an area) one can also use a ratio of kernel estimates
for intensity of events and population density.32Ā ĀThis
allows for the viewing of an image that takes into consideration the intensity
of events along with the intensity of population and begins to provide an
estimate of case risk.Ā This also assists
in judging whether what is viewed as cases converging towards a specific area
is a function of population density or not.Ā This procedure is easily obtained through
the use of CrimeStat«
software32.ĀĀĀ For the
purposes of this procedure, a quartic kernel method was used with a
fixed bandwidth of 1.25 miles (for both kernel calculations) in order to obtain
a smooth model for descriptive purposes.Ā
Cell size was adjusted in order to create a grid covering all of
Nearest Neighbor
Distances
Nearest neighbor distances were the exploratory methods used in this
study in order to investigate second order properties (looking at possible
relationships between points) using ![]() (w) or
(w) or ![]() (x) distances3 between observed events in a study
area. ĀThis provides information about
inter-event interactions at small distances which could provide useful
information when dealing with an infectious disease such as TB.Ā Calculations of these distribution functions
were provided by S-plus 2000« 33 and a limitation on the total distance used was set at approximately 3.5
miles (.05 degrees latitude). The
resulting empirical distribution function
(x) distances3 between observed events in a study
area. ĀThis provides information about
inter-event interactions at small distances which could provide useful
information when dealing with an infectious disease such as TB.Ā Calculations of these distribution functions
were provided by S-plus 2000« 33 and a limitation on the total distance used was set at approximately 3.5
miles (.05 degrees latitude). The
resulting empirical distribution function ![]() (w) was
plotted against suitable values of distances and the resulting empirical distribution
function
(w) was
plotted against suitable values of distances and the resulting empirical distribution
function ![]() (x) was plotted against the theoretical distribution function
of Complete Spatial Randomness (given by the equation 1- exp(-ply2)) in order to explore possible evidence of
inter-event interactions.Ā
(x) was plotted against the theoretical distribution function
of Complete Spatial Randomness (given by the equation 1- exp(-ply2)) in order to explore possible evidence of
inter-event interactions.Ā
ĀĀĀĀĀĀĀĀĀĀĀĀ The above nearest neighbor distance methods were useful for looking at
patterns among the closest events and in considering small scales or patterns. ĀTherefore, a loss of information occurs
because only these smallest patterns of scale are considered.Ā The above statistics only indicate the
direction of departure from complete spatial randomness but donÆt provide a
means for interpreting a process that doesnÆt adhere to this assumption.Ā ĀAn
alternative approach that provided a more effective summary of spatial dependence
over a wider range of scales for second order properties was the ![]() (h) function, which provided a test of
randomness for every distance from the smallest up to the size of the study
area.3,32Ā CrimeStat«Ā was
used for calculating this
function using 100 intervals (radii) by which the statistic was counted based
on an overall radius of approximately 33 miles32.Ā The resulting
(h) function, which provided a test of
randomness for every distance from the smallest up to the size of the study
area.3,32Ā CrimeStat«Ā was
used for calculating this
function using 100 intervals (radii) by which the statistic was counted based
on an overall radius of approximately 33 miles32.Ā The resulting ![]() (h) function was transformed into the square root function (
(h) function was transformed into the square root function (![]() (h) ) and plotted against distance to reveal
whether there was any clustering at certain distances or any dispersion at
others. This transformation is useful to better visualize the function by
making it more linear.3ĀĀ Edge
corrections were not considered in this preliminary analysis.Ā Five hundred
(h) ) and plotted against distance to reveal
whether there was any clustering at certain distances or any dispersion at
others. This transformation is useful to better visualize the function by
making it more linear.3ĀĀ Edge
corrections were not considered in this preliminary analysis.Ā Five hundred
ĀĀĀĀĀĀĀĀĀĀĀĀ These calculations were used for all TB cases, cases stratified by each independent variable described above, and 2000 U.S. Census Population characteristics (fixed at the centroid) for the block group level for comparisons.Ā
Spatial Filtering
Method
The spatial filtering method as
outlined by Rushton41,42 was used also as an exploratory technique
in order to build upon the kernelling methods used earlier.Ā Not only can one view estimated disease rates
based upon extrapolation of individual cases and underlying population to
points on a fine grid, but this method allows for the input of probabilities
for the event in order to generate Monte Carlo simulations of expected rates to
compare with the observed rates and provide a level of significance for the
observed rates.Ā The output is generated
as the proportion of simulated rates that were less than the observed rates,
whereby contour lines can be portrayed on a map that show where this proportion
was low or high.Ā This procedure was used
because it allowed for the data to remain in its original form (N=1480) instead
of being forced to aggregate to a larger area.Ā
The numerator files for this method were all TB cases and cases
stratified by each independent variable described above.Ā The denominator files utilized the 2000
Spatial Scan
Statistical Method
This final method, as outline by
Kulldorff et al.24,29,30,31Ā was
used in order to determine possible cluster areas for TB that were based on
statistical likelihood.Ā Each resulting
cluster of areas would have an assigned p-value and relative risk measurement
to compare to an expected value. For this analysis, the data was broken into
cases (TB cases by genetic print type) and controls (all other TB cases) in
order to determine areas of clustering for specific print types relative to all
TB cases.Ā One of the underlying
assumptions is that shared print types have possible shared contacts.Ā One of these possible contacts is the use of
public transportation.Ā If significant
clusters can be determined for various print types, the actual case points with
bus-route attribute information can be overlaid onto this area and provide a
rationale for checking personal contact information where print type and bus-routes
are identical.Ā For all analysis, a
space-time scan statistical test was used as provided in SaTScanÖ v2.1 in order to adjust for time variations (broken into year intervals,
1996-1998) as well as spatial variations.Ā
The test was set to scan for clusters with both high and low rates and
the underlying coordinates file was based on the centroids of the 2000 U.S.
Census block groups.Ā Three thousand
RESULTS
ĀĀĀĀĀĀĀĀĀĀĀĀ It is not possible to provide examples of all results for the above-mentioned analytical and exploratory methods in this space.Ā Instead, I focus on the complete set of all TB cases and one case subgroup stratified by race (Black) for comparison.
Results from Kernel Estimation
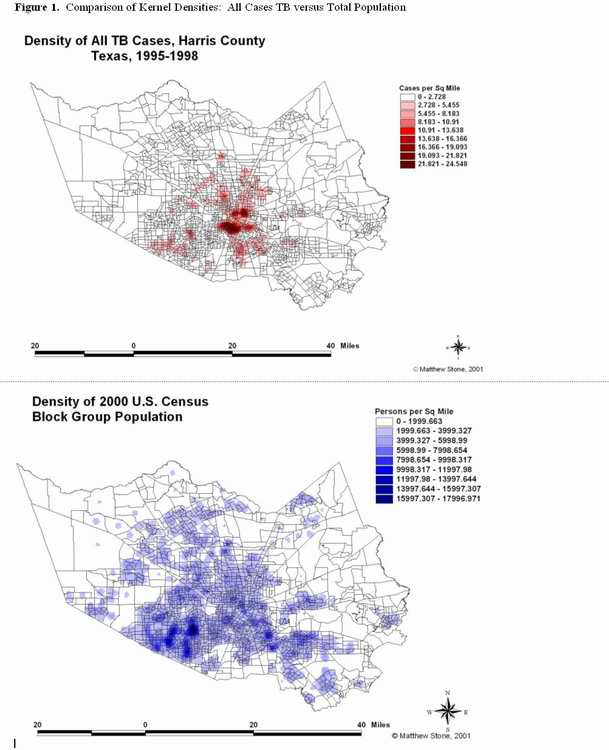
Figure 1 shows the relative density of TB
cases per square mile of area for all cases in comparison to the density of the
2000 U.S. Census Block Group total population.ĀĀ
Figure 2 shows the relative density of Black TB cases per square mile of
area in comparison to the density of the 2000 U.S. Census Block Group Black
population. Upon visual comparison of the images in Figure
1, it appears that the density of TB cases is more focused towards the
geographic center of
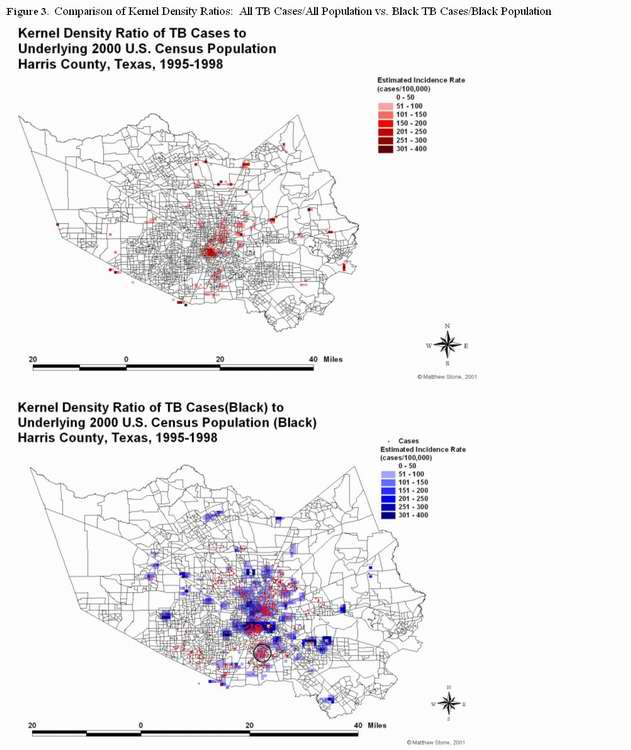
ĀĀĀĀĀĀĀĀĀĀĀĀ When comparing the ratio of total
TB cases to total population, one can see that there seems to be an area of
elevated risk at the center of
Results from Nearest Neighbor Distances
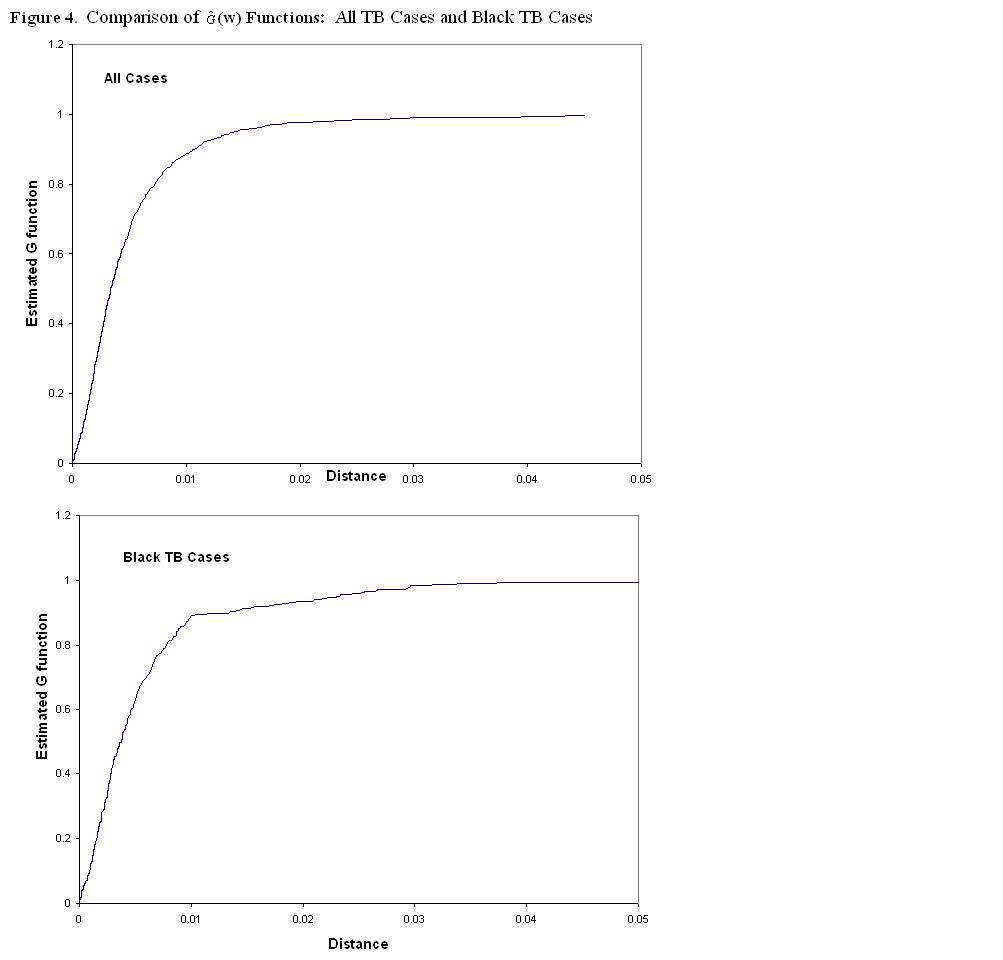
ĀĀĀĀĀĀĀĀĀĀĀĀ The
plots of the ![]() (w) function for all TB cases and Black TB cases can
be seen in Figure 4.Ā On visual inspection, it is clear that there
is relative clustering among all TB cases as evident by the steep rise in the
function at small distances.Ā This trend
is also evident among the Black TB cases. ĀĀPlots of the
(w) function for all TB cases and Black TB cases can
be seen in Figure 4.Ā On visual inspection, it is clear that there
is relative clustering among all TB cases as evident by the steep rise in the
function at small distances.Ā This trend
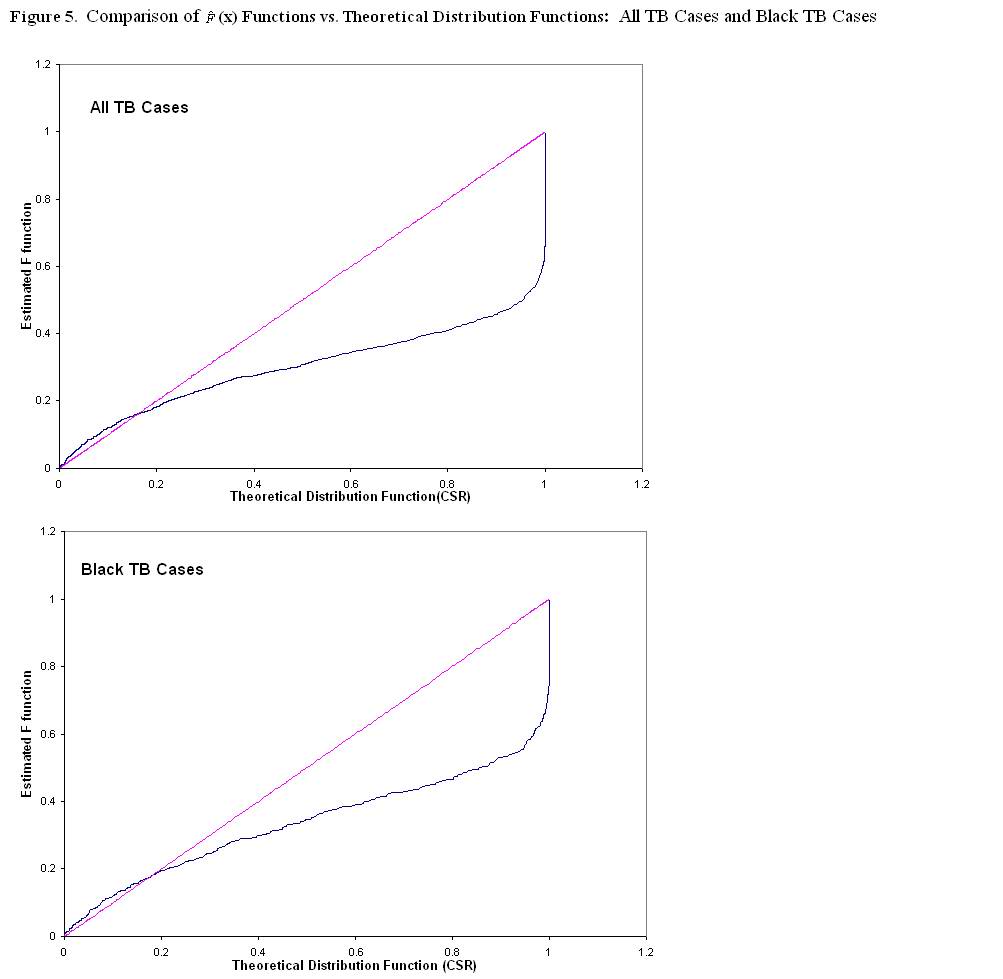
is also evident among the Black TB cases. ĀĀPlots of the ![]() (x) function demonstrated a clustered pattern if the
values for the
(x) function demonstrated a clustered pattern if the
values for the ![]() (x) function varied from the theoretical distribution function
at larger distances.Ā These plots are shown in Figure 5 for all TB cases and Black TB cases. On
visual inspection of Figures 4 and 5, it is evident that there is large variation
between the two functions (theoretical and empirical) for all TB cases and for
Black TB cases.
(x) function varied from the theoretical distribution function
at larger distances.Ā These plots are shown in Figure 5 for all TB cases and Black TB cases. On
visual inspection of Figures 4 and 5, it is evident that there is large variation
between the two functions (theoretical and empirical) for all TB cases and for
Black TB cases.
ĀĀĀĀĀĀĀĀĀĀĀĀ The plots for the ![]() (h) function transformed into the square root function (
(h) function transformed into the square root function (![]() (h) ) for all TB cases and Black TB cases can be
seen in Figure 6.Ā
Notice that there is evidence for clustering at all scales for all TB
cases and is more so than for total population.Ā
Based on the fact that this function lies well outside the simulation
envelopes given, there is some confidence in concluding that the locations of
all TB cases are clustered.Ā Black TB
cases show evidence of clustering up to approximately 12 miles whereby the
function falls steeply.Ā Up to this
distance, Black TB cases appear to be more clustered than Black population and
there is confidence in this conclusion based on the function falling well
outside the simulation envelopes.
(h) ) for all TB cases and Black TB cases can be
seen in Figure 6.Ā
Notice that there is evidence for clustering at all scales for all TB
cases and is more so than for total population.Ā
Based on the fact that this function lies well outside the simulation
envelopes given, there is some confidence in concluding that the locations of
all TB cases are clustered.Ā Black TB
cases show evidence of clustering up to approximately 12 miles whereby the
function falls steeply.Ā Up to this
distance, Black TB cases appear to be more clustered than Black population and
there is confidence in this conclusion based on the function falling well
outside the simulation envelopes.
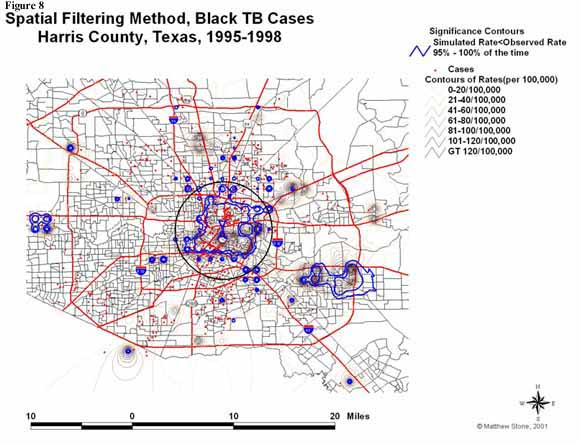
Results from the Spatial
Filtering Method
ĀĀĀĀĀĀĀĀĀĀĀĀ The results from this method for all
TB cases can be seen in the map in Figure 7.Ā Here, the blue isolines indicate where the
highest proportion of simulated TB incidence was lower than the observed
incidence.ĀĀ The 3153 grid point
locations have computed TB incidence rates based on more than 100 persons at
risk (3-year aggregated block level population) within the 1-mile search
radius.Ā Actual case points help to
determine where areas of high rates may be less meaningful (very few cases). ĀThe mean incidence rate that was calculated
for the whole group was equal to 18.72 cases/100,000 population.Ā There is definitely a large area of higher
than average rates running in a North/South direction in the center of
Results from the Spatial
Scan Statistical Method
ĀĀĀĀĀĀĀĀĀĀĀĀ For this method, 9 different print
types were analyzed in order to find a most likely cluster in comparison to
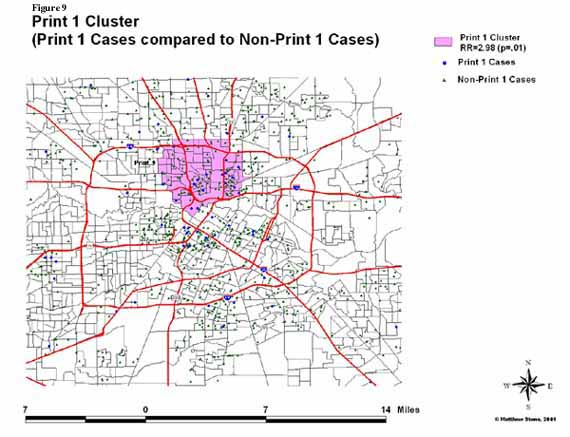
other TB cases.Ā Figures 9 and 10 show two of
these print types and their associated most likely cluster with significance
level.Ā In Figure 9, the map shows that
the most likely cluster for Print Type 1 had an overall incidence nearly 3
times higher than that among all other areas (significant at p=.01).Ā
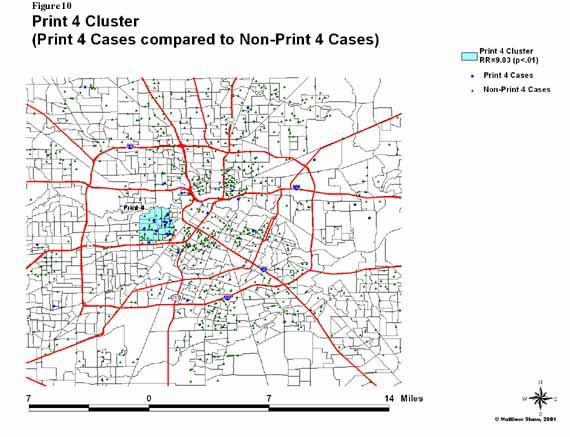
In Figure 10, the map shows that the most
likely cluster for Print Type 4 had an overall incidence approximately 9 times
higher than that among all other areas (significant at p<.01).Ā There is strong
evidence for the existence of these clusters although the exact boundaries of
these clusters are uncertain given the fact that according to the procedure for
this method, there are many overlapping circular windows that will contain the
most likely cluster.Ā In using this
method, however, one is able to take the information on most likely clusters
and characterize the case attributes in order to look for significant
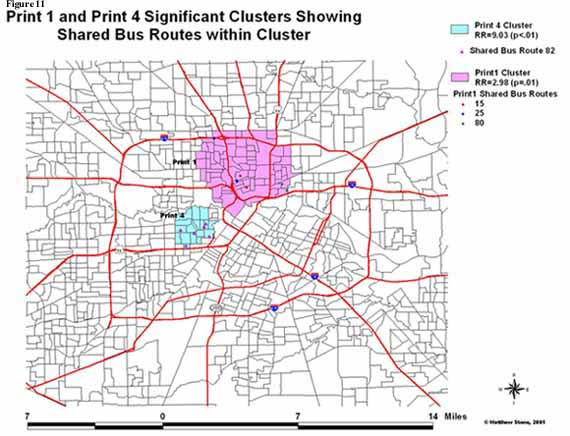
patterns.Ā As mentioned earlier under the
objectives section, one of the possible patterns is characterized by the public
bus routes that may or may not be shared between cases.Ā In Figure 11,
both Print 1 and Print 4 clusters are shown with the cases in each cluster
characterized by their bus route.ĀĀ In
the Print 4 cluster, there were at least 6 individuals who shared the same bus
route (Route 82).Ā In the Print 1
cluster, there were 3 individuals who shared one bus route (Route 25), 2
different individuals who shared another bus route (Route 15), and 2 different
individuals who shared a 3rd bus route (Route 80).Ā
Discussion
ĀĀĀĀĀĀĀĀĀĀĀĀ This
study of cases from a three-year, population-based study of the epidemiology of
tuberculosis in Harris County, Texas, used various spatial analytical methods
to look at the intensity and spatial interactions of TB cases and determine
whether there were significant spatial patterns among cases that may have
deviated from a random pattern.Ā Through
the use of kernel estimation methods it was evident that there were specific
areas in which the intensity of TB cases during the three-year period was high,
even in reference to the underlying population. This allowed for a quick
assessment of potential centers of TB incidence that were stratified by various
risk factors, such as ethnicity, under the assumption that case density would
follow the underlying population distribution instead of a completely spatially
random distribution.Ā On first
glance, it was observed that both the population density and TB case density
among Blacks looked very similar.Ā
However, when controlling for the underlying Black population by using a
ratio method of kernel densities, it was discovered that even within areas of
high Black population density, there were still high TB case density areas
among Blacks.Ā Some may argue with the
necessary assumption of the kernel ratio method used for this study in that the
population values were centered at a specific location (centroids); this is an
obvious limitation of this method.Ā However,
block groups generally contain between
600 and 3,000 people, with an optimum size of 1,500 people.Ā While there still may be variation in a
neighborhood area of this size, the effect of allocating all individuals to a
single point only produces a small error (Levine, personal communication).ĀĀ Another method that could be used for
comparison purposes would be to use another point process that could act as a
surrogate measure of underlying population, (Non-Black TB cases) to be used as
the denominator for the kernel ratio method in much the same way as a
case-control design in epidemiology.3ĀĀ The above finding is notable, however, for
hypothesis generation, when comparing it to an epidemiological study performed
by HTIP (previous to this study) using a similar data set16.Ā That study looked at contributions of certain
risk factors associated with clustering of TB cases (where at least two
individuals had similar genetic print types).Ā
The finding in that study stated that among Blacks, the odds for
clustering was 3 times greater (univariate OR of 3.1) than for Whites.16Ā ĀĀHad the evidence from this study, that the
intensity of TB among Black cases appeared to be high, been available prior to
the HTIP study, one would have had more rationale for including ethnicity in a
multivariate model with an underlying hypothesis that Blacks may be at high
risk for clustering.Ā Additional evidence for possible clustering
among Black TB cases was given in the results of the Nearest Neighbor methods
utilized in this project, most notably the ![]() (h) function analysis.Ā The use of simulation
envelopes under the assumption of spatial randomness allowed one to assess
significant departures of
(h) function analysis.Ā The use of simulation
envelopes under the assumption of spatial randomness allowed one to assess
significant departures of ![]() (h) from its
theoretical value.Ā By providing the same
analysis for the underlying population at risk, one is able to directly compare
the functions and realize that in distances up to approximately 12 miles, there
was a tendency for Black TB cases to show more of a clustering effect than even
Black population.ĀĀ
(h) from its
theoretical value.Ā By providing the same
analysis for the underlying population at risk, one is able to directly compare
the functions and realize that in distances up to approximately 12 miles, there
was a tendency for Black TB cases to show more of a clustering effect than even
Black population.ĀĀ
ĀĀĀĀĀĀĀĀĀĀĀĀ Another extrapolation
technique that served to build upon the kernelling methods used was the Spatial
Filtering method advocated by Rushton42.Ā The added benefit of this technique was the
use of simulation techniques in order to provide a level of significance for
judging the observed relationships.Ā
Again, there was a definite area where relative TB incidence rates for
all cases and relative incidence rates for Black cases appeared quite high.Ā One can feel confident that these areas are
meaningful if viewed under the aegis of exploratory analysis and can lead the
researcher to refine areas for further analysis in the future.Ā Again, one of the limiting factors for this
analytical method is that there was no spatial point pattern for use as the
denominator that took into account the total population at risk.Ā At best was the use of population centroids
at the smallest geographical area available from the U.S. Census Bureau
(blocks).Ā However, the method compares
the observed case rates with a simulated distribution of case rates that
inevitably use the same variance structure of the observed rates42.Ā In addition, previous studies have looked at
using census-based approaches to account for the lack of population and
socio-economic data at the individual level and noted that this approach is
valid and meaningful when the individual-level data is not available.28Ā ĀAs
a means for routine analysis under a surveillance group, one can quickly make
tentative conclusions about the likelihood of case clusters and their
geographic distribution based on sound methodology and follow these conclusions
with the relevant epidemiological analyses42.Ā
ĀĀĀĀĀĀĀĀĀĀĀĀ The spatial scan statistical method29,30,31
was utilized in order to find the most likely clusters based on genetic print
type in comparison to all other TB cases.Ā
The previous analytical methods have tried to show the evidence of
overall clustering but provide no information on where the locations for
potential clustering may occur.Ā The
spatial scan statistical method was an attempt to provide location information
for an observed cluster that is provided with a level of significance based on
a maximum likelihood test.Ā Earlier
analysis16 had identified that the use of public transportation was
a significant risk factor for the clustering of TB cases (multivariate OR of
1.4, p-value = .03).Ā Therefore, it was
assumed that if this spatial method could show, with statistical significance,
the most likely genetic print clusters, one could compare the attribute
information on public transportation for each case found in this cluster to
look for relevant patterns.Ā Four genetic
print types were found to be significant geographic clusters based on comparing
the cases with associated print type (aggregated to Census block groups) with
all other TB cases as the control group (also aggregated to Census block
groups). Among these four clusters, the cohort for Print type 4 geographic
cluster was the same as that observed by previous epidemiological analysis by
HTIP47.Ā Through molecular
characterization and data collected from a standardized questionnaire, and
matched case-control methods, researchers were able to determine that many of
the individuals in this cohort frequented the same social locations (bars), had
similar HIV+ status, had the same ethnic background (White), and had a history
of drug use47.Ā In addition to
these characteristics, it was demonstrated by the current study that at least
six individuals in this geographic cluster alone (out of a total of 7 in the
total cohort of 38) shared the same mode of public transportation (Bus Route
82). ĀĀThis analysis used a space-time
scan statistic that calculated an overall relative risk that takes into
consideration the location and the time of infection (based on the City of
Houston TB control morbidity date) of the specific genetic print type cases
relative to non-print cases.Ā This method
attempts to correct for any faulty assumptions based on the possibility that
all cases occurring in the same time period may bias the overall results.Ā
ĀĀĀĀĀĀĀĀĀĀĀĀ
Conclusions
ĀĀĀĀĀĀĀĀĀĀĀĀ One of the main reasons for performing
this analysis was to show that there is a definite utility in the use of GIS
and spatial analysis in conjunction with epidemiological analyses in public
health.Ā The HTIP group has published
numerous papers on the risk factors associated with TB clustering and developed
novel ways of isolating the threat of increasing incidence rates.16,17,27,43,47Ā This project adds a benefit of performing
another type of analysis that provides the researcher with a meaningful picture
of the disease patterns that can be used in conjunction with output from
epidemiologic studies.Ā However, critics
may be quick to point out that this benefit is also a limitation; the fact that
this current analysis is coming on the heels of prior research findings is no
guarantee that these methods would have steered the research group toward their
findings. This should not hinder, however, the use of spatial analytical
methods in conjunction with epidemiological studies, especially as
hypothesis-generating activities and exploratory exercises useful for planning
future explanatory analyses.Ā The main
focus of this project was to show that the description of spatial patterns in
disease events can lead to important decisions as to where interventions may
need to take place or dollars spent on control efforts.ĀĀ ĀIn
addition, some may recognize the limits of simple univariate point analysis
with the methods used here, preventing one from looking for spatial
relationships that may adjust for a number of covariates together as is done in
traditional epidemiological studies.ĀĀ There
are methods that will analyze multivariate point patterns14, such as
a bivariate ![]() (h) function, that could be
used in the future to look at comparing differences in spatial point patterns
that account for locations of two or more types of events in a study region but
this type of decision should be made by all interested parties involved in the
research tasks, with a variety of analytical and exploratory data for
background comparison.Ā This project
serves to add to that wealth of information already present in
(h) function, that could be
used in the future to look at comparing differences in spatial point patterns
that account for locations of two or more types of events in a study region but
this type of decision should be made by all interested parties involved in the
research tasks, with a variety of analytical and exploratory data for
background comparison.Ā This project
serves to add to that wealth of information already present in
The importance of GIS in health
research has been documented in a large number of articles during the past
decade.Ā Various peer-reviewed journals
have devoted whole issues to the topic of GIS in health research (Journal of
Public Health Mgmt. Vol. 5 Nos. 2,4), spatial analysis (Statistics in
Medicine, Vol.19 Nos. 17,18), as well as, lengthy review articles on both
subjects.36,40Ā There have
even been several books written on the theme of GIS and health, as well as,
exploratory analyses using spatial statistical methods andĀ specialized software/training modules
developed to meet the needs of researchers when stand-alone GIS software is not
enough for more robust statistical analysis purposes.3,18,21,29,32,41Ā The benefits of combining active health
surveillance efforts with systematic collection and display of geographical
information have also been discussed at length.32,34,42 GIS provides a visual component that may
often be lacking in scientific studies that can provide useful information when
combined with sound statistical methods. The ease of incorporating such GIS
systems into already existing database structures in public health departments
and surveillance systems should become the norm in an effort to promote the
timely communication of disease trends to policy makers and the general public.
Acknowledgements
ĀĀĀĀĀĀĀĀĀĀĀĀ This study would not have been possible without the assistance of the Houston Tuberculosis Study and Dr. Edward Graviss, Ph.D, M.P.H. who agreed to let me use the necessary data for this study.Ā
In addition, I would like to thank the researchers Martin Kulldorrf, Ph.D, Ned Levine, Ph.D and Gerard Rushton, Ph.D who responded promptly to my questions about using their software.
References
1.ĀĀ ĀAmerican Thoracic Society.Ā 2000.Ā Diagnostic standards and classification of tuberculosis in adults and children.Ā Am J Respir Crit Care Med. 161: 1376-95.
2ĀĀĀ ĀAtkinson,
P. and Molesworth, A.Ā 2000.Ā Geographical analysis of communicable disease
data.Ā In:Ā P. Elliot; J.C. Wakefield; N.G. Best; D.J.
Briggs (Eds.)Ā Spatial epidemiology:Ā methods and applications. pp. 253-66.Ā
3.ĀĀ ĀBailey, T.C. and Gatrell, A.C.Ā 1995.Ā
Interactive spatial data analysis.Ā
4.ĀĀ ĀBarnes, P.F.; Yang, Z.; Preston-Martin, S.;
Pogoda, J.M.; Jones, B.E.; Otaya, M.; Eisenach, K.D.; Knowles, L.; Harvey, S.;
Cave, M.D.Ā 1997.Ā Patterns of tuberculosis transmission in
central
5.ĀĀ ĀBellin, E.Y.; Fletcher, D.D.; Safyer,
S.M.Ā 1993.Ā Association of tuberculosis infection with
increased time in or admission to the
6ĀĀĀ ĀBernhardsen, T.Ā 1999.Ā
Geographic information systems, an introduction,Ā 2nd edition.
7.ĀĀ ĀBeyers, N.; Gie, R.P.; Zietsman, H.L.;
Kunneke, M.; Hauman, J.; Tatley, M.; Donald, P.R.Ā 1996.Ā
The use of a geographical information system (GIS) to evaluate the
distribution tuberculosis in a high-incidence community.Ā
8.ĀĀ ĀBifani, P.J.; Mathema, B.; Liu, Z.; Moghazeh, S.L.; Shopsin, B.; Templaski, B.; Driscoll, J.;Ā Frothingham, R.; Musser, J.M.; Alcabes, P.; Kreiswirth, B.N.Ā 1999.Ā Identification of a W variant outbreak of Mycobacterium tuberculosis via population-based molecular epidemiology.Ā JAMA.Ā 282(24):Ā 2321-2327.
9.ĀĀ ĀBishai, W.R.; Graham, N.M.H.; Harrington, S.; Pope, D.S.; Hooper, N.; Astemborski, J.; Sheely, L.; Vlahov, D.; Glass, G.E.; Chaisson, R.E. 1998.Ā Molecular and geographic patterns of tuberculosis transmission after 15 years of directly observed therapy.Ā JAMA. 280(19): 1679-1703.
10.Ā Centers for Disease Control and Prevention. 2001.Ā MMWR. 49(Nos. 51&52):1153-76.
11.Ā Centers for Disease Control and Prevention. 2001.ĀĀ Division of Tuberculosis Elimination. (Online). Available: HYPERLINK "http://www.cdc.gov/nchstp/tb/surv/surv.htm" [2001, June 15].
12.Ā Centers for Disease Control and Prevention. 1999.Ā Tuberculosis elimination revisited:Ā obstacles, opportunities, and a renewed commitment.Ā MMWR.Ā 48(No. RR-9): 1-13.
13.Ā Centers for
Disease Control and Prevention. 1990.Ā
Tuberculosis among foreign-born persons entering the
14.Ā Cressie, N.A.C.Ā 1991.Ā
Statistics for spatial data.Ā
15.Ā Daley, C.L.; Small, P.M.; Schecter, G.F.; Schoolnik, G.K.; McAdam, R.A.; Jacobs, W.R.; Hopewell, P.C.Ā 1992.Ā An outbreak of tuberculosis with accelerated progression among persons infected with the human immunodeficiency virus.Ā N Engl J Med.Ā 326: 231-235.
16.Ā De Bruyn, G.; Adams, G.; Teeter L.; Soini, H.; Musser, J.M.; Graviss, E.A. 2001.Ā The contribution of ethnicity to Mycobacterium tuberculosis strain clustering.Ā Int J Tuberc Lung Dis. 5(7): 633-41.
17.Ā El Sahly, H.M.;
Adams, G.J.; Soini, H.;Teeter, L.;Musser, J.M.;Graviss, E.A. 2001.Ā Epidemiologic differences between United States-
and foreign-born tuberculosis patients in
18.Ā Elliot, P.;
19.Ā Environmental Systems Research Institute,
Inc. 1999.Ā ArcView Spatial Analyst
Vers. 1.1,
20.Ā Environmental
Systems Research Institute, Inc. 1998.Ā Atlas
GIS 4.0,
21.Ā Gatrell, A. and L÷yt÷nen, M.Ā 1998.Ā
GIS and health.Ā
22.Ā Geographic Data
Technology, Inc.Ā 2000.Ā Dynamap 1000 Street Network File for
23.Ā Goodchild, M.F.Ā 1987.Ā A spatial analytical perspective on geographical information systems.Ā Int J Geographical Information Systems.Ā 1(4): 327-34.
24.Ā Hjalmars, U.; Kulldorff, M.; Gustafsson, G.;
Nagarwalla, N.Ā 1996.Ā Childhood leukaemia in
25.Ā Jacquez, G.M.
1998.Ā GIS as an enabling
technology.Ā In:Ā A. Gatrell and M. L÷yt÷nen (Eds.) GIS and
health.Ā pp. 17-28.ĀĀ
26.Ā Kleinschmidt,
27.Ā Klovdahl, A.S.; Graviss, E.A.; Yaganehdoost, A.; Ross, M.W.; Wanger, A.; Adams, G.J.; Musser, J.M.Ā 2001.Ā Networks and tuberculosis:Ā an undetected community outbreak involving public places.Ā Soc Sci and Med. 52: 681-694.
28.Ā Krieger, N.Ā 1992.Ā
Overcoming the absence of socioeconomic data in medical records:Ā validation and application of a census-based
methodology.Ā American Journal of Public Health.Ā
82(5):Ā 703-710.
29.Ā Kulldorff, M.;
Rand, K.; Gherman, G.; Williams, G.; DeFrancesco, D. 1998. SaTScan v2.1:
Software for the spatial and space-time scan statistics.
30.Ā Kulldorrf, M.;
Feuer, E.J.; Miller, B.A.; Freedman, L.S.Ā
1997.Ā Breast cancer clusters in
the
31.Ā Kulldorff, M. and Nagarwalla, N.Ā 1995.Ā Spatial disease clusters:Ā detection and inference. ĀStatistics in Medicine.Ā 14:799-810.
32.Ā Levine, N. 2000.
CrimeStat: A Spatial Statistics Program for the Analysis of Crime Incident
Locations (Vers. 1.1).Ā Ned Levine
& Associates,
33.Ā Mathsoft,
Inc.Ā 1999.Ā S-Plus 2000 Professional Release 1.Ā
34.Ā Mayer, J.D.Ā 1983.Ā The role of spatial analysis and geographic data in the detection of disease causation.Ā Soc Sci Med. 17:1213-21.
35.Ā McKenna, M.T.;
McCray, E.; Jones, J.L.; Onorato, I.M.; Castro, K.G. 1998. The fall after the
rise:Ā tuberculosis in the
36.Ā
37.Ā
38.Ā Ormerod, L.P.;
Charlett, A.; Gilham, C.; Darbyshire, J.H.; Watson, J.M.Ā 1998.Ā
Geographical distribution of tuberculosis notifications in national
surveys of
39.Ā Pablos-Mendez, A.; Ravioglinone, M.C.; Laszlo, A. et al.Ā 1998.Ā Global surveillance for antituberculosis-drug resistance, 1994-1997.Ā N Engl J Med.Ā 338:1641-9.
40.Ā Richards, T.B.; Croner, C.M.; Rushton, G.; Brown, C.K.; Fowler, L.Ā 1999.Ā Geographic information systems and public health:Ā mapping the future.Ā Public Health Reports.Ā 114:359-373.
41.Ā Rushton, G.;
Armstrong, M.P.; Lynch, C.; Rohrer, J.Ā
1997.Ā Improving public health through
geographical information systems:Ā an
instructional guide to major concepts and their implementation, vers 2.5.Ā
42.Ā Rushton, G. and Lolonis, P.Ā 1996. Exploratory spatial analysis of birth defect rates in an urban population.Ā Statistics in Medicine.Ā 15: 717-726.
43.Ā Soini, H.; Pan, X.; Teeter, L.; Musser, J.M.; Graviss, E.A.Ā 2001.Ā Transmission dynamics and molecular characterization of Mycobacterium tuberculosis isolates with low copy numbers of IS6110.ĀĀ Journal of Clinical Microbiology.Ā 39(1):Ā 217-221.
44.Ā
45.Ā Whalen, C.; Horsburgh, C.R. Jr., Hom, D.; Lahart, C.; Simberkoff, M.; Ellner, J.Ā 1997.Ā Site of disease and opportunistic infection predict survival in HIV-associated tuberculosis.Ā AIDS.Ā 11: 455-60.
46.Ā Wilkinson, D.
and Tanser, F.Ā 1999.Ā GIS/GPS to document increased access to
community-based treatment for tuberculosis in
47.Ā Yaganehdoost, A., Graviss, E.A.; Ross, M.W.; Adams, G.J.; Ramaswamy, S.; Wanger, A.; Frothingham, R.; Soini, H.; Musser, J.M.Ā 1999.Ā Complex transmission dynamics of clonally related virulentĀ Mycobacterium tuberculosis associated with barhopping by predominantly human immunodeficiency virus-positive gay men.Ā The Journal of Infectious Diseases.Ā 180:Ā 1245-51.
Author Information
Matthew L. Stone
Public Health and GIS Researcher
Center for Health Policy Studies
University of Texas-Houston
1200 Herman Pressler, Suite RAS E929
713-500-9395
713-500-9493(fax)
mstone@sph.uth.tmc.edu