TITLE
Using ArcView and a theory to assess the need of
pre-school children in San Bernardino County:
A Newly
Integrated County Human Services System Looks at Unmet Needs of Young Children
AUTHORS
ABSTRACT
A collaborative approach to identifying needs of
young children in San Bernardino County was developed. Departments providing services to children
identified needs and services delivered. ArcView GIS was used to integrate these
diverse data sources and to identify areas of greatest unmet need within this
large and diverse population.
PAPER
BODY
Counties provide a number of services to improve the health status of children, including public health prenatal and well-baby care visits, behavioral health services for children and parents, financial support and job training for parents, as well as removal of children from dangerous home environments. California counties received even greater support for enhancing the health of young children with the passage of Proposition 10 (Prop. 10), which led to the California Children and Families Act of 1998. Revenue for this act is generated through an additional surtax of $.50 per pack of cigarettes and equivalent increases for other tobacco products. The act also established a state commission and individual, independent county commissions. County commissions, composed of government and community leaders as specified by the act, were established to create a strategic plan and distribute Prop. 10 - generated revenues in accordance with their strategic plans. The act targets families with children prenatal to age 5, and its ultimate goals are to: improve family functioning, improve child learning and school readiness, and improve child health. Eighty percent of the Prop.10 money is allocated to local trust funds set up by each county’s commission. Funds received by each county are proportional to the percent of births recorded within a county. More than $508 million were distributed to the 58 California counties in fiscal year 2000/2001. San Bernardino County received over $27 million of these funds.
Within
San Bernardino, a Southern Californian county of 1.7 million residents, various
health and social service agencies were officially merged in 1999 into a Human
Services System (HSS) consisting of more than 5,800 budgeted positions and a
billion dollar budget. A primary objective of this merger is improved service
delivery. Categorical federal and state funding and privacy regulations hinder
actual integration of the many programs comprising HSS.
Both
the HSS Integration effort and the Prop. 10 Commission intend to coordinate and
better fund services, and a critical element for this success is information.
In fact, the Prop 10 plan called for the county to assume a leadership role in
assessment. Within this milieu, statistical analysts from the three major HSS
departments began meeting, with an emphasis on determining how GIS technology
could be best used to improve the decision-making process. The analysts decided that committing to a
public presentation would be a good way of encouraging each of us to learn
about our combined resources, while also raising the visibility of GIS among
HSS management.
It
was decided that a needs assessment would be the most feasible initial project
to undertake, particularly since GIS could be easily used to present areas
within the county with the greatest need or relatively fewer services. Given
the visibility of Prop 10 efforts within the county and the relative lack of
published local data, we decided to focus on the zero-to-five age group. We
were curious to determine if there really were benefits from combining data
from different departments, for example, to see if each department would find
that the same geographical places had the greatest unmet need.
Theory
Community
planning involving many health and social services would ideally involve
getting feedback from the affected communities. Of course, actually
communicating with residents and service providers can be time consuming and
expensive (Williams and Yanoshik
2001). Even more ideally, information should be presented
in a format that is readily accessible to both local government leaders and the
general public, such as in a report card format. However, creating such
documents is difficult and a serious problem is lack of local data (Fielding, Sutherland et al. 1999). Given these constraints, it seemed reasonable for
our first project to focus only on administrative data actually available to
each of the authors.
A
model was needed to combine such diverse data. At a conceptual level, a health
capital production model, such as the Evans-Stoddart multiple determinants of
health model (shown below) was considered (Halfon,
Inkelas et al. 2000). This model
acknowledges that a variety of factors, including social and physical
environments, individual responses, and the health care system interact in
determining health outcomes. Such a framework could also be used to examine
which factors can be changed by a county system and to estimate how much of an
impact such changes might cause. Below is a brief discussion of the model and
variables considered. The appendix summarizes the final variables that were
mapped. As mentioned, this model was used as a conceptual framework. It is
designed to be used for individuals, however, zip codes are the unit of
analysis in this study.
Multiple Determinants of Health Model
Well-being / Health and Function
As seen in the model, the ultimate
outcome is well-being. However, service systems focus on health and
functioning. Several measures of health
and function were available. From a Prop. 10 perspective, school readiness
would be a major functioning goal. An available measure is the Stanford 9
reading test scores of second graders.
It was assumed that the reading ability of second graders in a school
district would be related to readiness of those beginning Kindergarten and
first grade. More specific health-related outcomes include infant mortality and
foster care placement. Also included are low birth weight deliveries, since
such infants are more likely to die and face increased risks for certain
neurological and developmental problems (Frick 1999). Within this analysis, the available foster care placement data may be of
limited usefulness since the data is for placement location, not the original
home. Child death rates may be included in future analyses.
Social Environment
A major factor contributing to
well-being is the social/family environment in which children live. There were some existing measures not converted to
ArcView layers due to time constraints. Perhaps the most important is mother’s
education, which has been shown to have a large impact upon children’s
outcomes, independent of poverty or social status (Zill 1996). A related measure is marital status. For example, unmarried
mothers are more likely to test positive for alcohol and illicit drugs.
Low-income, single mothers are also at greater risk of abusing their children
(Hall, Sachs et al. 1998).
Among many of the
individuals served by HSS, substance abuse and misuse is a concern. As a
result, HSS must pay special attention to possible impacts upon children.
Nationally, there is great variability in how counties deal with prenatal drug
exposure, including filing criminal charges, assuming custody of the child, or
mandating treatment (Ondersma,
Malcoe et al. 2001). Within San Bernardino County there is a Perinatal
Alcohol and Drug Risk Assessment program (PADRA) that includes a home visit
from a nurse to follow up on newborns suspected of being exposed to alcohol or
drugs. In addition, the Office of Alcohol and Drug Programs (OADP) provides
outpatient and residential treatment. As part of the registration process, OADP
clients are asked if there are children less than three years of age within
their household. Data from both programs can be combined to get a sense of
where perinatal substance abuse is most prevalent.
Physical
Environment
The most notable physical
environment features of San Bernardino County are topographic diversity and
expansiveness. There is an urban valley in the southeastern portion of the
county surrounded by mountains and more than 18,000 square miles of desert.
Within the desert there is a lower level of income. Except for those living in
the one large desert metropolitan area, the desert is known for its access to
care challenges. If further analysis is conducted using regression modeling, it
would be easy to categorize areas by valley/mountain/desert or by urban/rural.
However, in map-based presentations, one can visually distinguish the valley
and desert regions.
Another notable
feature of San Bernardino County, especially the urban valley, is smog. The
area experiences many days of unhealthful air quality, which has been
associated with increased rates of lung cancer among adults and exacerbated conditions among children with
asthma and other lung-related conditions. We are in the process of obtaining
smog data from the Southern California Air Quality Management District for
future analysis. An available measure of the physical environment is the number
of referrals to the Lead Poisoning Prevention Program. Referrals to the
Department of Public Health are based upon blood levels being greater than 10
micrograms per deciliter (mg/dl). Lead is a known neurotoxin, and
children with behavioral and/or developmental problems are more likely to have
blood level concentrations higher than children in the general population
(Lewendon, Kinra et al. 2001).
Genetic Endowment
There is no question that genetic endowment plays a
significant role in health outcomes. Measurement and analysis within a public
health framework is difficult though due to privacy concerns and the expense of
testing. Genetic testing of infants done to date tends to focus on selected
diseases. A scenario recently proposed is that of publicly funded genetic
testing of all babies born in hospitals, with follow up if needed. Under this
scenario, for example, the parents of an infant born with a genetic profile for
severe mental retardation could be contacted days after discharge. Perhaps with
a modified diet and special medications at a very young age, the child could be
spared from such a condition (Smith
2001). At this point we do not have information appropriate
for mapping.
Individual Response
An individual’s response to genetic, social or physical
inputs can be behavioral or biological. This response in turn influences the
health and functioning and disease status of children. It is especially
difficult for county health and social services departments to measure these
responses among the pre-school population since most of their services are
targeted towards the parents or older siblings.
Disease
It is important from a service planning perspective to
understand the prevalence of disease, since disease determines the need for
non-preventive health services. An example of the importance of disease on
health and functioning can be seen when diabetes
potentially impacts school performance if the disease is not managed correctly
and the child misses significant amounts of school (Yu, Kail et al. 2000). However,
one could overlook some population measures of disease by instead looking at Ambulatory
Care Sensitive hospitalizations as discussed below.
At the county level, determining disease rates among
pre-schoolers may be done by looking at utilization rates. This of course may
not be satisfactory if one wants to shift resources to better serve the “real”
need. Mental illnesses provide a good
example of the difficulty of using
disease rates for planning purposes. Researchers estimate that 5 to 8% of
community-based youth have serious emotional disturbance (SED) while as many as
20% have a diagnosis with functional impairment (Garland, Hough et al. 2001). Does that mean that 20% of all kids should receive
mental health treatment every year? This appears to be so far out of reach
compared with existing resources as to be of no benefit for planning purposes.
In practice, most children receiving public mental health services are first
identified by other public systems. It is suggested that as many as 80% of
children in foster care have clinically significant behavioral, emotional
and/or developmental problems. A study of youths in San Diego’s public systems
found that among children aged 6-11, 49% of those diagnosed had ADHD/disruptive
disorders and 12% had anxiety disorders (Garland,
Hough et al. 2001).
One of the most
basic measures of health care access is insurance status (Newacheck, Halfon et al. 2000). Since
entitlement programs (which include Medi-Cal) have already been included, we
used published data for uninsured children under the age of 18. Another common
access measure is the percent of babies who did not receive prenatal care
during their first trimester, particularly since prenatal care is often
associated with better birth outcomes (Frick 1999).
Others have examined
patterns of health care services among toddlers and young children and have
identified prevention, responsiveness and deficit approaches to care. In fact,
associations have been found, “between patterns of service and children’s
development at age five” (Leventhal,
Brooks-Gunn et al. 2000). One way of measuring deficit or perhaps substandard care is by examining
Ambulatory Care Sensitive hospitalizations. These are hospitalizations for
conditions, such as asthma and diabetes, for which appropriate outpatient care
should be sufficient. Hospitalizations are also of concern since they account
for nearly half of child health expenses. Increased discretionary admissions
tend to be greater among those living in the inner cities and reflect greater
morbidity, decreased access to care, and differential provider behavior (McConnochie, Roghmann et al. 1997).
The rate of mental
health services among children may also be considered as an access issues. As
mentioned above, at least 5% of youth have a serious emotional disturbance.
Since the county knows how many children they serve, it is an easy task to
determine the rate of utilization.
Prosperity
Prosperity refers to available resources and as shown in
the model, it influences the social and physical environment in which an
individual lives. In the case of pre-school children, this would refer
primarily to parental resources. One measure may be household income, but we
decided that looking at entitlement programs as a social environment factor was
sufficient for this project.
METHODS
Much of the effort for this
project was focused on identifying databases within each department and working
through the difficulties in data
integration. It was decided early on to use zip codes as the common
denominator, since they are commonly used. Others have noted that, “Zip codes are a cost-effective and robust level of
measurement of social areas.” Within California, the average zip code contains
five times as many people as a census tract, with a statewide median of 35,528
people per zip code (Finch, Vega et
al. 2001). In San Bernardino County there were 82,612 people in
the most populous zip code.
Even summarizing data at the zip code level presented challenges. For
example, the database based on phone call referrals of potential child neglect
cases had a much greater percentage of cases with a missing zip code than the
birth certificate database. Differences in service regions between the various
departments were primarily addressed by looking at individual’s place of
residence, rather than location of service. However, not all data could be
broken out by the individual’s zip code, for example, Stanford 9 data is
organized by school district and
insurance coverage is available by Assembly District. A related issue is differences in service models, with some programs providing
clinic-based services while others were others provide services in homes or the
community at large. One might expect there to be more clients identified close
to clinics, while clients of programs not so reliant on clinics, such as
welfare (TANF) and public health visits (PADRA), would be more geographically
dispersed. Finally, there were differences in counting cases. A unit in one
database might refer to an individual and a unit in another database refers to
a family.
The base map GIS data layers were developed and maintained by the
County’s Geographic Information Management Services (GIMS) office and is in the
California State Plane, Zone 5, NAD 83 coordinate system. GIMS created the
Assembly data layer and School District boundaries based upon census tract
boundaries and legal descriptions, respectively. Both the zip code layer and
the street network data layer used for geocoding are based upon datasets
produced by outside sources, Geographic Data Technology and the Census Bureau,
respectively, though both layers have been constantly upgraded. The
“intersection, select by theme” option was used to apply school district and
assembly district data to zip codes.
Age-specific rates
were calculated by dividing the count data by the age-specific Census 2000 zip
code population. Zip Code Tabulation Areas (ZCTA’s) with the appropriate
summary of age categories, i.e., total 0-4, 0-5, 3-12 or youth population were
used as the denominator.
The
zip codes within each variable indicative of having greater need or highest
risk were generally defined as those having the highest rates. The exceptions
to this are service utilization measures.
For example, lower rates of child behavioral health clients are
considered to indicate higher risk, because children needing services are not
being identified and treated. Using
ArcView GIS software, each data layer was classified into three classes using
the quantile classification type so that the most at-risk third of zip codes
could be identified for each layer.
ArcView’s “select by theme” process was then used to determine where the
most at-risk third of zip codes for different variables coincided.
RESULTS
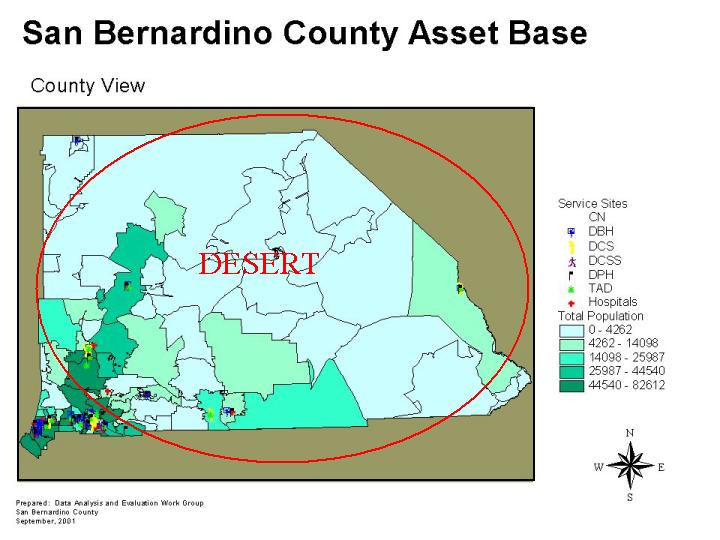
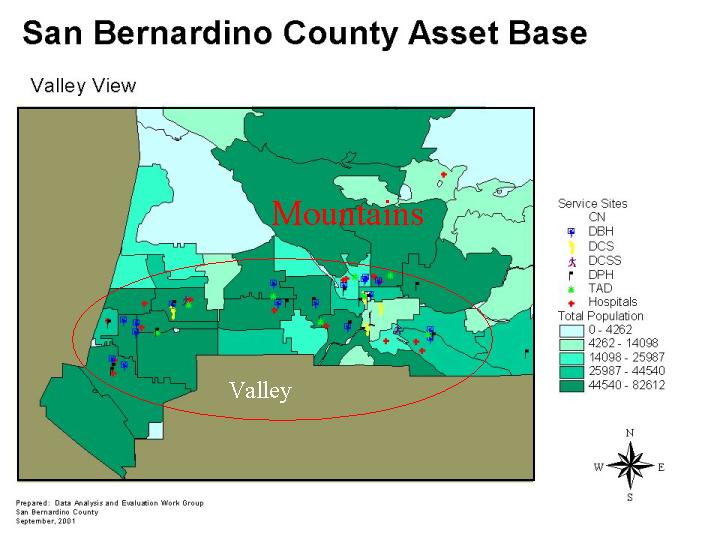
The first two maps
show the distribution of HSS facilities and population density within the
county. The majority of HSS facilities and two thirds of the population are
concentrated in the southeastern corner of the county, though there are a few
pockets of population spread throughout the desert. Descriptions for
departmental acronyms can be found in the appendix.
San Bernardino County Asset Base - Desert
San Bernardino
County Asset Base - Mountains and Valley
The last three few
maps are crude applications of the health model, with variables from at least
two different model elements shown simultaneously. A weakness of this approach
is that with multiple polygons being displayed, a zip code could actually be
high on more than one measure. Only if a zip code is high for all themes in the
map is it shaded as being an overlap.
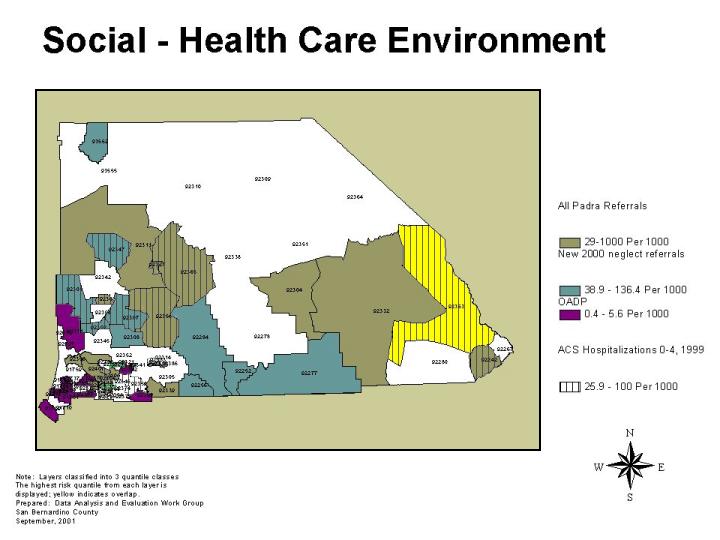
First to be
considered are selected social environment and health care measures. The social
– health care environment map of the entire county is based on the theory that
areas with a greater concentration of parents known to abuse substances and
that areas with more referrals for child abuse and neglect would also be areas
in which more children would be hospitalized for conditions which could have
been prevented with more appropriate medical care. One can see that the
substance abuse (PADRA) and CPS referrals as well as ACS hospitalizations were
most common in the desert, while the rate for clinic-based substance abuse
treatment was higher in the valley. One zip code at the eastern end of the
county scores high among all four variables. This clearly shows that the city
of Needles (population 4,830), which lies next to the Arizona border, could
benefit from more services aimed at strengthening families and assisting
parents of young children.
Social and Health Care Environment
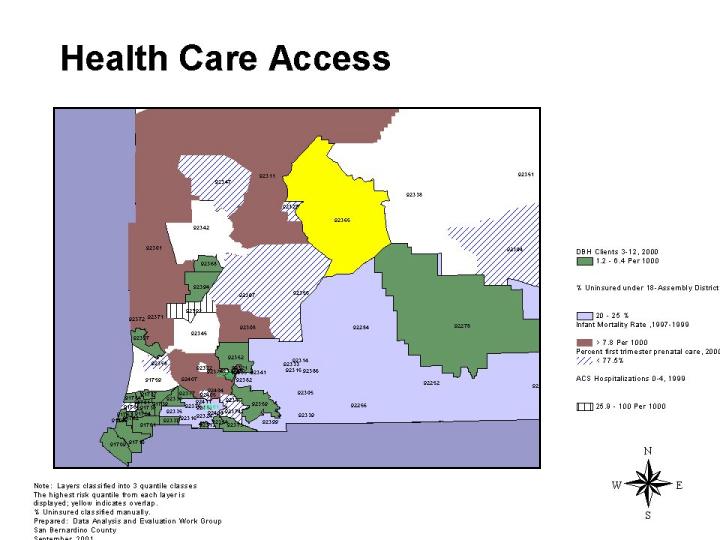
The health care
access map showing the valley, mountains and part of the desert is somewhat
surprising. It shows that children are most likely to be uninsured in what is
called the “low desert” while infant mortality is elevated in the region
referred to as the “high desert.” Zip codes in which mothers were less likely
to receive prenatal care during the first trimester of their pregnancy seem to
somewhat randomly distributed throughout the desert. Not surprisingly, the
areas in which the rate of children receiving mental health services is the
lowest are areas with the largest population. Meanwhile only one zip code in
this map is identified by the health outcome variable of Ambulatory Care
Sensitive hospitalizations. As in the prior map, only one zip code is
identified by intersecting the multiple layers – suggesting a good location for
placing more health care services. However, fewer than 3,000 people live in
that zip code, which is also associated with a military base.
Finally, the poverty and physical environment map focusing on the valley shows that with only one exception, zip codes with high lead referrals are also the zip codes with the greatest percentage of children on welfare. All zip codes with high amounts of lead referrals are also the only zip codes within the valley with the greatest percentage of low birth weight babies. One can also see that with one possible exception, all zip codes with relatively high amounts of children on welfare, referrals for high amounts of blood lead levels or many low birth weight babies are also zip codes in which second graders score low on standardized reading tests. It is possible that doctors in these are more likely to order blood tests than doctors in other areas; but it is also possible that there is an association between poverty, blood lead levels, low birth weight deliveries and low reading scores among these four highlighted zip codes, in the valley and foothills, which encompass several cities and 174,933 individuals. Further study of factors is warranted, perhaps even looking at individual data, since these four zip codes contain 23,036 individuals in the zero to five age range.
Poverty and Physical Environment
Conclusion
Readily available
administrative data can be converted to population-adjusted rates and displayed
in maps that show zip codes with high levels of social need, poor measures of
physical environment, inadequate health care or unsatisfactory outcomes. With
such maps, community leaders may be able to better target available resources.
As analysts from different departments become more familiar with the available
data and a meaningful theoretical framework, they will be able to perform
creative combinations of that data to better assist those who must make
decisions about what services should be offered and where facilities should be
located.
|
MODEL
COMPONENT |
MEASURES
CONSIDERED FOR THIS PROJECT |
SOURCE |
TIME PERIOD |
|
Social |
|
|
|
|
|
Transitional
Assistance to Needy Families (TANF) |
TAD |
2001 |
|
|
Child
Protective Service referrals for abuse or neglect |
DCS |
2000 |
|
|
PADRA (Perinatal Alcohol and Drug Risk
Assessment program Referral Program) |
DPH |
1995-2000 |
|
|
OADP
less than 3 |
DBH |
2000 |
|
Physical
environment |
|
|
|
|
|
Lead
poisoning referrals |
DPH |
1992-2001 |
|
Health
Care |
|
|
|
|
|
%
1st trimester prenatal care |
DPH |
2000 |
|
|
Uninsured
under 18 |
DPH |
2000 |
|
|
Ambulatory
Care Sensitive Hospitalizations, children ages 0-4 |
DPH |
1999 |
|
|
Mental
health, ages 3-12 |
DBH |
2000 |
|
|
|
|
|
|
Outcomes |
|
|
|
|
|
Low
birth weight infants, <2500gm |
DPH |
2000 |
|
|
Infant
mortality |
DPH |
1997-1999 |
|
|
Foster
care placement, ages 0-5 |
DCS |
2001 |
|
|
Stanford
9 reading test |
SCHOOLS |
2000 |
|
|
|
|
|
|
|
|
|
|
|
CN – Children’s Network DBH
- Dept of Behavioral Health |
|
|
|
|
DCS
- Dept. of Children's Services |
|
|
|
|
DCSS
– Dept. of Children’s Support Services DPH
- Dept. of Public Health |
|
|
|
|
TAD
– Transitional Assistance Department |
|
|
|
California Department of Education, DataQuest
(http://data1.cde.ca.gov/dataquest/).
California Department of Health Services, Birth Files,
1997-2000.
California Department of Health Services, Death Files,
1997-1999.
California Office of Statewide Health Planning and
Development, Patient Discharge Data File,
1999.
San Bernardino County:
Human Services System: Department of Behavioral Health
(SIMON database for OADP and mental health data).
San Bernardino County:
Human Services System: Child Protective Services Data (for referrals).
San Bernardino County: Human Services System: Department of Children Services Data
(for
placements).
San Bernardino County: Human Services System: Department of Public Health, Perinatal
Alcohol and
Drug Risk Assessment referral database, and Childhood Lead Poisoning program
Database.
San Bernardino County: Human Services System: Welfare
Directory and the Transitional
Assistance
Department (for TANF).
UCLA Center for Health Policy Research, Uninsured Californians in Congressional
Districts,
2000.
US Census Bureau, 2000 Census of Population and Housing,
Summary File 1 (SF1) for
California.
Fielding, J. E., C. E. Sutherland, et al. (1999).
“Community Health Report Cards: Results of a National Survey.” Am J. Prev
Med 17(1): 79-86.
Finch, B. K., W. A. Vega, et al. (2001). “Substance use
during pregnancy in the state of California, USA.” Social Science &
Medicine 52: 571-583.
Frick, Kevin D. (1999). "Commentary: How Well Do We
Understand the Relationship Between Prenatal Care and Birthweight?" Health
Services Research 34(5):1063-1073.
Garland, A. F., R. L. Hough, et al. (2001). “Prevalence of
Psychiatric Disorders in Youths Across Five Sectors of Care.” J. Am. Acad
Adolesc. Psychiatry 40(4):
409-418.
Halfon, N., M. Inkelas, et al. (2000). “The Health
Development Organization: An Organizational Approach to Achieving Child Health
Development.” The Milbank Quarterly 78(3):
447-497.
Hall, LA, Sachs, B.,
et al. (1998). "Mother's potential for child abuse: the roles of
childhood abuse and social resource." Nurs Res 47(2):87-95.
Leventhal, T., J. Brooks-Gunn, et al. (2000). “Patterns of
Service Use in Preschool Children: Correlates, Consequences and the Role of
Early Intervention.” Child Development 71(3): 802-819.
Lewendon, G., Kinra S., et al. (2001). "Should
children with developmental and behavioral problems be routinely screened for
lead?" Arch Dis Child 85(4):286-288.
McConnochie, K. M., K. J. Roghmann, et al. (1997).
“Socioeconomic variation in the discretionary and mandatory hospitalization of
infants: an ecological analysis.” Pediatrics 99(6): 774-785.
Newacheck, P. W., N. Halfon, et al. (2000). “Commentary:
Monitoring Expanded Health Insurance for Children: Challenges and
Opportunities.” Pediatrics 105(4):
1004-1007.
Ondersma, S. J., L. H. Malcoe, et al. (2001). “Child
protective services' response to prenatal drug exposure: results from a
nationwide survey.” Child Abuse & Neglect 25: 657-668.
Smith, M. (2001). “Life in Genetics: What Happening? Recent Events.” GeneLetter 1(January 2): 12.
Williams, R. L. and K. Yanoshik (2001). “Can You Do A
Community Assessment Without Talking To The Community?” Journal of Community
Health 26(4): 233-247.
Yu, S. L., R. Kail, et al. (2000). “Academic and Social
Experiences of Children With Insulin-Dependent Diabetes Mellitus.” Children's
Health Care 29(3): 189-203.
Zill, N. (1996). “Parental Schooling & Children's
Health.” Public Health Reports 111:
34-43.
AUTHOR INFORMATION
Jim Banta
Managed Care Research Analyst
County of San Bernardino Department of Behavioral Health
700 E. Gilbert St., San Bernardino, CA 92415-0920
(909) 387-7030
(909) 386-8563
jbanta@dbh.co.san-bernardino.ca.us