Hospital
Market Share Analysis Using Publicly Available Data
Evan R. Wolarsky, M.D., M.B.A.
ABSTRACT
Publicly available data for all hospital discharges is available as a result of a dataset originally designed for Medicare billing (UB82). A non-confidential version of this dataset does not allow for identification of individual patients, but does contain a zip code for each discharge, as well as several fields for DRG, diagnoses and procedures, age and sex. By abstracting those records relevant to one hospital’s market area, it was possible to set up a marketing database that included a geographic identifier (zip code).
While there are multiple ways in which the hospital market can be segmented, a study was undertaken to determine the role of patient location in relationship to hospital choice. Using ArcView GIS and the UB82 dataset, a series of maps were done for the market area of Hunterdon Medical Center – a community hospital in Central New Jersey. While this hospital is the only one in Hunterdon County, it is surrounded by several other hospitals that compete for patients.
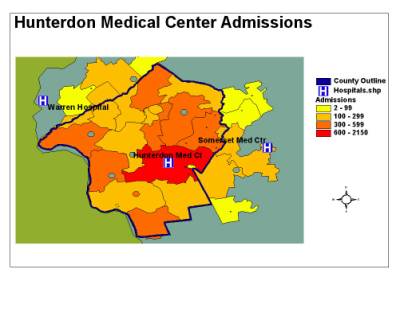
The first set of maps showed admissions to each competitive hospital by zip code thematic map. These maps clearly illustrate the fact that proximity to a hospital is an important factor in hospital admissions.
In order to explore further the relationship between patient location and hospital admission, a multiple linear regression model was done to attempt to predict the number of patients admitted to Hunterdon Medical Center from each zip code by evaluating a variety of independent variables. These included demographic census variables, as well as geographic variables such as distance from Hunterdon Medical Center and distance from the nearest hospital competitor. Finally, the number of primary care physicians from Hunterdon Medical Center in each zip code was included as an independent variable. The model demonstrated with an R-squared of .67 a relationship between hospital admissions and three independent variables – population of each zip code, number of physicians in each zip code, and distance from Hunterdon Medical Center.
Finally, analysis was done to recommend which area would be the best potential location for future marketing efforts. A bivariate map combining population of each zip with outmigration in each zip was used to demonstrate that there was a clear region of the market that combined high population and high outmigration in an area close to Hunterdon Medical Center.
METHOD
UB82 data was purchased from the State of New Jersey. In its non-confidential form, this raw dataset contains fields for each hospital admission in a given year. These include up to nine diagnoses, eight procedures, length of stay, total charges, diagnostic-related group, as well as numerous fields for individual charges. The dataset does not allow for identification of individual patients, but does contain fields for age, sex, and zip code. It is thus possible to build a database of all hospital discharges for a given geographic area by importing this raw dataset into a relational database such as Microsoft Access. It should be noted that in the UB82/92 dataset all text fields are coded, e.g. diagnoses is represented by ICD9 code rather than by a text entry. For this reason, a relational database program is needed to link the UB82 data to individual tables containing all the codes and their corresponding text fields.
After the database is created in the relational database program, queries are then done to obtain the needed information. For example, one of the queries used was a cross-tabulation query. This query asked for a count of hospital discharges per hospital per zip code. The result of the query is a table with a zip code in the every row and a hospital in each column. In this project, each query was exported from Access as a dbf file that was then imported into ArcView GIS. Using the zip code identifier, the query result was then linked both to zip code boundary files and to zip code centroid files. Thus it was possible to create both zip code thematic maps as well as zip code symbol maps.
GEOGRAPHY AND HOSPITAL ADMISSIONS
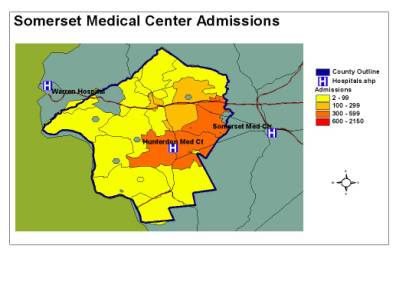
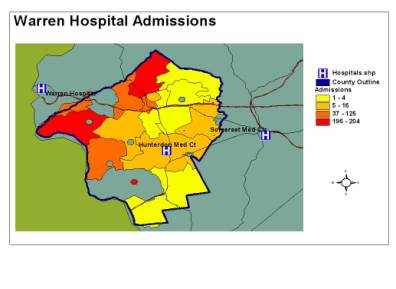
The first zip code thematic map shows admissions to Hunterdon Medical Center. This hospital is portrayed with the hospital symbol in the midst of Hunterdon County. As can be seen by the color scheme, admissions to this hospital are from the entire county, but with greatest numbers in the central area. The next two maps show admissions to the closest two other hospitals and main competitors. Somerset Hospital is located to the east in Somerset County, and Warren Hospital is located to the west in Warren County. In these two maps the relationship of geography to hospital admission is quite clear. Admissions to Somerset Hospital are primarily from the contiguous zip codes in the eastern part of the county, while the opposite is true for Warren Hospital. It can also be seen that there are a series of roads between the eastern zip codes leading directly to Somerset Hospital, while there is only one major road leading to Warren County.
Maps, not shown here, were also done for all the other surrounding hospitals, with similar findings.
LINEAR REGRESSION MODEL
The maps shown above suggest that geography plays an important role in hospital admission. In order to quantify this observation, a multiple linear regression model was built. The basic question was whether variability in a dependent variable, admissions to Hunterdon Medical Center from each zip code, could be explained by variation in a number of independent variables. The independent variables included census variables such as population in each zip code, population over age 65, median income, and median home value. To measure the effect of geography, the distance from each zip code to Hunterdon Medical Center was included, as well as the distance to the nearest competitor. Finally, since primary care access is an important variable, the number of primary care physicians in each zip code was included.
The variables were entered in SPSS statistical software, and the resulting model produced an R-squared of .67 using three of the independent variables. These variables were population in each zip code, distance from Hunterdon Medical Center, and number of physicians. The R-squared indicated that 67% of the variation in admissions could be explained by these three variables.
This analysis is consistent with the work done by Phibbs and Robinson (1983) who evaluated admissions to California hospitals in an attempt to measure market size for the purposes of antitrust analysis. They measured the distance from each zip centroid to each of the hospitals and then examined the relationship between distance and admissions. Their findings showed that 75% of hospital admissions were from a median distance of 7.33 miles and 90% from within 14.00 miles.
FURTHER ANALYSIS
While it is intuitively clear that most people would prefer going to a nearer community hospital than a farther one, further analysis shows the picture to be more complex. In the map below, a thematic map of market share is combined with symbolic markers showing outmigration. While market share is a percentage of cases going to other hospitals for each zip code, outmigration refers to the actual number of cases going elsewhere.
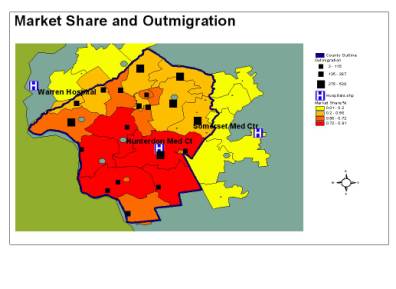
The thematic portion of this map shows that market share is higher in the southern part of the county and uniformly lower in the northern portion. The numbers of admissions to other hospitals, as shown by the black square markers, show that outmigration is greatest in the northeast quadrant. What is interesting, and certainly counterintuitive, is that the zip code with the greatest outmigration is the zip code in which Hunterdon Medical Center resides. While the actual numbers are not shown here, the zip code of Hunterdon Medical Center has both the highest market share and the highest outmigration. The reason for this observation is the fact that zip codes are not of equal size. In fact, the zip code of the hospital is several times the size of most of the other zip codes. Thus it is possible to combine both the highest market share percentage with the highest number of admissions elsewhere.
The question of which variables are important came into focus when it was necessary to recommend locations for future physician offices. Relying on the multiple linear regression model, it was recalled that admissions correlated with those zips with large populations closest to the hospital. For this reason, it was decided to prepare a map combining population of each zip with an overlay of outmigration.
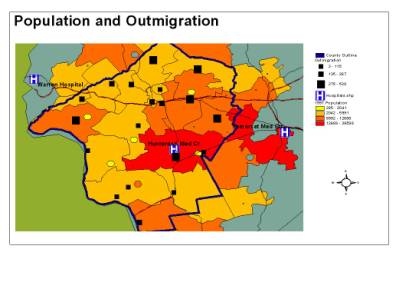
In this map, it is seen that population is greatest in the zip code of the hospital and the zip codes to the north. The black markers indicate that outmigration is greatest in these same zip codes. Thus, a region clearly emerges that is close to the hospital, contains high population, and shows large outmigration. Furthermore, the roads indicate a strategic competitive area between Hunterdon Medical Center and Somerset Hospital contained within several major highways.
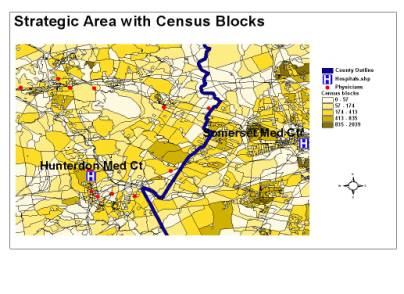
The next map shows this strategic area along with location of physician offices (red dots) and population by census block. This view is shown to indicate that the ultimate product of the model can be a detailed map enabling further planning with an extremely detailed view.
SUMMARY
This paper has shown one application of the use of the publicly available hospital discharge dataset (UB82/92) with geographic information systems to analyze a hospital’s market. After showing a clear relationship graphically between admissions and hospital location, a quantitative model was examined. Finally, concepts of this model were then used to identify future areas of opportunity.
REFERENCES
Phibbs, C.S. & Robinson, J.C. (1993). A Variable-Radius Measure of Local Hospital Market Structure. HSR: Health Services Research, 28:3, 313-324.
AUTHOR
INFORMATION
Evan R. Wolarsky, MD, MBA
Evan R. Wolarsky Consulting
1 Abey Drive, Pennington, NJ 08534
609-737-9197
FAX 609-737-3708
wolarsky@ix.netcom.com