Abstract: Two separate applications, one developed based on the other, have been created for commercial real estate clients. The first is a traditional site evaluation model that assesses any site using the same user-selected criteria at the same time it calculates comparative values for other locations in the same theme. The second application incorporates the Huff model of retail attraction and allows the user greater flexibility to control parameters within this more robust model. The paper takes a comparison approach to discussion of the inputs, results and applications of each.
1. INTRODUCTION
The University of South Carolina participates with the National Space and Aeronautics Administration (NASA) Commercial Remote Sensing Program (CRSP) at the Stennis Space Center in an Affiliate Research Center (ARC) program. This program recruits private sector entities to join with University research interests in demonstrating the commercial uses of remote sensing and related technologies. These demonstrational projects are concisely defined and are generally span two to four months from start to finish. This paper addresses two such projects focused on real estate applications.
Professional Mortgage Company (PMC) of Greenville, SC and Wilson-Kibler (WK) of Columbia, SC focus their respective business on commercial real estate activities. Wilson-Kibler is mid-sized commercial real estate company with property listings throughout several counties in central South Carolina. They have taken a traditional approach to tabulating and marketing their properties thus far. PMC’s scope of operation is much more extensive and they play a more specialized role in the real estate process. They have offices in several southeastern U.S. cities and act as a middleman in the mortgage brokerage process. Each company examines existing or potential sites in order to assess feasibility for particular activities.
2. THE PROJECTS
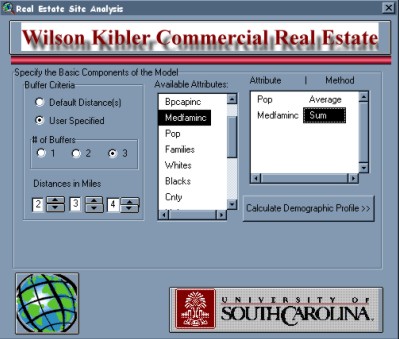
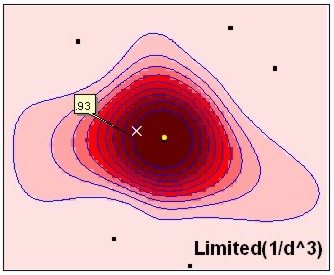
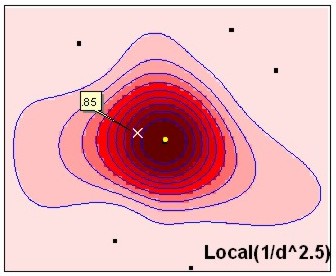
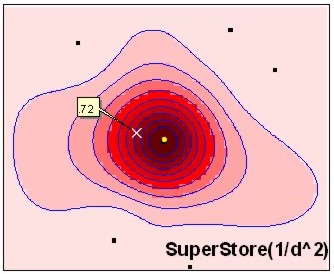
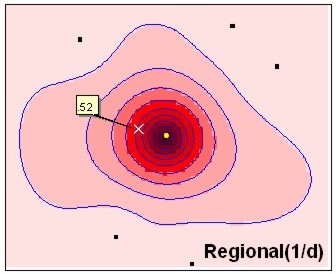
Both applications focus on the site evaluation process. The WK model as implemented answers the question, "How does this site rate compared to other sites or existing businesses?". The PMC implementation further quantifies the need to know, "How many customers (or how much in sales) can I expect at this site given the existing competition?". The primary difference between the two is that the first application (WK) measured market potential based on a defined circular extent of interaction ( range) with the site while the second (PMC) assumed a theoretically limitless probability of interaction. The WK model used a concentric ring (or series of) that defines the range of an activity from which demographic data is extracted. The summary of demographic measures is limited to the distance defined by this range. In the second model a probability surface is generated. While this probability surface exists continuously, the defined range of the service realistically limits it. The dropdown menu for Type of Facility is tied to the four distance decay formulas. Thus the second model (PMC) incorporates the notion of distance decay as one component of calculating market potential. Distance decay can be modified within the interface by changing the exponent on the distance equation: y = 1/d **n , where n can be set to 3, 2.5, 2 and 1 in the model. These exponents equate to the user selection of facility types: limited, local, superstore and regional.
2.1 The Wilson-Kibler Application Overview
This application exemplifies the "use in search of a site" real estate problem. Michael Robbins (1998) coined this terminology and described the other two functions as:
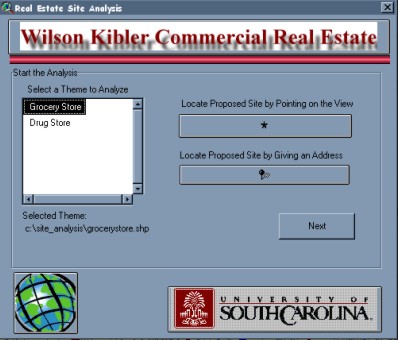
Our WK contacts had no previous GIS exposure and were not handling their property inventories in any computerized central database. Thus the interface was designed to be simple and straightforward. For clients with greater GIS experience or situations where a larger geographic market area was present we might have opted to use Esri’s Business Analyst (data and extension) to address most of the client needs. The WK product used generally available public data from the Census Bureau (TIGER, STF files). Any appropriate theme types that can be added to ArcView are usable by the application.
The WK site evaluation functionality is delivered as a set of Avenue scripts within an ArcView project. These scripts are tied to buttons present within a View. Three new additional buttons/tools provide methods to draw the market rings used in the analysis, clear those rings from the view and generate a pre-formatted layout map of the results. We also removed some of the default view menus, tools and buttons in order to simplify the interface for the client.
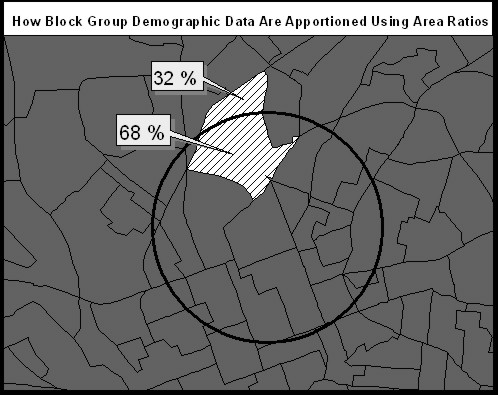
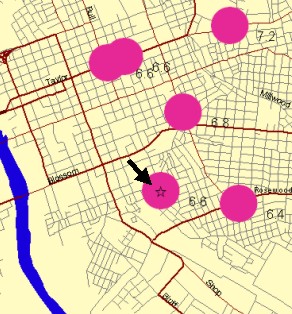
The mechanics of this application lie in the ability to create a buffer (or buffers) around the proposed site and clip from the underlying polygonal demographic theme (block groups) those data contained within the buffer zone. Demographic data are calculated on the basis of the percentage of the area in a given block group that fall inside the buffer zone. Thus if sixty eight percent of the original area of a block group fell inside a buffer zone, that percentage (68) of all interval-type data measures (population, age distributions, number of autos) would be allocated to that feature.
This process is also applied to the buffers created for all other points in the selected theme at the time the procedure is invoked. Wilson-Kibler requested that we deliver the application using the set of chain drug stores and full-service grocery stores in the Columbia (SC) market. Thus if the user indicated that the proposed site is a drug store, the process is run on all drug stores in the selected theme as well as the location of the proposed store.
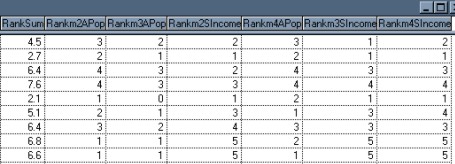
The mechanics of this process are outlined with the following series of graphics and accompanying captions:
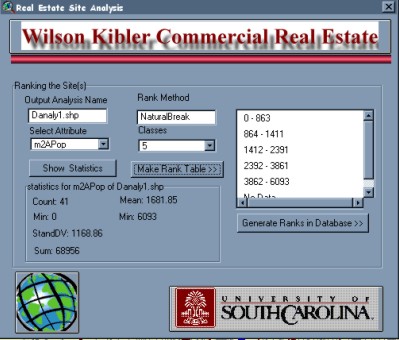
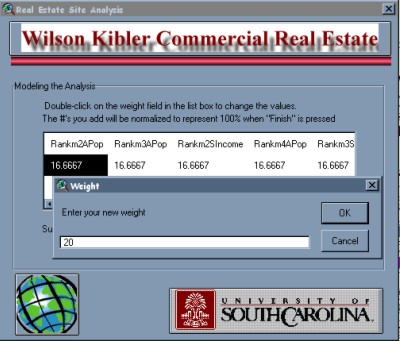
These final scores are then "inflated" so that the range of scores (for all sites in the analysis) will always scale with the highest number being 10. Using this method there will always be at least one location that scores a ten, regardless of how many class intervals the user chooses. Thus other sites can be compared to the "best" site(s) in the market area. Sites are evaluated relative to the competition within the study area and not to some national norms or thresholds.
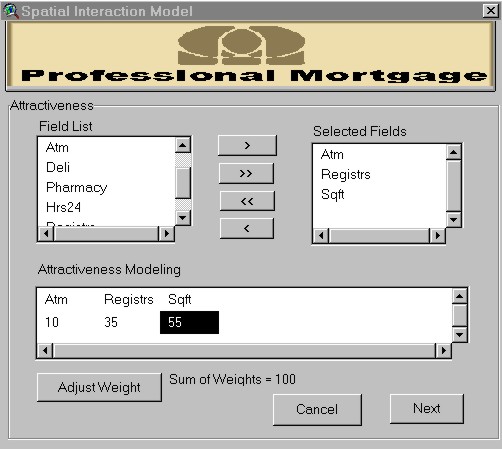
2.2 The PMC Application Overview
The PMC application is based on Reilly’s Law of Retail Gravitation (Reilly, 1931) and the formalization work done by Huff (1963). This model takes into account the perceived attractiveness for a proposed site, the effect that distance (from the site) has on a probability of consumer interaction, as well as competing attractiveness and distance variables for the competition.
Instead of using a market radius to limit demographic calculations, various derivations of the distance decay curve are incorporated into the PMC model. These distance decay curves affect the probabilities of interaction within the study area in order to represent the range of the good or service. Thus the market diminishes gradually, not according to some fixed radius from the site.
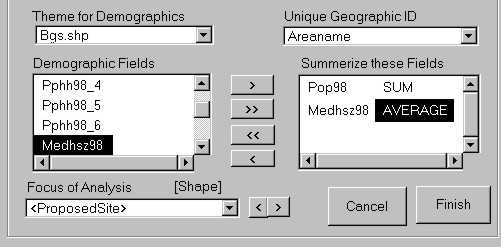
Another fundamental difference between the two applications is the type of conceptual GIS framework used. WK used a basic vector GIS data model, while the PMC model used Esri’s grid-based Spatial Analyst to create its probability surface. The PMC model's cell values incorporate: 1) distance from the site, 2) the variation in distance decay parameters, and 3) the attractiveness of the sites to determine a "probability of interaction" surface. The resulting surface is applied against market and demographic measures from the underlying polygonal areas (e.g. block groups). Thus, any demographic measure added to the model will have summary estimates calculated for it.
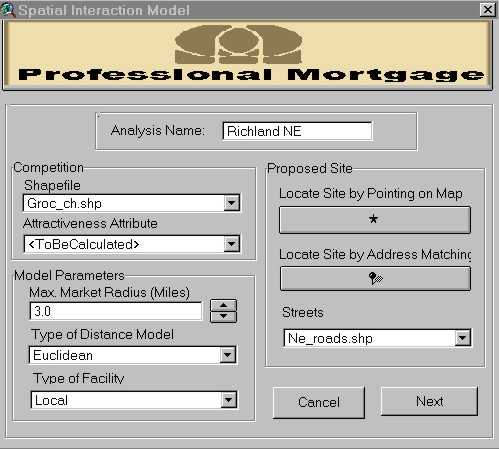
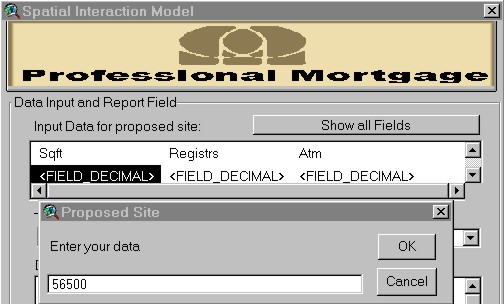
and the demographic data and methods by which it will be used by the probability surface are selected.
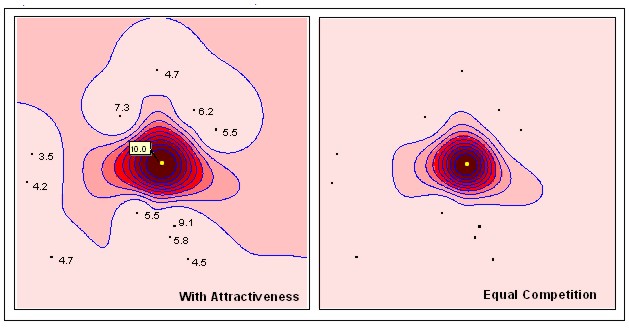
In the maps that follow, the results of modifying several key inputs show the flexibility in this application. Each figure shows one component of the model's results by altering: the attractiveness attributes, the range of the service, and type of distance decay curve used. In each circumstance the other components were held constant.
The ability to set the range of an activity helps to refine any aggregate customer totals this model calculates. Each retail activity knows where its customer base is and what the range of its product or service will be. For the most part, we act as rational consumers and frequent the closest location to purchase a good or receive a service. The probability of traveling to a distant location decreases as distance becomes large. Thus few people will drive 25 miles to a convenience store.
Real world consumer behavior models are often based on the premise that people making consistent, logical decisions. The attractiveness of a store (and its competitors) affects consumer behavior. The ability of this model to derive a single attractiveness attribute from any available measures is an effort to mimic complex, real world consumer behavior. The two resultant maps from the PMC process clearly show that using an non-equal attractiveness measures has an effect on the probabilities generated.
The following four graphics demonstrate the effect of using a different exponent on the distance decay component of the probability model. In these maps the probability value at a fixed cell location changes when various distance decay curves are used (note: .93, .85, .72 and .52). We associated each curve with a different type of customer. Use of the labels "local" or "limited" imply that the activity has a rather compact market area, but attracts a large percentage of all customers within that area. The other two curves, labeled "superstore" and "regional", reflect a situation in which probabilities away from the site are higher, but exclusivity is not so great near the site.
 |
 |
 |
 |
3. SUMMARY
These two projects reflect very different levels of complexity, yet both met the needs of the clients at the time of delivery. From an ArcView perspective, these applications offer the option of analyzing real estate potential in both vector and raster GIS models. The flexibility to include any user data that meets the spatial requirements was a crucial element in the design of the applications. The utility of each application will come only as both companies learn more about their models and parameters, and subsequently refine the mix of inputs that most closely parallels the real world activity they seek to model.
4. ACKNOWLEDGEMENTS
The principal investigators and staff for these projects at the University of South Carolina would like to thank the following: N.A.S.A. for their funding through the Affiliate Research Center program, without which these contributions would not exist, and to Mr. Tommy Thomason, Mr. Denton Burnette (both from Professional Mortgage Company) and Mr. Billy Way (Wilson-Kibler Co.) for their input into developing their respective applications. Much of the theoretical inplementation of the PMC model was based on a Geography master's thesis by Mr. Paul Heimann..5. APPENDIX
The Wilson-Kibler application was delivered as an ArcView project. The project's only dependency is Dialog Designer. The functionality contained in the Project can easily be packaged as an Extension. The PMC deliverable was an ArcView Extension that requires the user also have Spatial Analyst available. The PMC extension also needs Network Analyst if the user selected a "Travel Time" distance model.6. REFERENCES
Heimann, Paul, 1997. unpublished master's thesis "A Spatial Decision Support System for Retail Location Analysis", University of South Carolina, Dept. of Geography.
Huff, David L. , 1963. "A Probabilistic Analysis of Shopping Center Trade Areas", Land Economics, 39: 81-90.
Reilly, W.J., 1931. "The Law of Retail Gravitation", New York: Knickerbocker Press.
Robbins, Michael, 1998. "An Overview and Case Studies in GIS-Based Appraisal." In Castle, Gilbert H., ed. GIS in Real Estate: Integrating, Analyzing, and Presenting Locational Information, Appraisal Institute: Chicago, Il , 206 pp.
Dr. John R. Jensen
Carolina Distinguished Research Professor
Dept. of Geography
Callcott Bldg.
Univ. of South Carolina
Columbia SC 29208
803-777-5790
Email: jrjensen@sc.edu
William Lynn Shirley - contact
GIS Projects Manager
Dept. of Geography
Callcott Bldg.
Univ. of South Carolina
Columbia SC 29208
803-777-4590
Email: lynn@sc.edu
Yingming Zhou
PhD candidate
Dept. of Geography
Callcott Bldg.
Univ. of South Carolina
Columbia SC 29208
Email: zhouy@ellie.cla.sc.edu
Kevin Remington
Campus GIS Coordinator
Dept. of Geography
Callcott Bldg.
Univ. of South Carolina
Columbia SC 29208
803-777-0957
Email: kcr@sc.edu