CUSTOMER SERVICE MONITOR
A Customer Focused GIS Application
For the Water and Sewerage Authority, Trinidad and Tobago
Sharon Ironside
WASA has developed an application, using Map Objects with Delphi, that manages information on their administrative areas, to provide improved customer service. This application uses Wasa’s GIS shapefiles to answer frequently asked questions such as daily water schedules, areas affected by disruption in supply and areas affected due to possible contamination of a water source. Answers to these questions and more are now readily available to the customer.
This paper will discuss the need for the application in WASA; the data capture methods and the benefits gained by the customer and WASA as a result of using the application.
_______________________________________________________________________
Approximately thirteen years ago, GIS concept was introduced to Water and Sewerage Authority (Wasa). GIS in Wasa started out as a Mapping Program in 1987, in an effort to produce updated accurate maps with the infrastructure of the Authority, hence facilitating better management of Wasa’s underground pipeline assets and ultimately improving the level of Wasa’s customer service to the country.
In 1987, however no digital mapping of Trinidad and Tobago was available, thus the Mapping section undertook to digitize the land base maps using various software. The first software that was used was a package called HASP. This software was limited and not very user friendly, as a result a next software package was purchased. The next software used to digitize the land base maps was ACAD. In was not until 1992, however, five years after the Mapping Section had been formulated that the GIS Technology entered Wasa. This occurred through the purchase of PC ArcInfo. This purchase was later followed by the purchase of Unix ArcInfo, which is used up to today. With this investment in GIS technology, the Mapping section later renamed the GIS Section, evolved from a simple mapping unit whose sole function was to collect and digitize maps and infrastructure, to a section that actively assists in the management of Wasa’s infrastructure and in Strategic Planning decisions.
At present, the Wasa’s GIS database consists of many coverages such as: - streets, houses, elevation, contours, water and wastewater infrastructure, cadastre points, Wasa’s administrative boundaries and Wasa’s installations.
GIS Application Development
In an effort to further highlight the usefulness of the GIS technology to the Wasa community, it was decided to design GIS applications for the non-GIS users. It was believed that once the GIS information was made available to the Wasa public in a simple windows driven application, that Wasa employees would begin to use the data in their day to day operations. Through this the reason for the implementation of the GIS would be finally realized. That is, the GIS would facilitate the better management of Wasa’s assets and hence improve the Wasa’s overall productivity and customer service. To date two applications have been formulated for this purpose. These applications are called: - ReGIS and Customer Service Monitor.
ReGIS, Regional GIS was the first application formulated. It was designed to answer frequently asked questions, thus assisting in the day to day operations of WASA field officers. Questions such as main sizes along a specified street, location of Wasa’s installations, the quantity of houses along a specified street and more, could now be quickly answered by a click of a mouse button. This application was well received and extremely successful. It is now an integral part of Wasa’s field officers’ operations.
Our next application was called the Customer Service Monitor (CSM). This application was designed to ensure that information on the various water supply schedules zones in Trinidad and Tobago is readily available. In the rest of this paper, I will discuss the need for the application within Wasa, the data capture methods and the benefits of the application.
Problem
WASA at times operates more than one hundred and fifty water supply boundaries (WSBs) a day. Water supply boundaries (WSBs) are administrative boundaries that were created, taking the following into consideration:
Taking all the above factors into consideration, the WSBs were created to ensure that the water is distributed as efficiently and effectively as possible.
Before the Customer Service Monitor, there were no maps clearly delineating the WSBs. The information on the schedule and the operations of the WSBs were only known by the Wasa’s officers that were actually in charge of the WSBs. Due to this, customers could not quickly obtain information about their WSBs . Information such as their source of water supply as well as their water supply schedule were not readily available. Wasa’s personnel were unable to quickly determine the customers that would be affected in the event, that there was a disruption or a contamination of a water source. The CSM was designed to combat these problems and more.
Data Collection
The need for the CSM was obvious, what was required was a plan detailing how the data would be collected and a description of the required functionality of the CSM. A cross-functional team was created that consisted of GIS, MIS and Operations personnel. The following was the recommended method of the team.
In order to collect data on the WSBs, 1:5000 maps of Trinidad and Tobago were plotted and sent to the WASA field officers that operate the WSBs. These officers were asked to clearly demarcate the WSBs that they were in charge of on the maps as well as detail the operations that were required to activate the each WSBs. The maps were then returned to the GIS section and digitized and tagged by the GIS personnel. MIS personnel entered information on the operations required to activate the WSBs.
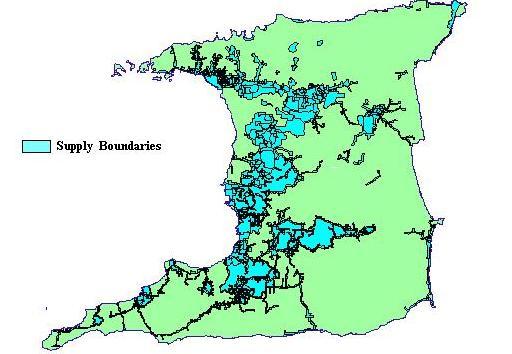
With the WSBs digitized Wasa could now portray on a map the areas in Trinidad and Tobago that receive a water supply from Wasa.
<IMG SRC="P1531.JPG" ALT="Supply Boundaries">
With the WSBs digitized and tagged and the schedule operations entered, the first module of the program could now be completed. By overlaying the WSB coverage with the street coverage, the streets within the WSBs could now be automatically generated. Thus the areas affected due to a disruption in supply or contamination of a water source could now be easily determined. Customers’ schedule per street could now also be automatically generated.
How Does the CSM Work?
Real Time Information
The CSM is designed to collect and give real time information. It is designed to collect data on the day to day operation and determine which schedule have been operated as well as collect information on disruption and determine which areas have been affected.
Input
The CSM is designed to collect two inputs: - real time data on day to day operations and disruption information.
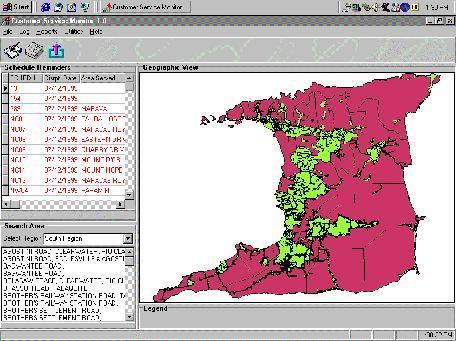
Real time data is collected via the station log. The station log is a module of the CSM that is designed to collect information on specified operations required to activate a schedule.
The operations field officer calls in to the CSM operator and states the operations that he has just completed. The CSM operator then logs in the information and saves it.
Disruptions’ information is collected via the disruption log. The disruption log is a module of the CSM that is designed to collect information on disruptions in water supply. The operations field officer calls in the disruption and the CSM operator logs the information.
<IMG SRC="P1532.JPG" ALT="Station Log">

Processing
Every five minutes, the CSM is programmed to check the station and disruption logged information, compare the information with static schedule data and determine which schedules have been or have not been activated/operated as well as which schedule will be affected due to the disruption.
Output
The CSM has two major output facilities: - window display and reports.
After the CSM has determine which schedules have been operated and which have not been operated, reminders indicating which the schedules that have not been operated will be listed in red on the display screen and disruption notices will be tagged to each schedule affected by the disruption. This will be highlighted whenever a query is made on that schedule.
Customized reports on the customer schedule; class of supply and schedules that have not been operated for a day can also be generated
Results and Benefits of the CSM
The CSM facilitates a wider distribution of schedule information. It allows:
Wasa’s internal and external customers are now offered a facility in which then can now call in to the CSM center to find out or obtain real time information on their schedules, whether or not their schedules have been operated and the reason for the schedule not being operated. Information such as schedules that have been disrupted, the projected time frame of the disruption and the corrective measures that have been put in place, due to the disruption, can now be easily obtained
The CSM has many other benefits as well. Customers could now be informed, on a timely basis, of the availability of a water supply in the area in which the live, work and recreate. Information is now readily available that will assists the decision-makers in formulating a Replacement Maintenance Plan by quantifying the disruptions logged recommendations could be made on dilapidated infrastructure. Reports can also now be easily generated for the board of management on schedules, disruption frequencies, percentages of WASA customers affected by disruption. Information gathered by the CSM could now used to be easily determine the class of water supply that customers in Trinidad and Tobago receive on a daily basis. Improvement in customer service with respect to water supply can now also be easily quantified. The benefit so the CSM when fully implemented is insurmountable.
Existing Situation
A pilot program has been launched in the North of Trinidad. The feedback has been invaluable. The feedback is being used to cleanup and update the WSBs and the schedule operations data. Due to the feedback as well as the application is being customized to more effectively meet the needs of the customer.
CONCLUSION
In the end we believe that this application will greatly improve:
Hence the overall productivity of WASA. Our next step is enterprise wide GIS Integration. We believe that applications such as the CSM are required in all Water Utilities. GIS continues to offer new innovation in the Water Utility Sector.
_______________________________________________________________________
Sharon Ironside
Senior Engineer GIS
Water and Sewerage Authority
Farm Road St. Joseph
Trinidad W.I.