
Degradation of vegetation as a result of training activities is a significant issue on many military installations. Environmental managers at Ft. Carson, Colorado are involved in an evaluation of techniques for monitoring changes in vegetative health on lands used for military training exercises. Methodologies being investigated range from field oriented data collection to the exploitation of remotely sensed imagery. This paper presents the results of a study that addresses this issue through the use of a combination of satellite imagery and small to medium scale color aerial photography.
Introduction
The Fort Carson Military Reservation is an active military training base located at the base of the front range of the Rocky Mountains near Colorado Springs, Colorado. Ft. Carson is home to the 3rd Armored Cavalry Regiment and the 1st Infantry Division. This installation is a very large landholder most of which is actively used for training maneuvers for both infantry and armored exercises. In recent years a growing concern has centered on the effect that continuous armored training exercises is having on the health of ecosystems within the reservation. Armored vehicles typically move along the edge of brushy and wooded areas in an attempt to maximize concealment. It is hypothesized that this traffic pattern has resulted in a retreating brush and tree line throughout training areas within the reservation. Natural resources managers are currently involved in a multi-temporal assessment of the changes in vegetative growth patterns associated with training activities.
Change detection and mapping using remotely sensed imagery provides a valuable environmental monitoring and management tool (USGS: Science for a Changing World). This is a process that involves the use of multi-temporal data sets to discriminate areas of land cover change between dates of imaging (Lillesand and Kiefer, 1994). The basic objective is the detection of actual changes from one time to another, but other objectives may be included. For example, the nature of the changes occurring, the extent of changes, and the spatial patterns of change may also be of interest. When using remotely sensed imagery it is important to minimize the effects of the angle of incidence of incoming energy and fluctuating environmental conditions associated with seasonal changes. Therefore, it is recommended that the imagery being used be acquired by the same (or similar) sensor, recorded with the same spatial resolution, viewing geometry, spectral bandwidths. Remotely sensed imagery has been used in a variety of disciplines interested in monitoring change in vegetative growth patterns (Sader, 1995).
Goals and Objectives
The overall goal of this project was to assess the changes in the distribution of vegetation within a military training area occurring between 1992 to 1998. Specific objectives included: 1) detect and map specific changes in the distribution of vegetation; 2) utilize multi-temporal remotely sensed imagery to accomplish this mapping; and, 3) to quantify the changes in terms of acreage lost or gained.
Study Site
The California Strip training area within the Ft. Carson military reservation was selected as the study site for this effort. This training area has been utilized for both mechanized and infantry exercises. Beginning in 1992, and continuing to the present time, vehicular travel has been restricted to existing roads and staging areas. Natural resources managers have been monitoring changing vegetative patterns resulting from this controlled training using permanent field plots. Until this project was initiated no effort had been made to conduct a "wall-to-wall" assessment of the changes in the distribution of vegetation throughout the study site.
Methodology
Remotely sensed imagery utilized in this project came from two separate organizations. Color infrared (CIR) aerial photography acquired as part of the National Aerial Photography Program (NAPP) was provided by Department of Environmental Conservation and Management (DECAM) organization at Ft. Carson. This imagery was taken on July 14, 1992. The Remote Sensing Branch of US Army Space Command, Colorado Springs, Colorado Springs, provided Landsat Thematic Mapper imagery of the study site collected on June 29, 1998.
The CIR aerial photographs, ten individual photos, were scanned with the resulting image files having pixel dimensions of one metre square. Each of these files was later resampled to a five-metre grid due to the disparity in image resolutions between the photography and the Landsat TM imagery. A seamless photo mosaic was generated from these image files using ERDAS Imagine (Figure 1) Georectification to a UTM coordinate system followed the process of mosaicing. A subset of data encompassing the California Strip training area was extracted from the mosaic for further analysis.
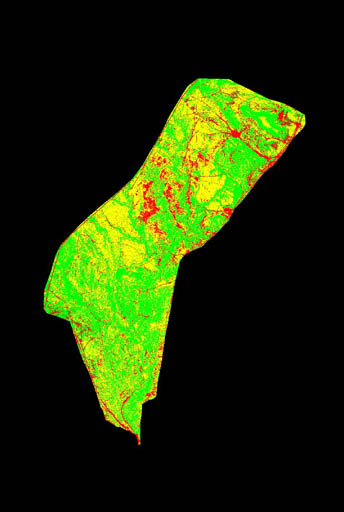
An unsupervised clustering algorithm was applied to the single band CIR photo mosaic. This technique attempts to identify naturally occurring groupings, or clusters, of pixels present within an image data set. Fifteen distinct clusters of data were identified by the algorithm within the image data for the California Strip. A stratified random sample of sites occurring within each of the fifteen data clusters were visited in the field. As each site was visited it was assigned to one of three vegetation cover types (bare soil, grass, brush and trees). This data was compiled for all sites representing a data cluster and used to determine the predominant vegetation type for that cluster. A final classified image for the training area was derived by re-coding the cluster pixel values such that all pixels occurring within clusters determined to be bare soil were given a value of one, pixels in clusters representing grass were given a value of 2, and pixels representing brush and trees were given a value of three. The classified image data corresponding only to the California Strip training area were then extracted and saved as a separate image file (Figure 2).
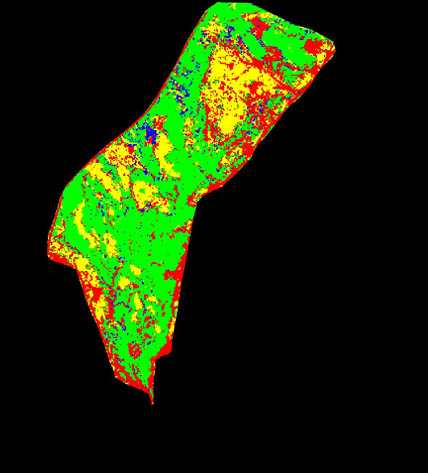
The Landsat TM scene was georectified to the same UTM coordinate system that was used in the rectification of the NAPP CIR photo mosaic. The data were also resampled to a five-metre pixel resolution to correspond to that of the photo mosaic as well. A subset of data encompassing the California Strip was extracted from the georectified and resampled full Landsat TM scene. An unsupervised clustering algorithm was applied to the six bands (three visible and three reflective infrared wavebands) as was done to the photo mosaic data. Twenty-seven distinct clusters of data were identified within this subset of the Landsat TM scene. As with the clustered photo mosaic data a stratified random sample of sites were selected from each cluster of data for field verification. This field data set was used to determine the predominant identity of each data cluster. Data clusters were then re-coded using the same numbering scheme as was used with the classified NAPP CIR photo mosaic. The classified Landsat TM image data corresponding to the California Strip training area were then extracted and saved as a separate image file (Figure 3).
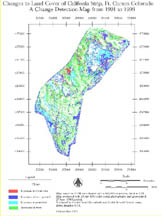
A change detection map was generated through a digital comparison of the two classified images (Figure 4). This map shows changes in vegetation types occurring throughout the study site between 1992 and 1998. Six different changes could have occurred during this time period:
Grass to Bare Soil
Grass to Brush and Trees
Bare Soil to Grass
Bare Soil to Brush and Trees
Brush and Trees to Grass
Brush and Trees to Bare Soil
Results and Conclusions
Table 1 lists the changes in vegetative cover (in hectares) occurring in the California Strip between 1992 and 1998. The columns in this table represent vegetation categories in 1992 while the rows represent vegetation categories in 1998. The figures in the table represent the number of hectares that changed from one vegetation category to another from 1992 to 1998. For example, the 305 in the Grass column and Bare Soil row cell can be interpreted as 305 hectares of grass in 1992 were determined to have changed to bare soil in 1998.
|
|
Bare Soil |
Grass |
Brush & Trees |
|
Bare Soil |
186 |
305 |
190 |
|
Grass |
68 |
354 |
167 |
|
Brush & Trees |
122 |
573 |
829 |
As can be seen from Table 1 190 hectares that were brush and trees in 1992 were found to be bare soil in 1998. An investigation of the two classified image files clearly shows that these changes have occurred in those areas where brush and trees are found next to existing vehicle paths. This verifies the concerns of the DECAM managers regarding the receding brush and tree line within this training area. An additional 122 acres of brush and trees were found to have been converted from bare soil between 1992 and 1998. Field investigations of these sites demonstrated that these changes occurred away from the main traffic patterns in areas where vehicle access has been restricted. In all of these instances the change in land cover was found to have been from bare soil to grass and brush with brush being the predominant vegetative cover. This indicates that if vehicular traffic were restricted throughout the training area then the brush and tree line would begin to re-assert themselves. Of course, this would negate the primary utilization of the land as a military training facility.
The results seem to confirm the concerns of DECAM managers regarding recessions in brush and tree lines as a function of vehicular traffic patterns on training areas. However, it is also apparent that given the chance that the vegetation has the capability of re-establishing itself on these sites. The difficulty is in trying to balance the long-term health of the ecosystem with the requirements for military training exercises.
Acknowledgements
This work was funded and supported through the Remote Sensing Branch, Army Space Command, Colorado Springs, Colorado. The authors would especially like to thank MAJ Robert Dunaway, director of the Remote Sensing Branch, Army Space Command for his support and encouragement throughout this project.
References
Lillesand, M., and R. W. Kiefer. Remote Sensing and Image Interpretation. New York: John Wiley and Sons, Inc., 1994, 621 p.
Sader, Steven. 1995. Spatial characteristics of forest clearing and vegetation regrowth as detected by Landsat Thematic Mapper imagery. Photogrammetric Engineering and Remote Sensing, Vol. 61, No. 9, 1145-1152.
USGS: Science for a Changing World. Change Detection. [On line] available from http://terraweb.wr.usgs.gov/TRS/projects/eolian/chngdetc.html. Internet.
Russell Nowells, 2nd LT
David Dyrenforth, 2nd LT
Geospatial Information Science Program
Dept. of Geography and Environmental Engineering
United States Military Academy
West Pt. NY 10996
Dale Manry, CPT
Instructor of Geospatial Information Science
Dept. of Geography & Environmental Engineering
United States Military Academy
Phone: (914) 938-3161
Fax: (914) 938-3339
Email: bd1408@usma.edu
John Brockhaus, Ph.D.
Associate Professor and Director
Geospatial Information Science Program
Dept. of Geography and Environmental Engineering
United States Military Academy
West Pt., NY 10996
Phone: (914) 938-2063
Fax: (914) 938-3339
Email: bj9296@usma.edu