Phase I
On January of 1999, the director of Texas Centers came to me
with a project he wanted me to work on. The project was to create a interactive
prototype of an industrial park in El Paso, Texas. Earlier in the year a
student had attempted to do this project in Visual Basic, but did not complete
it.
I had a deadline for my project and I did not have any idea
where or how to begin. My supervisor suggested that I draw a story board of my
plans for realizing this interactive project.Ā
When I made the drawings they looked like the drawings of a 7 year-old,
but they actually turned out to be the primitive form of the future
Northwestern Industrial Park prototype.Ā
How was I going to start this project?Ā I began investigating software applications
that I could use for the prototype.Ā I
looked at Visual Basic, but decided that it was too limited in scope to create
the type of product we wanted.Ā It was
at that time that Bob Gray, the Information Technologies Coordinator of Texas
Centers, introduced me to Esri GIS software.Ā
I started attending ArcView training sessions in my department which
were based on an ArcView tutorial.Ā
After the training, IĀ started
using GIS software formally and decided that this was going to be the main
software tool for my project.ĀĀ
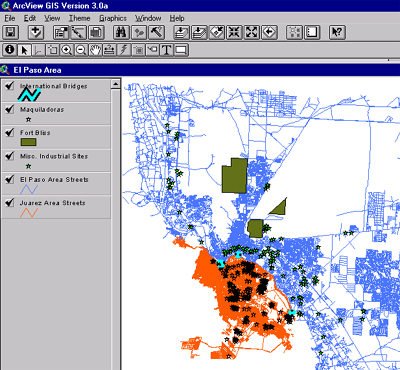
Through Bob Gray and the GIS database he had created, I had access to a base map of El Paso / Juarez with a number of different themes,
like streets, businesses, airports, etc.ĀĀ
I had maps with Information on the area, but I still did not have any
industrial parks on my maps.
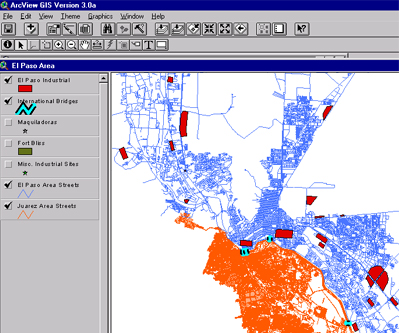
By that time I was beginning to know more about ArcView and its potential. I drew polygons of the industrial parks on my base map.Ā By doing so, a database was created for each
industrial park. I was very happy because I now I had industrial parks on my
map but I still had a deadline and needed a working prototype. Then by
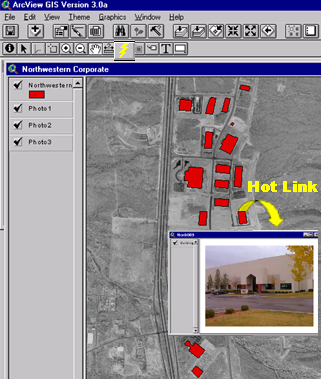
coincidence, I saw some people working with aerial photos of El Paso, and the
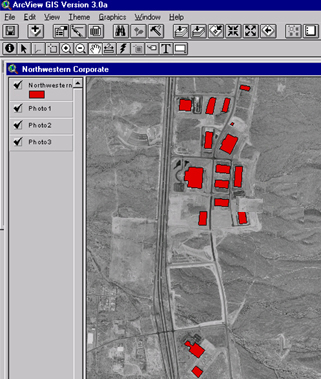
idea came to me to use them for my prototype. I added an aerial photo of the
Northwestern Industrial Park to the Arcview project and drewĀ polygons of the buildings in the park on top
of the aerial.
There was only one problem left; I did not know how to put all of my information together. I was told I
could probably find my answer on the Arcview tutorial I used in the
beginning.Ā I went through the tutorial
again searching for an answer, and, to my surprise, I found what I was looking
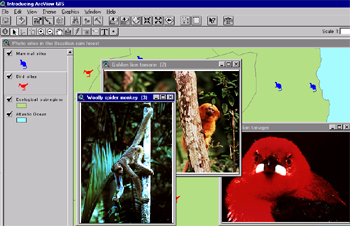
for.Ā It was an example of an Brazilian
project that provided information on animals that lived in each region of the
country.Ā By using the hot link button
you could extract photographs of the animals from the project database.Ā I remember pulling out photographs of
koalas, parrots and monkeys. This was exactly what I needed to link the base
map, aerial photo and building information on the prototype.
When it was complete, Kristi Borden saw the prototype of this industrial park and saw a great opportunity.
She believed it could be the basis for a real estate database project for the
area. In discussing the projectÆs potential we came up with the idea that,
since El Paso is on the border with Juarez, Mexico, our project could provide
information across the U.S. ¢ Mexico boundaries. We had maps of Juarez and
information on manufacturers and miscellaneous industries on both sides of the
border. Putting all of the international information together, the project
started to become very interesting and more attractive. She believed that the
project should go on the internet and that a variety of users would be able to
access and use the information. To accomplish this, we needed more members for
the team.Ā It was then that we talked to
the webmaster at Texas Centers, Perla Magallon.Ā Perla was an undergraduate student at the time, with a major in
Computer Science.Ā She was the person
who would be responsible for placing the project on the web.
Phase II