Abstract: KEA Environmental, Inc. is an interdisciplinary environmental consulting firm headquartered in downtown San Diego. A vital aspect of our expertise is environmental compliance. After a project has undergone rigorous environmental planning, review, and obtained the necessary permits, the next step can be precarious. Often during project implementation, the final design can differ from the original design that was approved for construction. However large or small, these excursions can lead to additional environmental impacts and schedule delays. The final design process can be successfully monitored using the functionality of ArcView combined with CADD to measure and evaluate the impacts of changes to a project's footprint.
Field surveys, literature searches, state-of-the-art analyses, predictive modeling, best management practices, public and agency review, well-structured environmental law, and sound regulatory guidelines are not good enough . . . even though these efforts represent the best procedures available during the environmental planning process.1 Despite best intentions, an unfortunate truth remains: in the environmental planning field, planning does not track with reality. It can be close . . . very close, but not exact. Even with the most artful, accurate, and diligent application of data using sophisticated technological tools such as a geographic information system (GIS), environmental planning efforts can often be inadequate predictors of real circumstances.
Why? Because there is a propensity to color outside the lines!
The analogy "coloring outside the lines" is meant to illustrate a situation that has persisted in the environmental planning field for about 30 years -- since the advent of the National Environmental Policy Act (NEPA) in 1969 and the California Environmental Quality Act (CEQA) in 1970. Specifically, the situation arises from the fact that environmental planning is traditionally based on a preliminary2 project design. While it is reasonable and necessary to use this level of information for environmental planning, changes are inevitable as the project design evolves from preliminary to final.
If change is inevitable, does this infer that any such change represents an excursion from the premise upon which the project was approved? Are the agencies and regulators who approved the project concerned about these changes? Should these changes be identified and assessed to determine if they are significant?3 Should there be a mechanism to monitor these changes? Resoundingly, the answer is "yes!"
The importance of monitoring these changes is tied to environmental law. CEQA Guidelines (at Section 15162) require that all changes to an approved project be evaluated by the lead agency to determine their significance.4
In addition, the terms and conditions of most environmental permits typically require that a permit-holder notify the permitting agency when the construction or operation of a project deviates from the commitments made to an agency when the permit was obtained. These commitments can include, for example, limiting the total disturbance to certain sensitive habitats (such as coastal sage scrub) to a specified number of acres or avoiding jurisdictional wetlands wherever possible.
In the past, from 1970 through 1988, there was a credibility problem in the implementation of mitigation measures for a project approved under CEQA. While some project owners were quite diligent, loopholes in the Act were being exploited by other owners, who tended to initiate fairly major project design changes during the construction phase without regard for associated impact-avoidance requirements. There were no legal procedures in place requiring that change be monitored; for that matter, there was no vehicle to assure that all of the commitments made to reduce impacts below the level of significance were actually being implemented. Thus, for many years, there was no assurance that the project approved and permitted for construction by responsible agencies was the same project that would be constructed by the project owner, or that the terms and conditions stipulated in agency permits would be followed.
With the passage of Assembly Bill (AB) 3180 in 1988 (effective January 1, 1989), this loophole was closed. AB 3180 imposed a requirement for agencies to monitor each approved project to assure that all commitments made to mitigate for significant impacts were actually implemented. This requirement, together with the CEQA requirement to monitor project changes, provides ample leverage to assure that an approved project is either implemented as approved or is monitored to the extent that project changes can be identified and evaluated. But, how are these changes to be monitored? What is the best way to record the areal extent and effects of a change in design?
One technique for monitoring project change -- change between the planned design and actual implementation of a project -- has been developed by the authors on a major project being undertaken by the San Diego County Water Authority.5
Essentially, the technique involves the use of existing geo-referenced information and the functionality of ArcView to complete the following steps, as shown in Figure 1: provide an initial description of preconstruction (baseline) site conditions; identify change and update baseline conditions as new data become available; evaluate the effects of change; develop appropriate strategies for addressing specific changes; and take appropriate action.
Figure 1.
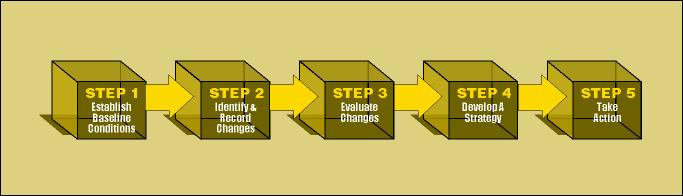
STEP 1 (Establish Baseline Conditions). Identify all applicable geo-referenced data that can be used to develop a GIS map of the project site, concentrating on a geographic area expansive enough to represent the area of potential effect (impact area) of the project. The most useful data include:
| Topographic contours | |
| Land ownership (parcel boundaries) | |
| Vegetation | |
| Sensitive habitats/species | |
| Cultural resources (archaeological and historical sites) | |
| Waterways (including USGS "blueline" drainages) | |
| Roadways (improved and unimproved) | |
| Wet and dry utility alignments | |
| Hazardous waste sites | |
| Engineering site plan (based on the preliminary engineering design) |
The purpose of this first step is to establish a basis for comparing preconstruction conditions with proposed modifications to project design, changes site conditions, and new environmental regulations -- all of which are examples of environmental excursions ("coloring outside the lines").
STEP 2 (Update and Revise the Data). Update or add data layers as new information becomes available. For example, incorporate the results of all preconstruction surveys, such as biological or cultural resource surveys mandated by permit conditions, or aerial photography and associated topographic mapping undertaken by project engineers. In addition, update all revisions to the project design by importing the project engineer's CADD files, as this will provide an up-to-date depiction of the project footprint. In this regard, make sure to include the absolute limits of construction, and not just the plot plan. In monitoring for environmental excursions, there is a need to consider all cut and fill slopes, drainage control features, access roads, borrow areas, and staging areas. These elements are all part of the total project footprint.
STEP 3 (Evaluate the Change). Evaluate changes in
project design to determine whether or not there has been an excursion beyond
the approved footprint for the project. The point of this step is to evaluate
the potential effect of any such change in design on the environment, with a
specific reference to the conditions extant at the time the project was approved
(as characterized in Step 1, above). The questions that need to be asked in
light of any given change are:
| 1. | Does this change represent a situation with potentially significant environmental impacts? For example, new or additional loss of wetlands, new or additional "take"6 of a protected species or habitat, or impacts to a known cultural resource site. |
| 2. | Does the change affect any of the terms or conditions stipulated in the project's permits? |
| 3. | Would implementation of the change give rise to a need for new permits or approvals? |
STEP 4 (Develop a Strategy). If the answer to any of the questions in the Step 3 evaluation is "yes," then a strategy is required to address the change. However, each situation is different -- some only slightly different, and some entirely different -- but all different in one respect or another. The type of change, the timing of a change, the location of a change, and the magnitude of a change all serve to define the situation. Given the dynamics and potential combination of these variables, as formulated by answers to the questions posed in Step 3, care needs to be given in thinking through the implications of various courses of action.
The starting point is always to focus on trying to reduce the significance of the change. This can be done by modifying the timing, location, or magnitude of the change, and is usually accomplished through timely discussions among the project team (i.e., the owner, the engineer, and the environmental consultant). Once all avenues have been explored, then a strategy for dealing with the agency(ies) is developed, with a focus on reducing environmental and economic cost and avoiding project delays.
STEP 5 (Take Action). Actions can include responses such as:
| Further discussion with the owner or project engineer to explore more fully the need for the change, and to provide recommendations to revise the approach or the design to avoid or reduce the impact(s)from a change. | |
| Additional site-specific environmental surveys or analyses to determine the effect of the change. It should be noted that the timing of these surveys may be affected by the time of year (i.e., weather or regulatory-driven survey protocols may determine when the survey work can be conducted). | |
| A timely discussion with the responsible regulatory agency(ies) to explore the nature of the change and the potential need for new or revised permits and approvals. | |
| Supplemental environmental documentation. Note that if significant new impacts cannot be avoided, there is a need to re-circulate NEPA and CEQA documents for public and agency review, which can delay the project schedule. |
These are the principal steps in applying the technique. The balance of this paper is devoted to a discussion of how this technique is currently being applied in the context of the ESP project in San Diego County, California.
The Emergency Water Storage Project (ESP), being undertaken by the San Diego County Water Authority (SDCWA), was approved for construction in 1995. With a construction time frame of approximately 12 years, SDCWA was the lead state agency under CEQA and the U.S. Army Corps of Engineers, Los Angeles District (Corps) was the lead federal agency under NEPA. Project approval included numerous commitments to monitor construction activities and to avoid additional environmental impacts. These commitments are recorded in several environmental compliance documents, including (1) the Mitigation Monitoring and Reporting Program (MMRP) included in the EIR/EIS document for ESP; (2) the MMRP included in the EIR/EA document for the Olivenhain Water Storage Project;7 (3) a 404 Permit, issued by the Corps; (4) two 1601 permits, issued by the California Department of Fish and Game (CDFG); and (5) three Biological Opinions, issued by the U.S. Fish and Wildlife Service (USFWS).
In total, there are over 700 individual environmental compliance requirements to be met during the course of implementing the project, generally categorized under the following environmental issue areas: biological resources, cultural resources, visual quality, paleontological resources, air quality, noise and vibration, water resources, traffic, land use, public safety, storm water and erosion control, geology and seismicity, and recreation.
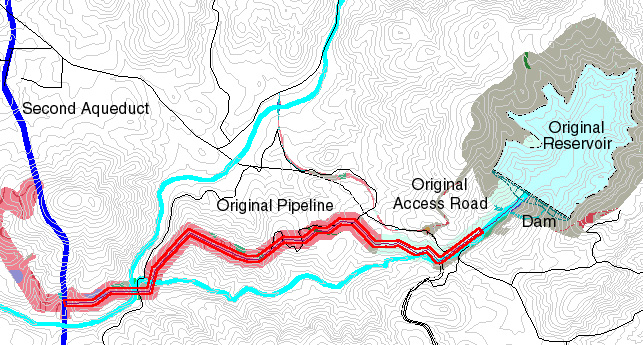
Step 1 (Establish Baseline Conditions). Fortunately, the preparers of the ESP EIR/EIS utilized GIS mapping in undertaking the environmental assessment process. Consequently, SDCWA had most key data layers available for use in creating a baseline map. The following information was imported into ArcView GIS to establish the project's baseline conditions:
| Project Footprint - An ArcInfo overlay was imported, reflecting the preliminary (10%) design. Project components included the Olivenhain Dam and a 24,000 acre-foot8 reservoir; a 800-horsepower pump station; an 82 million gallon per day (mgd) water treatment plant; an electric substation and 69 kV power line; a 2.5-mile, 72-inch raw water pipeline, connecting SDCWA's Second Aqueduct to Olivenhain Reservoir; a 2.5-mile, 48-inch treated water pipeline, connecting the water treatment plant to the OMWD water distribution system; pipeline access and maintenance roads; and other project-related features such as staging areas and construction right-of-way limits for all project components. | |
| Vegetation9 - An ArcInfo data layer was imported, depicting the classification and areal extent of all vegetation communities within the project footprint. | |
| Sensitive Species9 - An ArcInfo data layer was imported, depicting the location of sensitive plant and animal species within 500 feet of the project footprint. | |
| Cultural Resources9 - An ArcInfo data layer was imported, depicting the location of all archaeological and historical sites within one mile of the project footprint. | |
| Topography, Roadways, and Waterways - An ArcInfo data layer was imported from information provided by the San Diego Association of Governments (SANDAG), posted on the Internet and available at a 40-foot contour interval. Additional data layers illustrating roadways and "blueline" waterways were also obtained through SANDAG via the Internet. | |
| Land Ownership - A CADD file was imported from the project engineer. |
These data were combined to form the baseline map shown in Figure 2. This completed Step 1, and provided the benchmark against which all change could be compared.
Figure 2.
Step 2 (Identify and Record Changes). With the passage of five years from the point of project approval, Phase I of the ESP project has already experienced numerous engineering excursions as the project moves from the preliminary design to final design for each of the major components identified in Step 1, above. In addition, there have been several other instances where other events or circumstances have served to modify the conditions under which the project was approved. However, this was to be expected in a project of this magnitude. The challenge has been to identify each of these factors as they occur such that they can be understood and addressed within the context of the design objectives and the environmental compliance requirements attached to the project.
A brief overview of the issues encountered to date is provided in Table 1. While not comprehensive, this listing will give the reader an idea of the types of changes that have occurred. Grouped by type of change, the table also indicates applicability of the change to various project components.
| Table 1. Examples of Project Changes: ESP Project, Phase I |
|
Each of the factors identified as having occurred prior to construction has required attention, as they have each influenced project implementation decisions to one degree or another. Likewise, each design change has required specific consideration. As appropriate, the GIS data base was revised and updated to provide for adequate evaluation of these changes.
The steps taken to evaluate and resolve two of these changes (one during preconstruction and one during final design) are described below to better illustrate specific responses to these changes. In particular, the focus will be on the manner in which Steps 2-5 were undertaken in response to the Del Dios Fire and redesign of the pipeline access road network.
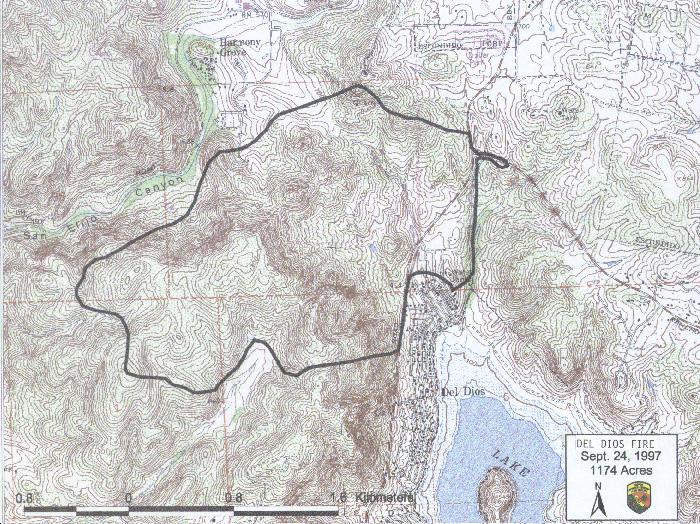
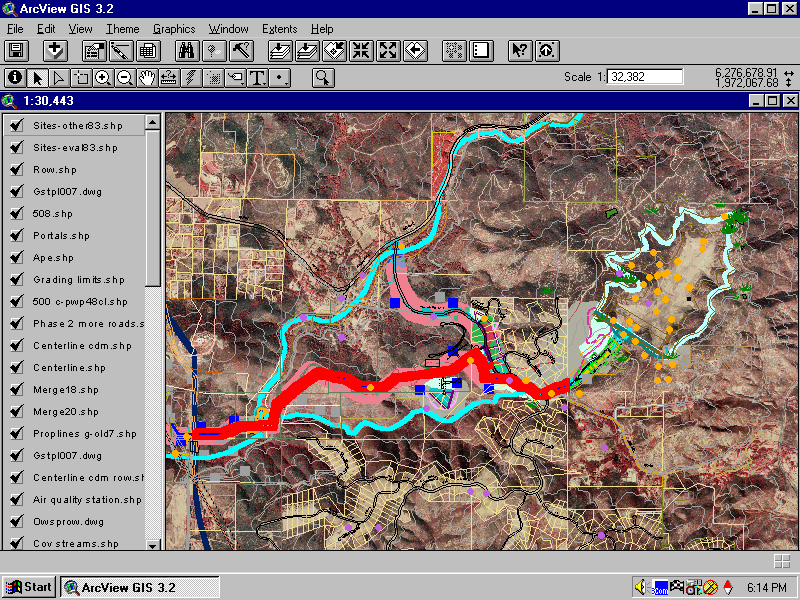
Step 2 (Identify and Record Changes). In 1997, a wildfire burned from Del Dios Highway northward across the proposed reservoir and power line construction areas (see Figure 3). The areal extent of the burn area was recorded as a data layer on the baseline map.
Figure 3.
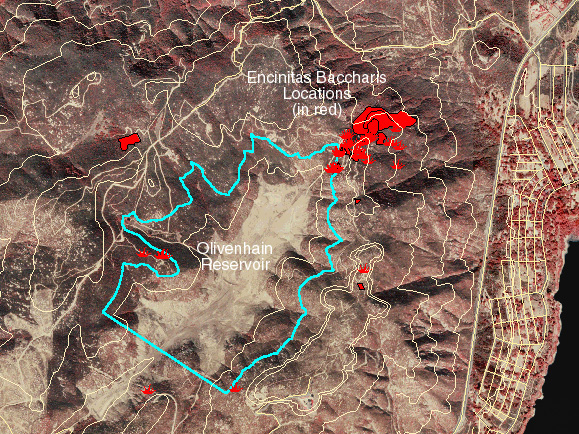
Step 3 (Evaluate Changes). An unexpected outcome of this fire was encountered during required preconstruction biological surveys. Newly emergent populations of Encinitas baccharis (Baccharis vanessae), a protected plant species were detected within the project footprint.10 While the life history of the plant is not clearly understood, it is endemic to San Diego County and is frequently associated with southern maritime chaparral vegetation or southern mixed chaparral communities. It generally occurs on north-facing slopes on sandstone or metavolcanic-derived soils at elevations of 200-2,890 feet above mean sea level. Interestingly, this species regenerates in response to fire or to manual disturbance of its habitat.
Given the newly established presence of this species within the project footprint (see Figure 4), and the fact that the species was not present when project approvals were obtained, this change represented a potentially significant environmental impact and a deviation from the "take" allowances provided for in the project's Biological Opinion issued by the USFWS.
Figure 4.
Step 4 (Develop a Strategy). Clearly, a strategy was needed to present this new information to the owner, the project engineers, and the regulators, as this change had the potential to result in project delays, redesign, and additional project costs.
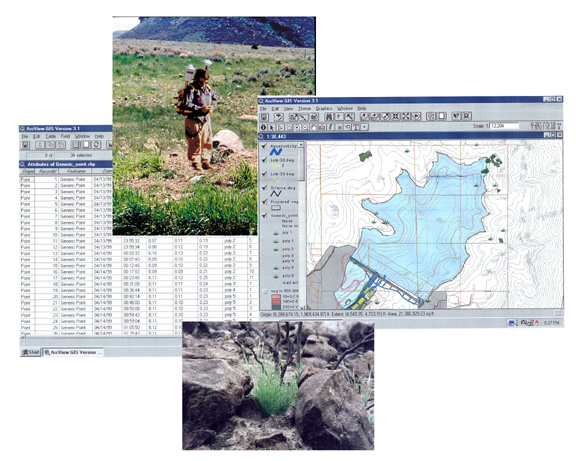
Once the owner and project engineer were briefed concerning the presence of the species and the general implications of disturbing the plants, the first task was to define the exact location of all plants, with reference to the project footprint. For this task, project biologists recorded the location of all plants within or adjacent to the project footprint using global positioning system (GPS) equipment to determine UTM (Universal Transverse Mercator) coordinates for each plant or plant grouping. GPS data were then downloaded as a GIS data layer to accurately assess the number of plants that would be taken as a result of dam and reservoir construction (Figure 5). We were now in a position to say with certainty that 17 of the 293 recorded plants would be affected -- two plants due to dam construction and 15 plants due to inundation during reservoir filling.
Figure 5.
After discussions with the owner and project engineers, it was determined that it would be difficult to adjust the dam design or the planned reservoir pool elevation to avoid the plants. Thus, the next task was to determine whether or not the plants could be successfully transplanted to undisturbed portions of the project area. Unfortunately, information obtained from local botanical gardens and societies, together with horticultural evidence obtained through researchers, suggested that this species cannot be successfully transplanted. Cuttings and seed germination were the only two methods to preserve the genome of affected plants. The only recourse was to present the situation to the responsible state and federal agencies.
Step 5 (Take Action). Several meetings with USFWS and CDFG ensued, with the GIS map depicting the exact location of the plants serving as the credible point of reference throughout the negotiation process. Our ability to depict the exact location of impacted plants was a key factor in being able to work through the situation effectively. The other GIS-based information that played a role in reaching a decision on effective mitigation for the impacts was an overlay of property boundaries of adjacent landowners and the boundary of the Elfin Forest Recreation Reserve, where other Encinitas baccharis populations existed. In order for the USFWS and CDFG to issue a no-jeopardy decision,11 SDCWA was required to purchase additional habitat in the immediate project vicinity for the purpose of dedicating the acreage to conservation of the species.
Thus, the GIS map (Figure 6) provided a vehicle to confidently report on the location and level of impact, the context for this impact (given the plotted location of other plants in the project vicinity), and target properties for acquisition. While project costs increased due to the requirement to purchase additional acreage, the project schedule and design remained unaffected.
Figure 6.
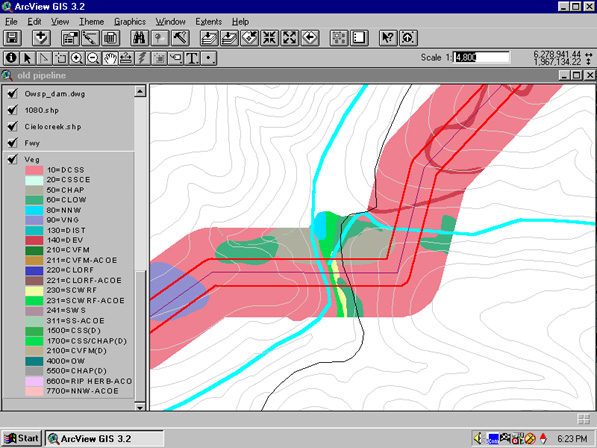
Step 2 (Identify and Record Changes). In the preliminary design (Figure 7), the project engineer assumed that all access roads required to construct and maintain/inspect the pipeline, could be located within the pipeline construction right-of-way. During final design, it was determined that portions of the pipeline corridor were too steep to accommodate access roads; thus, it was determined that the access roads must be redesigned to better conform with acceptable roadway grades. As a consequence, access roads had to be located slightly outside the proposed construction corridor to achieve necessary road grades.
Figure 7.
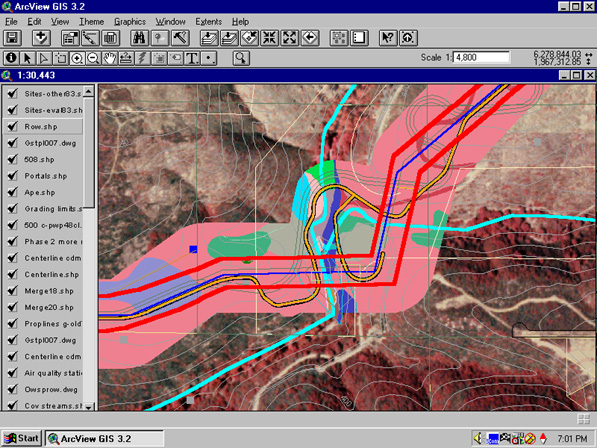
Step 3 (Evaluate Changes). We worked interactively with the project engineer to avoid impacts from potential access road realignments, which involved downloading CADD files into GIS and evaluating multiple iterations of access road realignments in light of sensitive upland and wetland vegetation communities and known locations of sensitive species (Figure 8). Through minor adjustments, impacts to sensitive species were avoided. However, when it became clear that impacts to additional jurisdictional wetlands were unavoidable, we developed a strategy for interacting with the two agencies responsible for the protection of wetlands, the Corps and CDFG.
Figure 8.
Step 4 (Develop a Strategy). Similar to the situation experienced in Example 1, above, we determined that our best strategy in dealing with the agencies was to be as definitive as possible in terms of the exact area that would be affected by the access road excursion. Consequently, we undertook a new wetlands delineation in the affected area, which included both GPS and field mapping techniques by the biologists (Figure 9). This new information was incorporated as a new data layer in GIS, and the areas of Corps and CDFG jurisdictional wetlands were calculated using ArcView's Avenue function. The resulting acreage calculations were compared to the previous wetland impact estimates in this area of the project to provide a basis for discussions with the two agencies.
Figure 9.
Step 5 (Take Action). The revised wetland delineation data, together with the acreage calculations, were extremely effective in facilitating the field and office discussions with the Corps and CDFG. During the agency meetings, it was requested that we try to avoid impacts to as many of the native riparian trees as possible, mostly sycamore (Platanus racemosa) and coast live oak (Quercus agrifolia) (Figure 10). To provide a basis for determining which trees could be saved, and which would probably be felled during construction, the biologists identified and recorded the GPS location of each tree in the field. This information was added to the wetland delineation data layer, and will be used during construction to mark trees to be saved at the same time sensitive wetland areas are cordoned off. This information was also provided to the project engineer for inclusion in the pipeline contractor's construction plans and specifications. The importance of complying with this avoidance requirement was reinforced at the contractor's pre-bid meeting. Compliance will be monitored throughout the construction period.
Figure 10.

In conclusion, the technique described in this paper has been used successfully to monitor the effects of environmental excursions during final design and construction of a major water resource development project over the course of the first two years of project implementation, and it will continue to be used for this purpose for the next three years (through the completion of Phase I of the project). Undoubtedly, there will continue to be additional instances where design modifications or completely exogenous factors will result in a change in circumstance that will need to be closely examined to determine the effect on the project's environmental compliance requirements. While some of these changes can certainly challenge our ability to find a solution acceptable to the owner, the project engineer, and the regulators, use of ArcView GIS to evaluate and demonstrate the nature of a change has proven to be extremely effective. Specifically, this approach to environmental compliance has exhibited inherent accuracy, credibility with the agencies, flexibility to incorporate data from many different sources, and the analytical power required to carry out multi-variate evaluations of some rather vexing issues.
The authors appreciate SDCWA's willing acceptance of the development and application of this technique. Further, we gratefully acknowledge the review of this paper performed by Mary Putnam, Principal Water Resource Planning Specialist at SDCWA.
| 1 | The term "environmental planning" is intended to include all activities undertaken prior to the time a public or private project is approved for construction. It includes all studies, analyses, document preparation, public involvement, and regulatory approval. |
| 2 | Usually interpreted to be at a 10 percent design level. |
| 3 | "Significance" is a term of art under NEPA and CEQA, and is defined as "a substantial, or potentially substantial, adverse change in any of the physical conditions within the area affected by the project including land, air, water, minerals, flora, fauna, ambient noise, and objects of historic or aesthetic significance (CEQA Guidelines, Section 15382)." |
| 4 | Specifically, CEQA requires that the lead agency monitor post-approval circumstances that may give rise to new significant environmental effects or a substantial increase in severity of previously identified significant effects as a result of one or more of the following: (1) substantial project changes; (2) substantial changes in circumstances under which the project is undertaken; and (3) new information of substantial importance not known at the time the project was approved. |
| 5 | The Emergency Water Storage Project (ESP) is designed to restructure the manner in which water is delivered, stored, and distributed for use during periods when the county experiences an interruption in the supply of water from sources outside the county, as in the event where an earthquake would sever supply aqueducts. The project, which will take approximately 12 years to construct, consists of about 91,000 acre-feet of additional storage, new pipelines, and new pumping stations designed to re-operate the county's existing water delivery system. |
| 6 | "Take" is a term of art under the Endangered Species Act of 1973, as amended (at 16 U.S.C. 1531 et seq.), and is defined in Section 9 of the Act as "harassing, harming, pursuing, hunting, shooting, wounding, killing, trapping, capturing, collecting, or attempting to engage in any such conduct." |
| 7 | The first phase of ESP is a joint undertaking with the Olivenhain Municipal Water District (OMWD), one of SDCWA's 23 member water agencies. OMWD was the lead state agency under CEQA and the U.S. Department of Interior, Bureau of Land Management (BLM) was the lead federal agency under NEPA in preparation of the EIR/EA. |
| 8 | An acre-foot is a unit of water-volume measurement used in the western United States, and equivalent to approximately 326,000 gallons of water, which is generally considered enough water to serve the needs of two average households for a period of one year. |
| 9 | These data were based on earlier field surveys collected during preparation of the EIR/EIS. |
| 10 | Encinitas baccharis was listed as endangered under the California Endangered Species Act in 1987 and as threatened by the USFWS under the Federal Endangered Species Act in 1996. |
| 11 | Under the provisions of the federal and California Endangered Species Acts, USFWS and CDFG must determine whether the "taking" of listed species at any given location would jeopardize the continued existence of the species. |