Principal Author:
Daniel Reid
Santa Barbara County
Public Health Department
Co-Authors:
Eric Just, Geodigital Mapping, Inc.
Gary Krauss, Geodigital Mapping, Inc.
John Robinson, Geodigital Mapping, Inc.
Clean Beaches- Using GIS to Help Remedy Shoreline Contamination
Santa Barbara is one of numerous costal communities in the United States with problems of ocean water contamination following periods of heavy rainfall. A significant effort has been undertaken by local government, environmental organizations, and the business community to find solutions to bacterial contamination triggering beach closures. One such effort uses GIS technology to identify septic systems that may be contributing to the high levels of bacteria and other contaminants in near shore areas. This paper outlines techniques established by a consortium of local organizations to delineate septic systems to be targeted for strict inspection and maintenance.
TABLE OF CONTENTS
Introduction 1
History 1
El Nino and Ocean Water Quality 1
Dangerous Older Systems 4
GIS Septic System Inventory Construction 5
Identifying Parcels Using Septic Systems 5
Developing the Hydrographic Layer 6
Flood Boundary and Wetland Layers 6
Identifying Special Problem Areas 7
Examining the Overlap Between Septic System Rick Criteria 7
Political Outcome 9
Future 9
INTRODUCTION
Santa Barbara is one of numerous coastal communities in the United States with problems of ocean water contamination following periods of heavy rainfall. A significant effort has been undertaken by local government, environmental organizations, and the business community to find solutions to bacterial contamination triggering beach closures. One such effort uses GIS technology to identify septic systems that may be contributing to the high levels of bacteria and other contaminants in the near shore areas. This paper outlines techniques established by a consortium of local organizations to delineate septic systems to be targeted for strict inspection and maintenance.
Septic systems have been used for sewage effluent disposal in many areas of Santa Barbara County where sanitary sewer access and/or capacity does not exist. Septic systems (onsite sewage disposal systems) rely on the properties of soil to filter septic tank effluent in the disposal field area.
Onsite sewage disposal systems have been under regulatory oversight in Santa Barbara County since the early 1950's. The Public Health Department, Environmental Health Services Division of Santa Barbara County has regulatory (permitting) oversight for septic systems within the County unincorporated areas beginning in 1991.
History
Two catastrophic events in Santa Barbara County have raised community awareness regarding health and safety issues associated with onsite sewage disposal systems (septic systems): El Ni±o precipitation and the tragic death of a young boy.
El Nino and Ocean Water Quality
El Ni±o is a term used to describe certain weather features that often combine to create extensive periods of heavy rainfall events in Southern California. In the winter of 1997 and into the summer of 1998, the south coast area of Santa Barbara County received an average of 47" of rainfall. A normal amount of rainfall for this same period averages 18". 22" of rainfall was received for the month of February. The heaviest rains occurred during a 10-day stretch of continuos rain in late January and early February 1998. Rainfall levels exceeded previous historic maximums. Throughout the region flooding was widespread as large and small creeks and rivers overflowed their banks. Huge plumes of silt were evident all along the coast at creek and river mouths. Satellite imagery revealed fresh water plumes almost reaching the Channel Islands.
Many Southern California communities have been monitoring near shore ocean water conditions for many years. Testing results from these communities revealed elevated levels of bacterial contamination in the surfzone waters. The Public Health Department, Environmental Health Services Division of Santa Barbara County, with the support and urging of the local community, began monitoring surfzone bacterial levels in September of 1996. The health officer of the County is charged with the responsibility of warning the beach going public when bacterial levels exceed state standards. The early test results generated from ocean water monitoring in 1996 and 1997 led to a few sporadic warnings
and beach postings/closures by Environmental Health Services. However, the heavy rains during El Ni±o significantly increased the amount of bacteria carried in storm water runoff to the beach areas as well as large amounts of flood debris (tree trunks, railroad ties, vehicles, etc.) and triggered warnings, postings and closures along the entire southern California coastline.
Santa Barbara County is a semi-arid region and many creeks are ephemeral (do not flow year round). But saturated watershed areas continued to drain all throughout 1998 and kept creeks flowing throughout the year. This ongoing flow continued to carry bacteria to the recreational areas of Santa Barbara City, Montecito, Carpinteria, Summerland, state beaches, county beaches, etc.
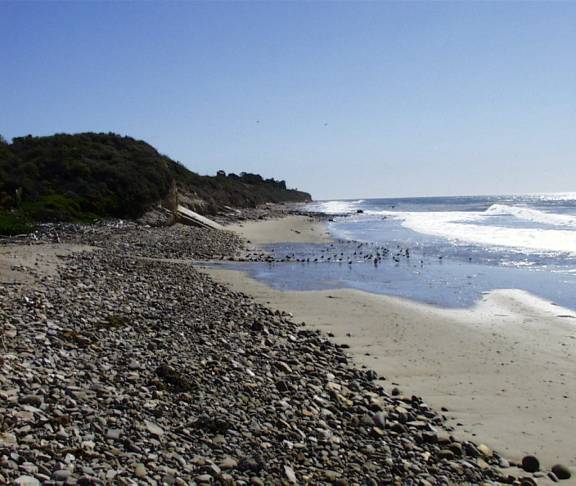
Figure 1. South Coast watershed

Santa Barbara is known for its mild climate, beautiful vistas and clean beach areas. As a result of the heavy stormwater runoff and continuous flows to the ocean surfzones, recreational activities (surfing, swimming, bathing, etc.) were severely limited throughout all of 1998. The community became very concerned about the effects this water contamination might have on beachgoers. Although the ocean water monitoring program alerted the general public to the public health risk, by the end of the summer, the community had become frustrated that the program did not attempt to reduce or eliminate the sources of the contamination.
A number of community action coalitions were formed to begin to address the identified water contamination. Heal the Ocean and CURE (Clean Up Rincon Effluents) were established during the summer of 1998. These two coalitions are very effective in lobbying local politicians to provide resources to address these problems. Local decision-makers responded to community concerns by creating Project Clean Water in October of 1998. Project Clean Water is a cooperative effort between the local community and government to improve water quality and thereby restore ocean water recreational opportunities.
CURE's main focus has been on the Rincon Beach area. Rincon Beach is located on the border between Santa Barbara County and Ventura County. Rincon Beach is a world-renowned surfing area. Surfers are very concerned about the public health risks associated with surfing at Rincon because of the elevated bacterial levels detected there. The Rincon Beach area is different from most of the typical Santa Barbara City beaches in that it is situated in a fairly rural area. The Rincon Creek forms the border between the two counties in many areas. The Rincon Creek watershed drains a large area of the two counties, but there are relatively few land uses (e.g. agriculture, residential) and there is little or no urbanization. A community- Rincon Point- of 36 residential dwellings in an area using onsite sewage disposal systems exists near the mouth of Rincon Creek and along Rincon Beach. The average density in this area is approximately3 single-family dwellings (sfd) per acre. A similar coastal community in the Padaro Lane area of Santa Barbara County has only half this density at 1.5 sfd/acre. CURE and many other local community members are convinced that these septic systems are adding to the bacterial contamination in the surfzone. The close proximity of the homes to the creek and ocean,
relative density of septic systems and sandy soils which do not offer much treatment for septic system effluent are the main concerns.
A special study conducted by Santa Barbara County in cooperation with Heal the Ocean and CURE revealed that some of the bacterial contamination was from human origin. The Rincon Point homeowners have decided to voluntarily extend the sanitary sewer mains from the local Carpinteria Sanitary District to their community to facilitate conversion of their septic systems to sanitary sewer disposal. There are many other coastal areas and areas in the other creek watersheds where septic systems exist and are suspected sources of contamination.
Environmental Health Services in conjunction with Project Clean Water created a septic system working group which began to explore issues of water contamination associated with these systems. Initially the group explored mandatory servicing (pumping) for all septic systems in the County. However the County Board of Supervisors expressed concerns for this proposal and suggested that the working group should explore site specific conditions that could pose a risk (either to public health and/or to water quality) to the local community. Many site conditions that could impact septic system disposal were discussed such as: slope; depth to groundwater; soil conditions; proximity to coastline; proximity to local creeks, etc. The working group quickly realized that site-specific information for all septic system parcels did not exist and therefore the risk criteria were broadened to more regional criteria. The working group established risk criteria and defined areas within the county where septic system disposal was problematic. Four main risk criteria were developed:
1. Parcels of which any portion is within 200 feet of the ocean mean high tide line or a major water body or stream as noted on United States Geologic Survey (USGS) 1:24,000 scale maps in urbanized areas and 1:100,000 scale maps in rural areas. A 400-foot setback will be applied to reservoirs or lakes. This setback was determined by adding a 100% safety factor (twice the current setback distances) to existing Basin Plan and Uniform Plumbing Code setbacks.
2. Parcels within the USGS-designated 100-year floodplains or designated wetland areas.
3. Parcels within County designated Special Problem Areas that were so designated because of sewage disposal constraints. There are five areas with this designation in the County of Santa Barbara: Mission Canyon Area; Naples; Janin Acres; Ballard and Los Olivos. Septic system constraints vary from known elevated levels of nitrates in groundwater (Janin Acres) to poor soil percolation (Mission Canyon) and small lot sizes (less than Į acre- Los Olivos, Ballard, Naples). The small lot size contributes to the overall density of septic system disposal in an area.
4. Parcels within areas that have known historic sewage disposal constraints. Such a determination would be based on records of septic system failures, previous study results (such as the South Coast Watershed Characterization Study or the Lower Rincon Creek Watershed Study), servicing records, prevalence of older systems or lots of less than one acre, characteristically poor soil or groundwater conditions for sewage disposal or historical need for non-traditional, alternate systems for wastewater disposal (e.g. mound systems) or exemptions to Basin Plan Prohibitions.
5. Areas currently subject to a septic system maintenance agreement with the County would be included.
Although these areas and criteria were developed in great detail, it was not until this information was translated into the GIS septic system inventory that examination of the relationships between these criteria and ways to focus efforts on the areas that had a higher probability of risk, could be analyzed.
Dangerous Older Systems
The second catastrophic event occurred in the spring of 1998. A young boy was playing in the yard of his home when the lawn area where he was playing gave way and he was plunged into sewage effluent. Although adults were nearby and made several attempts to save the boy, he drowned. The boy had unknowingly been playing on top of a thirty-foot deep, buried, hollow seepage pit. Hollow seepage pits were a normal disposal field installation in the 1950's and 1960's but have since been removed from current standards and replaced with rock filled seepage pits or leachfields that do not pose the same hazards. It is believed that the boy inadvertently broke through a deteriorated lid (probably due to years of being subjected to corrosive sewer gas).
The boy's tragic death led to a re-examination of the current septic system permitting standards. The Public Health Department convened a working group of industry representatives and concerned community members and created an onsite sewage disposal system ordinance that was enacted in April of 1999. The ordinance requires the upgrading of similar septic system structures (hollow seepage pits) to more structurally safe components (gravel filled seepage pits or leachlines).
The ordinance also requires septic system pumper to inspect active systems when the owners voluntarily service (pump) their septic systems. Most septic systems require the septic tanks to be pumped every 3-5 years.
GIS SEPTIC SYSTEM INVENTORY CONSTRUCTION
Information on sewer service and other property information such as ownership, valuation, and land use are contained in the Assessors Office Property Data File, which links to the parcel data by a unique parcel number code. The property database was "joined" with the parcel boundary files.
Identifying Which Parcels Use Onsite Sewage Disposal Systems (Septic Systems)
EHS began developing a database on septic systems 1992 to assist with their monitoring and permitting program. To complement this data base, information was gathered from 12 Sanitary Districts and two cities that comprise all parcels within Santa Barbara County in an effort to obtain as complete a picture as possible on all parcels in the county that may be on septic. Information was provided by:
Ę Cachuma Sanitary District
Ę Carpinteria Sanitary District
Ę Cuyama Community Services District
Ę Goleta Sanitary District
Ę Goleta West Sanitary District
Ę Laguna Sanitary District
Ę City of Lompoc
Ę Los Alamos Community Services District
Ę Mission Hills Community Services District
Ę Montecito Sanitary District
Ę City of Santa Barbara
Ę Santa Ynez Community Services District
Ę Summerland Sanitary District
Ę Vandenberg Village Community Services District
Each district provided a listing of parcels within their service area that were served by sewer and served by septic systems. The study also identified cases where sewer service was available to parcels on septic.
Data from the sanitary districts were integrated with the parcel database. Some discrepancies in service designation and jurisdiction within and among sanitary districts were resolved. Septic use for parcels outside the boundaries of the sanitary districts was inferred from their use code and improvements value of the property. For example, "septic" status was assumed for all parcels with an improvement value greater than zero and a use code indicating the parcel was not vacant, a parking lot, a utility, or a right of way. The GIS was invaluable to this process by providing sanitary district personnel with a number of interim maps to visualize and then revise or correct the status information.
Developing the Hydrographic Layer
Geodigital Mapping, Inc. (GDM) created the hydrographic layers from multiple sources. For the urbanized areas of Santa Barbara County, fourteen USGS 7.5-minute quadrangles at a scale of 1:24,000 were scanned at 800 dpi using a large-format, high-resolution color scanner. The resultant 24-bit color Tagged Image File Format (TIFF) data was geo-referenced to the source Universal Transverse Mercator (UTM) projection. This allowed the projected residual error data to be compared and validated against the theoretical projection parameters from which the original quadrangle was compiled. Following the image geo-referencing process, the blue and purple hydrographic features were extracted in raster form and converted to black and white images for vectorization. The resulting black and white images of the hydrographic layers were imported to the GDM raster to vector conversion process. All features were collected to criteria meeting USGS National Map Accuracy Standards for position. A full attribute set was assigned to the data set that fully describes each hydrographic feature.
The hydrographic data for the remainder of the county was obtained from USGS 1:100,000 DLG data and loaded into ArcView. The two layers (1:24,000, 1:100,000) were then merged together to create a complete countywide coverage in ArcView.
Flood Boundary and Wetland Layers
Flood plain boundary data were obtained from the FEMA Map Service Center as the Q3 Data Product. Q3 data are based on existing Flood Insurance Rate Maps (FIRMS). Special Flood Hazard Area (SFHA) boundaries were used to designate flood zones of interest. SFHAs are areas subject to inundation by a flood having a one-percent or greater probability of being equaled or exceeded during any given year. Q3 data were obtained from FEMA in ArcInfo export format, geographic coordinates, datum NAD27. The source scale ranges from 1:6000 to 1:24,000. The Q3 data were projected to California State Plane, NAD83, and registered to the Santa Barbara County base map.
U.S. Fish and Wildlife Service National Wetlands Inventory (NWI) data at 1:24,000 scale were downloaded from the Fish and Wildlife Service National Wetland Inventory website for the 19 available quadrangles in Santa Barbara County. For purposes of the study, the NWI wetland codes were simplified to a smaller number of categories. The source NWI data is in Albers projection, units are meters, datum is NAD27, nominal scale is 1:24,000. The NWI data were projected to California State Plane, NAD83, and registered to the Santa Barbara County base map.
Identifying Special Problem Areas
The Santa Barbara County Board of Supervisors has designated five specific areas of the county as "special problem areas" with sewage disposal constraints: Janin Acres, Los Olivos, Mission Canyon, Ballard and Naples. Parcels in these areas were identified by Santa Barbara County Environmental Heath Services (EHS) and designated in the GIS.
"Known problem areas" are areas of the county that are considered problematic for septic systems. Numerous factors including geology, surface water impacts, and ground water impacts were considered when classifying these areas.
Also defined by EHS, "marginal/potential problem areas" are considered problematic areas for septic systems as well. These areas consist of septic parcels with past problems, prior complaints, and older systems.
EXAMINING THE OVERLAP BETWEEN SEPTIC SYSTEM RISK CRITERIA
Once all the data layers were co-registered, the septic parcels at risk were selected using the following criteria:
Ę Parcels within 200 feet of creeks
Ę Parcels within 400 feet of lakes or reservoirs
Ę Parcels that intersect wetlands
Ę Parcels that intersect the 100 year flood plain
Ę Parcels that intersect special problem areas
Ę Parcels that intersect known problem areas
Ę Parcels that intersect marginal/potential problem areas
Several of the criteria are based on hydrologic features, leading to overlapping areas were more than one criteria impacts a given parcel. Figure 1 shows a close-up example of parcels impacted by several risk criteria.
Figure 2
The initial analysis simply identified the parcels that met at least one of the risk criteria (see Table 1). The application is designed to allow EHS to modify its risk criteria to evaluate different scenarios. For example, weights can be applied and the risk criteria can be combined in flexible ways. Also, EHS will be able to update the analysis based on new property and parcel information, as it becomes available.
Table 1. Summary Statistics
Septic parcels within 200 feet of creeks 3,135
Septic parcels within 400 feet of reservoirs or lakes 755
Septic parcels that intersect wetlands 317
Septic parcels that intersect the 100 year flood plain 1,331
Septic parcels that intersect special problem areas 815
Septic parcels that intersect known problem areas 500
Septic parcels that intersect marginal/potential problem areas 1,782
Total number of septic parcels meeting at least one risk criteria 5,931
POLITICAL OUTCOME
The previously described septic system risk criteria were presented to the Santa Barbara County Board of Supervisors at two separate hearings (October 26, 1999 and January 25, 2000) in conjunction with a recommendation for a mandatory servicing and inspection program for septic systems. This program would require servicing (pumping) and inspection of septic systems on a regular frequency (proposed for a four-year cycle). Initial proposals were for a countywide program or to select parcels using septic system disposal that were aligned with identified risk criteria (e.g. within 200 feet of a creek, etc.).
These proposals ranged from over 9,300 parcels countywide to approximately 6,000 parcels (in one or more risk criteria categories). The County Board of Supervisors indicated that they believed these proposals were too broad and subsequently the proposal was focused on the Santa Barbara County south coast area. This proposal was to be presented to the Board of Supervisors as part of annual budget proposals the week of June 12- June 16, 2000.
In addition, the Board of Supervisors recognized the opportunity for conversion of septic systems to sanitary sewer where sewer infrastructure was available (i.e. within Sanitary District boundaries and within 200 feet of a sewer main). The Sanitary Districts and local Environmental organizations have been working together to create opportunities for homeowners to convert to sanitary sewer disposal. The Public Health Department is working to expand this coalition to investigate and develop incentives to facilitate these conversions. The GIS system has been very helpful in identifying over 500 parcels in the south coast area where sewer infrastructure is available to parcels currently using septic systems.
FUTURE
GIS inventory for the Public Health Department is in its infancy. EHS since 1991 has permitted more than 2000 septic systems. These permits include new systems, repairs, destructions, modifications and certifications of existing systems. Currently the vast majority of information submitted with these permit applications is in hardfile format. This information can include:
v Soil Profiles
v Setbacks to water wells and water courses
v Site plans
v Topographic information
v Depth to groundwater
In addition, the first year of the current voluntary servicing program which encompasses mandatory reporting of these service calls by septic system pumpers, has revealed that approximately 50% of systems being serviced each year require some type of repair, modification or upgrade. Correction notices are sent to homeowners when these defects are identified. Currently hard copies of this information are filed by geographic locations.
The Public Health Department also has oversight for a Septic System Survey District of approximately 250 parcels. Biannual site visits and surveys are completed with the assistance of homeowners. Septic system problems are documented and correction notices are sent as appropriate.
The Public Health Department has regulatory oversight for a myriad of related programs:
³ Drinking Water
³ Ocean Water Monitoring
³ Solid Waste
³ Retail Food Facilities
³ Public Pools/Spas
³ Vector Control as well as Liquid Waste (septic systems)
These programs all have unique and overlapping geographic information.
The Public Health Department is currently formulating plans to expand the current GIS septic system inventory. With the usage of underlying databases we envision:
1) Inclusion of all hardfile information
a) Septic system servicing
b) Septic system surveys
c) Site specific information
2) Automatic generation and tracking of correction notices
3) Analysis of overlapping data to identity problematic areas for septic systems. This information will be provided to other regulatory agencies for long-range planning and community development.
4) Inclusion of information from other programs
a) Water well location
b) Groundwater profiles and gradients
c) Water Quality Analysis & Monitoring
i) Identification of potential sources of water contamination/pollution
As this is a community concern and has broad based support, we are attempting to incorporate students, interns and local environmental and business organizations into the data conversion/GIS enhancement process.
In order to adequately address water quality improvement and reduce associated public health risk we must effect behavioral changes in the general population. To this end we must strive to collect, analyze, and properly present geographic information. A well-informed general public will willingly embrace positive change.
Daniel Reid
Santa Barbara County
Public Health Department
Co-Authors:
Eric Just, Geodigital Mapping, Inc.
Gary Krauss, Geodigital Mapping, Inc.
John Robinson, Geodigital Mapping, Inc.