
EarthScan Network Incorporated provides a time-critical advantage to the agricultural industry by allowing Internet access to ordering, archiving, analysis, and delivery of remotely sensed imagery from the IKONOS satellite. Integrating the analyzed high-resolution imagery with historic, current, and forecast weather data into a large-scale GIS map layer provides a powerful modeling and assessment tool that can lead to improved management decisions for issues such as irrigation scheduling and the application of herbicides, insecticides, and/or nutrients.
The analysis of satellite imagery for identifying crop variability has been exploited since the availability of Landsat MSS/TM data in the mid 1970's. With the advent of today's high-performance commercial satellites, beginning with the 1999 launch of Space Imaging's IKONOS satellite, imagery of the highest spatial and radiometric fidelity is now available throughout the world. This imagery is ideal for time-critical analysis of cropland. The analyzed image and information derived from it can then be seamlessly brought into a Geographical Information System (GIS) as part of the crop management decision support structure. When the high-resolution imagery is combined with microclimate weather data, powerful agronomic modeling and assessment tools can be developed for improved field and sub-field management, such as monitoring the effectiveness or need for irrigation, treatments for diseases and pests, and the addition of nutrients.
EarthScan Network Incorporated of Albuquerque, New Mexico has developed an agriculture remote sensing product that allows an individual to order, archive, analyze, and download products derived from IKONOS satellite imagery over the Internet for use in farm management. The following paper describes the EarthScan product as applied to time-critical farm management using imagery acquired by the IKONOS satellite and explores the possibilities of combining historic, current, and forecast weather data as an integrated crop management tool.
EarthScan is an Internet-based agriculture remote sensing tool that provides the agriculture industry with access to high-spatial resolution, multispectral imagery of crops multiple times during the growing season; EarthScan also provides the same service for inter-seasonal management needs. The goal of EarthScan is to provide an easy-to-use method of deriving "actionable" information from agriculture imagery without the complexity of traditional image acquisition, analysis, and exploitation. The strategy employed to meet this goal is to give an individual a single point for (1) ordering imagery from a data provider, (2) storing imagery within a 7x24 accessible image warehouse, (3) providing a basic, but powerful, set of online analysis routines designed specifically for agriculture, and (4) saving the analyzed image for importing into a local agriculture-based GIS for further modeling and analysis or hardcopy creation for historical crop records. Currently, EarthScan takes advantage of the high-resolution, multispectral imagery of the IKONOS satellite. The internal architecture, however, is fully extensible and can manage other types of raster-based data. The image model used by EarthScan takes into account both the need to cover a maximum amount of cropland during any single acquisition for satellite tasking efficiency and the need to analyze small areas for field-specific management. The later provides a functional Internet based product for the distribution of analyzed imagery over, what are typically, slow telephone connections to local Internet Service Providers.
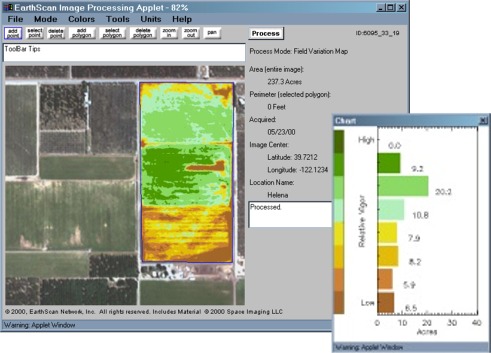
A typical EarthScan session begins with accessing a dynamic map interface to either place an order online for tasking the IKONOS satellite for new imagery or to search for imagery that is stored within the EarthScan image warehouse. Ordering a new image requires the placement of a 110 km2 block over the area of interest on the map interface and performing the necessary contractual agreements for payment. At the time of this writing, EarthScan Network Incorporated has acquired over 60 IKONOS image scenes that are available for analysis. An EarthScan customer care representative sends electronic mail and verbal notification to the individual who placed the order when the imagery becomes available within the image warehouse. If only searching for existing imagery within the warehouse, the map interface highlights the location of all available imagery and the user needs only to select a point location and date range to begin a search. Once a location is identified based on geodetic coordinates, a search for imagery is performed against the current data set within the image warehouse. A successful search will identify all imagery satisfying the location and date criteria. For accurately locating specific fields, EarthScan provides a gray-scale preview image that can be "panned" across the entire IKONOS image scene in approximately 150-meter increments. When the exact field location is verified in the preview image, the geodetic and image specific information is saved in a personal account summary and the image can be purchased for online analysis. The image can then be analyzed using both a spectral and spatial tool set, and then the derived product can be downloaded or emailed over the Internet to a local computer as a fully geo-registered GeoTIFF file, a format that can be opened and read by most image processing and geographical information systems (GIS) software. The analyzed image has an area extent of approximately 240 acres and a data volume of about 700 kilobytes.
The IKONOS satellite (http://www.spaceimaging.com) has the feature ability to target imagery as much as 51 degrees off nadir, thus providing an effective repeat cycle of between 1 and 3 days. Although such revisit performance is possible, it requires between 14 and 30 days to successfully acquire imagery for EarthScan, the result of cloudy weather and resource contention on the satellite. Once acquired, an image goes through a production phase that can require between 1 and 7 days depending on the location of the ground station that received the image. The IKONOS imagery that is stored in the EarthScan image warehouse has an area extent of about 110 km2, the same area of a single "snap-shot" scene. The data consists of 11-bit radiometrically and geometrically corrected four-band imagery. The four wavelength bands are consistent with the blue, green, red, and near-infrared of the Landsat TM series sensor with wavelength centers for each band at 485 nm, 555 nm, 665 nm, and 805 nm, respectively. All imagery is projected to the Universal Transverse Mercator (UTM) projection and the 1983 North American Datum (NAD 83) and corrected to a 4-meter ground sample distance. The geographic registration of the IKONOS imagery has a precision of about �50 meters of horizontal circular error. Imagery can be corrected within the UTM grid through the EarthScan online tools.
The emergence of information technologies for agriculture production management has been increasing since the early 1980's (Dixon and McCann, 1997). Farm managers are now developing new methods to employ crop service at the sub-field level, such as the application of nutrients and pesticides through Variable Rate Technology (VRT), rather than servicing the entire field as one homogenous unit. This management shift to precision agriculture is resulting in better control of crop inputs to optimize production, thus maximizing profits and reducing the negative impact of farming on the surrounding environment. An important step in the precision agriculture decision support structure is to identify sub-field zones for pre-season, in-season, and post-season management. The EarthScan online tool set consists of spectral and spatial analysis functions, and has the ability to save the analyzed image within an HTML page, downloaded directly to a user's computer disk, or emailed to another user (the last two processes store the analyzed image as a GeoTIFF). Online spectral and spatial analysis provides to the farm manager an "easy-to-use" method of deriving sub-field management zones through the use of imagery. Soil zones can be mapped with the use of bare-soil imagery, while vegetation zones can be mapped with imagery acquired throughout the growth cycle of the crop.
Spectral analysis of imagery includes typical combinations of visible and near-infrared acquired data to produce an enhanced composite display image, similar to film-based natural and color infrared photography, and an enhanced Normalized Difference Vegetation Index (NDVI) analysis. The enhanced NDVI generates a fixed-color mapping that highlights variability within the analyzed field for either sensitivity analysis (Field Variation Map), overall temporal growth analysis (Season Variation Map), or defining zones of production (Production Zone Map). For each NDVI based analysis, colors for the mapping can be selected from 2, 4, 8, or 16 colors. Corresponding acreage for each color is represented as an accompanying histogram.
Spatial analysis of imagery allows a user to draw a polygon for feature-specific measurement and analysis. All spectral analysis tools can be applied to only the area within an active polygon. Up to eight polygons can be entered and saved for each image within the user's account summary information. Measurements are made of the area and perimeter of each polygon and can be reported in a variety of U.S. and International measurement units. Although imagery is projected to the UTM map projection, online presentation of imagery and polygons are referenced using geodetic coordinates, thereby allowing polygons to match with images based on an earlier datum/ellipsoid. Individual images can be corrected within the UTM grid system, thus allowing a user to more accurately register a specific image to a user's ground control point. All geographic referencing information and results of spectral analysis can be saved on a local computer system as a UTM NAD 83 projected GeoTIFF file.
At the heart of EarthScan is the Tierra Station, a data warehousing and distribution software suite developed by Photon Research Associates, Inc. of San Diego, California. Tierra Station uses a server/thin-client-computing model to address the need for image display and analysis over potentially slow Internet phone connections. The server/thin-client model describes a system where (computer) process intensive activities, such as image storage and analysis, are managed by a high-performance system (the server), while less intensive activities and user interaction are performed by a mid- to low-performance system (the client). In the case of Tierra Station, the primary function of the server(s) is to store and process imagery for distribution to the user through the Internet/WWW. Secondary functions of the server(s) are (1) to provide a dynamic map interface (Esri MapObjects and MapObjects Internet Map Server) to the user as a direct method of ordering imagery and locating fields that are within the image warehouse and (2) to maintain a personal database for each user to store the location of fields and polygon/attribute information.
Tierra Station utilizes a series of DELL PowerEdge 4300 servers configured with dual 500 MHz Pentium II microprocessors, 1024 Megabytes of RAM, and a 500 Gigabyte disk array (RAID level 5) for image storage. Operating software includes Microsoft Windows NT Server 4.0, Microsoft Internet Information server 4.0 for Internet/WWW services, Microsoft SQL Server 7.0 for database management, and the Microsoft Visual Studio 6.0 (including the Java Programming Language) for software development. Image processing and analysis is performed with the Interactive Data Language (IDL), a fourth generation numerical programming language developed by Research Systems, Incorporated. Online analytical processing is achieved through a combination of network interactions between the client Java applet and IDL. EarthScan/Tierra Station does not require installation of any special software, an advantage over similar applications for the analysis of imagery for agriculture.
Weather information influences how we farm in many different ways. Its use within the agriculture industry varies from the regional perspective of macroclimates to the field-specific perspective of microclimates. Much of the agriculture landscape that we see today is shaped by crop selection that has been determined from what general crop types perform best for the climate of that region. The agriculture industry, beginning with the small family farms of our past, have determined this crop selection through years of watching the weather, thus building a knowledge base of historical climatic data. Based on this historical weather data, modern plant breeding techniques have provided a myriad of crop hybrid choices within a given cultivar. These hybrids are bred to give a producer the desired characteristics of the crop, such as season length to maturity, drought resistance, and insect resistance. To make a hybrid selection, a producer may look at a variety of decision-making factors, and perhaps the most important is regional climatic information.
At the field-specific level, producers are concerned with decisions that affect the day-to-day management of their crop(s), such as whether to irrigate if it is not going to rain or should an insecticide be applied if the wind velocity will be increasing through the afternoon. Microclimate weather data is perhaps the most common input into the crop decision support structure and can affect many different facets of the decision process. This is especially true as technology enables access to a variety of different microclimate databases and provides site-specific meteorological collection stations to transmit data to a computer based data logger (Dixon and McCann, 1997). Microclimate weather data is also perhaps the most difficult type of information to manage for the producer due to the many different attributes associated with its collection. Fortunately, today's geographical information systems are a natural tool to manage and exploit microclimate weather data because of its spatial character, such as the point locations of temperature or the grid information of atmospheric motion that is returned from a NEXRAD Doppler radar scan.
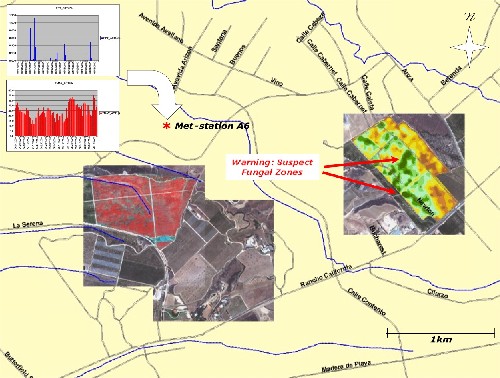
Derived imagery from EarthScan and microclimate weather information can serve as a powerful tool to manage crops at the field and sub-field level. Imagery provides direct crop information by reference to location (down to a resolution of 16 m2), while microclimate weather data provides both direct and indirect information about factors that can influence the health of crops. The following hypothetical model demonstrates one method that imagery and weather data can provide time-critical information to support the crop management decision-making process.
Grape plants can be affected by a variety of different fungal pathologies, including Botrytis Bunch Rot, Black Rot, and Downy and Powdery Mildew (http://www.cas.psu.edu/docs/CASDEPT/PLANT/fpath/factsite.html). In most cases, weather can be a determining factor as to the extent and severity of the disease, and perhaps more important, how and when to treat the disease. For example, excessive precipitation, wind speed and direction, and temperatures above 50 degrees Fahrenheit can influence the distribution and severity Powdery Mildew. A dense plant canopy can also affect the onset of disease by limiting good air circulation and sunlight, both factors in removing excessive moisture that may build up on the plants after heavy rains. If high-spatial resolution imagery were collected over vineyards prior to disease infection, detailed maps showing zones of dense vegetation could be derived and placed into a GIS. With a network of meteorological stations placed throughout the vineyard, a model can be developed that would alert the farm manager to suspect zones where disease could initiate when certain weather thresholds are exceeded. Short-term historical weather data can provide a baseline for setting thresholds, while forecast data can provide sufficient advanced warnings for readying treatment plans. With the derived maps already in the GIS, field-scouts could be directed to the exact location of vegetation that may be affected by one of the fungal diseases. If an infection does occur, additional imagery can be utilized to monitor its spread and treatment. Zones that are derived from high-spatial resoultion imagery that show infected areas can be mapped in great detail, thus providing the farm manager information to decide whether the area affected by infection meets an economic threshold for treatment. If treatment is warranted, current and forecast weather data in important for scheduling an effective treatment schedule. In this case, efforts directed to management of fungal disease in Grapes can be more efficient and cost-effective.
EarthScan Network Incorporated has developed technology that can improve the performance of the agriculture industry. By providing access to ordering, archiving, analyzing, and distributing high-resolution satellite imagery, today's farm managers can make more informed and cost-effective decisions for managing their crops. By combining the derived imagery with the current high-resolution weather information, a powerful GIS modeling tool can be a reality for use in the crop management decision support structure.
Judy Dixon and Marcia McCann, Ed., Precision Agriculture in the 21st Century. First edition, Washington: National Academy Press, 1997.