in the Eastern Part of Turkey
Through GIS Analysis
Zuhal Akyürek 1, A.Ünal Sorman 2
1 Geodetic and Geographic Information Tech. Dept., METU, 06531 Ankara, Turkey
2 Civil Eng. Dept. METU 06531 Ankara, Turkey
Abstract
Monitoring the snow-covered areas and estimating the snow water equivalance
plays an important role in predicting the discharges during spring months,
especially in the regions where snow is an important resource. In estimating
the snow-covered areas, besides semi-supervised multispectral classification
of NOAA-AVHRR images, recently developed theta algorithm which is a multiband
classification algorithm is used. The effect of elevation, slope
and aspect in determining the snow-covered areas for April 1998 is obtained
and snow line is determined considering the effects of these factors. The
change in the snow-line is monitored through the melting season by the
help of GIS.
Introduction
In this study it is aimed to monitor the snow-covered areas in the eastern
part of Turkey through NOAA(AVHRR) images where the snow covered area percentages
are used as one of the inputs for an appropriate snowmelt runoff model.
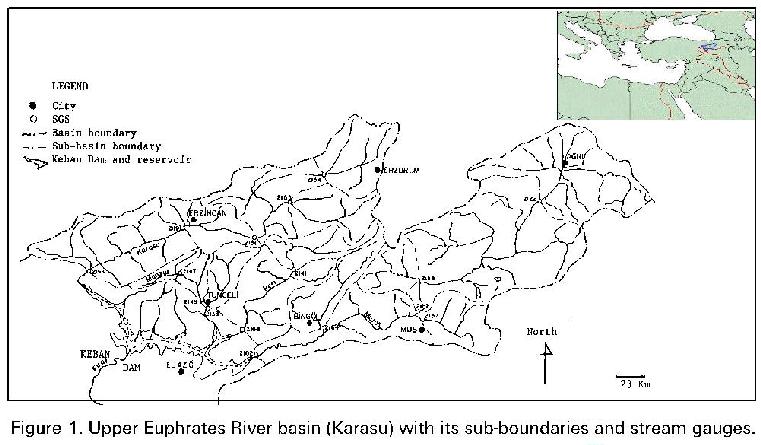
One of the major contributors of water to the Keban Dam is the Karasu
River which joins the Euphrates River at Keban Dam near the city of Elazig.
Snowmelt from mid March to June contributes 65-70% of the total annual
runoff. Therefore estimating the potential of the runoff from the
snowmelt in Karasu basin is important in the operation of the Keban Dam
(Figure 1).
Monitoring the snow-covered areas through satellites
Snow was first observed by satellite in eastern Canada from the TIROS-1 satellite in April, 1960 (Barnes and Smallwood, 1975). Since then, the potential for operational satellite based snow cover mapping has been improved by the development of higher temporal frequency satellites such as GOES (Geostationary Operational Environmental Satellite), Landsat and SPOT series, and NOAA-AVHRR and DMSP SSM/I satellites.
The daily availability, easy access and the low cost of AVHRR data make these advantages potentially for operational monitoring of snow area and depth. The majority of operational snow mapping projects employing satellite data have experienced difficulties with separation of snow from cloud (Lucas and Harrison, 1990). Visible and infrared imagery have been utilised for the determination and mapping of snow-covered area and the monitoring of several snow surface characteristics (Barrett et al., 1994).
AVHRR channel 3 and channel 4 are effectively the snow/cloud discrimination
channels, while channel 1 facilitates the definiton of snow pack boundary
due to the high contrast between snow covered and snow free surfaces in
this waveband. Clouds consisting of ice particles and large water droplets
show considerable absorption in the 3.55-3.93 mm
wavelengths and, with ice clouds in particular, low thermal emission. Clouds
containing smaller ice and water particles introduce higher intensity values
into channel 3 imagery and show some overlap with the spectral response
of snow.
Application
It is observed from the snowpillows and meteorological stations, which were established in the Karasu basin within the context of the NATO Sfs TU-REMOSEN project, that on April 4, 1998 snow fell in the Karasu basin. For this reason days; April 1, April 6, April 9, April 13 April 25 and May 26 , were selected due to being cloud-free or partial cloudy. The snow covered area is obtained through two different classification techniques and the snow depletion curves are obtained.
In a previous study (Şorman, 2000) the relation between snow covered areas and elevation for Karasu basin was determined and for 1997 the basin was divided to five different elevation classes (Figure 2). Snow covered area percentages and snow depletion curves are obtained for each elevation class.
Pre-processing of the images
The raw NOAA-AVHRR images captured by the receiver located in METU campus are converted into Level 1B format and imported into an image processing software. In this importing step the images are calibrated into geographical coordinates, atmospheric and radiometric corrections are performed and then the images are geocoded into UTM coordinate system.
Processing of the images
Unsupervised classification
Statistical models are the most commonly used techniques for processing remotely sensed data (Duda and Hart, 1973). It is the aim of the statistical methods to find algorithms for classifiying each pixel- according to its specific reflection and emission values- into a predefined object class. Most commonly, parametric, classification by supervised learning techniques are used which are based on the statistics of training samples.
From the corrected and geocoded NOAA-AVHRR images, April 1, 1998 image is classified using ISODATA technique. In this classification 40 clusters are used, iteration number and convergence threshold are selected as 120 and 99.9% respectively. Finally four classes,namely; snow, cloud, sea-water, land, are obtained.
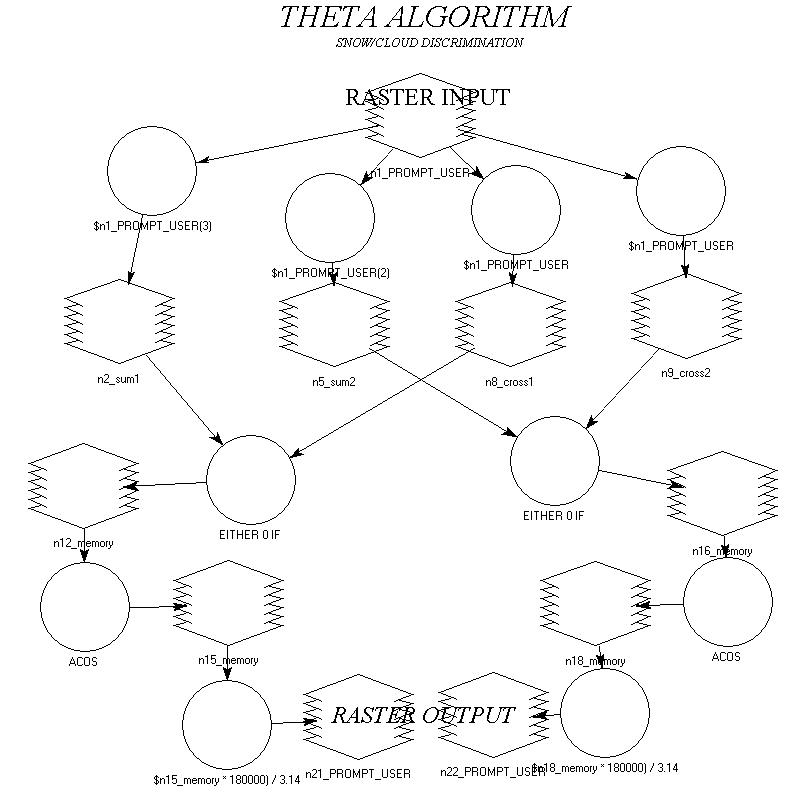
Theta -image classification
The National Operational Hydrologic Remote Sensing Center (NOHRSC) in the Office of Hydrology of the National Weather Service has developed an operational multi-band snow classification algorithm theta designed to separate snow from cloud, land and water (Maxson R.W., et al., 1998).
Theta algorithm assumes multi-band imagery as input. Each row-column coordinate location in the image is treated by theta as a vector quantity. The components of each vector are calibrated digital counts for the combination of bands selected for the analysis. Two classification routines are used and then differences for the two resultant images are taken to map the areal extent of snow. The first routine uses channels 3, 4 and 5, the second routine uses channels 1,2,3 and 4 to form a four-space vector algorithm to identify the areal extent of both snow and clouds. Members of the same classification category in the image tend to have similar values in each band and by extention similar theta angles. Members of different classes will exhibit theta angles which should align on opposite sides of a threshold angle.
Using the first classification routine, the cloud/no-cloud covered areas are obtained for all the images. In images created using these techniques, it is observed that the cloud surfaces start at the minimum theta values found in the synthetic image and end within one standard deviation of the theta simple mean.
Theta algorithm is created in the model maker module of the image processing software (Figure 3). When the two classification algorithms are compared, it is observed that the theta algorithm offers an opportunity to exploit clustering tendencies using an efficient algorithm for excising a targeted class and the algorithm is fast enough that near-real time configuration and execution is feasible. Whereas in the Isodata technique even having many clusters, still some features can be mixed. Therefore, in this study theta classification algorithm is prefered in obtaining the snow covered area percentages. However, in the continuation of this study it is observed that this algorithm is not always successful for particular cloud types and over the wet surfaces.
Determining the snow depletion curves
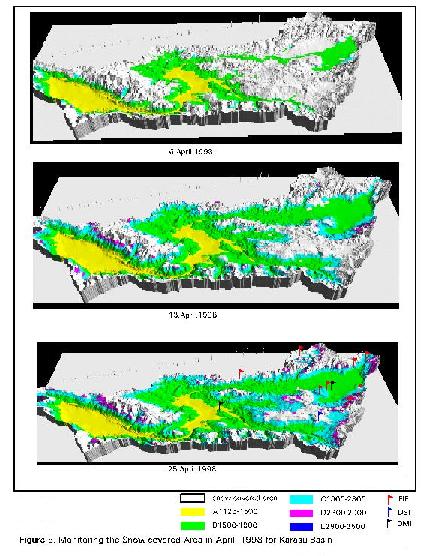
Daily snow cover depletion data are the most important input variable to the snowmelt runoff model (SRM) used in this study and are derived from remote sensing data with the image processing and GIS modules (Martinec et al, 1994). Since the elevation changes between 1125m and 3500 m in the basin, 5 elevation zones are taken for the snow cover analysis. This makes possible to see the effect of the elevation zones in the outflow hydrograph. The elevation zones B (1500-1900 m) and C (1900-2300 m) covers 66% of the total area, therefore the changes occuring in these subcatchments have a high contribution to the outflow hydrograph. The snow depletion curves for each elevation zone are given in Figure 4. It is observed that the snow melting started in March for 1998.
The snow occurred on April 4 had a great effect especially on the elevation zones B and C. If the snow covered area percentages had not been obtained for April 6, the linear interpolation performed between April 1 and April 9 would give a depletion line denoted with a number (1) as indicated in Figure 4, B1 and C1. However in the real case, B2 and C2 cases represent a better depletion line when April 6 image is introduced. From Table 1 it can be also seen that the interpolated and the real depletion lines differ a lot for the elevation zones B and C, but not that much when the whole basin is considered. Since no snow was occurred after April 13, the snow depletion curves are obtained by linear interpolation technique. The monitoring of the snow covered area and the change in the snow line depending on the elevation is done for month April (Figure 5).
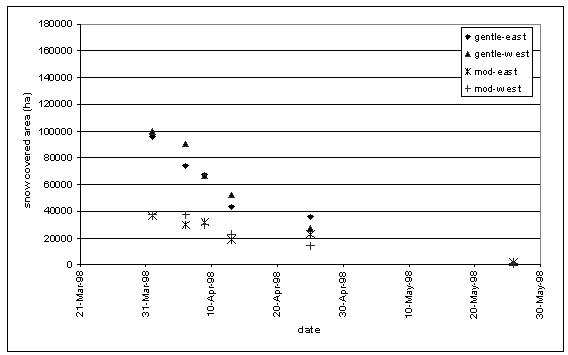
In addition to elevation, aspect and slope also play an important role in modelling snowmelt runoff. In this study, four aspect classes (north, east, south, west) and three slope classes, namely gentle (<22.5o ), moderate (22.5 o-45 o) and steep(>45 o), are obtained from topographic maps and integrated as a separate layer into the GIS. By superimposing the layers of river basin, aspect and slope classes and snow cover charts, the snow coverage per elevation, aspect and slope classes and river basin are determined.
Due to the solar illumination and shadowing, north-south difference
in the snow melting is expected (Baumgartner et al., 1997). The north-south
directional difference in the snow melting is also observed in the month
of April for Karasu basin. By generating a time series of snow charts,
slope and aspect dependent depletion curves are derived as shown in Figure
6a, 6b, 6c.
From these figures the following conclusions can be drawn:
a) The south-facing facets having gentle slope have
the largest number of pixels as far as the snow cover is concerned and
also they exhibit the fastest depletion in the snow cover area compared
to the north-facing-gentle slope facets. By contrast north and south facing
facets having moderate slopes have similar pattern, snow cover and depletion
in the snow cover area are concerned.
b) The west and east facing facets having gentle
slope have larger number of pixels of snow cover area than the corresponding
facets having moderate slopes. Further east-west facing facets having moderate
slope exhibit faster depletion than the east-west facing facets having
gentle slope.
c) All steep slopes and cliffs have a nearly similar
pattern.
d) The north and south facing facets have larger
number of pixels of snow cover area than the corresponding east and west
facing facets.
Table 1. Snow cover area percentages for the subcatchments and whole
catchment
|
|
Total | ||||||||
|
|
|
|
|
|
|||||
| Area % |
|
|
|
|
|
|
|||
| Date |
|
||||||||
| 1.April.1998 |
|
|
|
|
|
|
|
|
|
| 6.April.1998 |
|
|
|
|
|
|
|
|
|
| 9.April.1998 |
|
|
|
|
|
|
|
|
|
| 13.April.1998 |
|
|
|
|
|
|
|
|
|
| 25.April.1998 |
|
|
|
|
|
|
|
|
|
| 26.May.1998 |
|
|
|
|
|
|
|
|
|
So far, in this paper the effects of the topographic parameters; elevation,
aspect and slope in deriving the snow depletion curves being one of the
main input into SRM for computing the snow melt runoff, have been discussed.
Especially for semi- cloudy/cloudy days if the effects of these parameters
are considered in determining the snow covered areas, the snow-melt runoff
predicted from the models can be improved.
Conclusion
The capabilities of an integration of RS image processing, GIS analysis and a hydrological model are discussed in this paper. The classification inorder to separate the clouds from the snow is done through the theta classification algorithm. Snow cover accumulation and ablation charts based on time series evaluations of NOAA-AVHRR data in the image processing module are handled. Temporal and spatial analysis in the GIS, as e.g variations of snow-line elevation, elevation and aspect-slope dependent snow coverage within the basin, and elevation and aspect-slope dependent snow cover depletion curves, are done. This study reveals that local topographic elevation, slope and aspect have significant influence on the snow cover area and its depletion pattern.
The importance of the temporal resolution of the images in determining the snow cover areas through image processing is discussed. The needs for applications in hydrology are a high temporal and a moderate spatial resolution data systems. In determining the suitable images, the importance of the in-situ data is also seen. Since the snow is measured at low altitudes and once or at most twice in a month creates a lack in terms of in-situ data. Therefore it is recommended that especially during the melting season, the snow depth, snow water equivalence must be measured as well with the other meteorological data at many locations by automatic stations and compared with passive microwave satellite image results using SSM/I data.
References
1) Barnes J.C., Smallwood M.D. (1975). Synopsis of current satellite
snow mapping techniques with the emphasis on the application of near-infrared
data. Operational application of satellite snow cover observation.
Ed. A. Rango. Workshop held at South Lake Tahoe, California, 18-20 August,
NASA Sp-391,199-213.
2) Barrett E.C., Bailey J.O., Beaumont M.J.,Kelly R.E.J. & Herschy
R.W. (1994) A study on operational snow mapping and monitoring by satellite,
Remote Sensing Unit, Bristol University.
3) Baumgartner M., Gabriela M.A., 1997. Remote Sensing, geographic
information systems and snowmelt runoff models-an integrated approach,
Remote Sensing and Geographic Information systems for Design and Operation
of Water Resources Systems (Prooceedings of Rabat Symposium S3, April 1997),
IAHS Publ. No.242, pp 73-82
4)Duda, R. O., P. E. Hart, (1973) Pattern Classification and Scene
Analysis. Wiley Interscience, New York.
5)Lucas R. and Harrison H. (1990), Snow observation by satellite.
Remote Sensing Reviews, 4,285-348.
6)Martinec J., A. Rango & R. Roberts, (1994): The Snowmelt-Runoff
Model (SRM) User's manual. (ed. by M. F. Baumgartner). Geographica Benensia
no. P29, Dept of Geography, Univ. of Bern, Switzerland.
7)Maxson b., M. Allen, T. Szeliga, 1998, http://www.nohrsc.nws.gov
8)Şorman Ü., 2000, Application
of Snowmelt Runoff Model (SRM) in Turkey using Remote Sensing and Geographic
Information Systems. Case study: Eastern Part of Turkey (Karasu River Basin).
4th Internation Workshop on 'Application of Remote Sensing in Hydrology'
(Prooceedings of Santa Fe Symposium, Nov 4-6,1998), pp 223-234.
Dr. Zuhal Akyurek
METU Geodetıc and Geographıc Informatıon Technologies Dept.
METU, Civil Eng. Dept. Water Resources Lab.
06531 Ankara-Turkey
Tel: 90 (312) 210 24 81
Fax: 90 (312) 210 12 62
e-mail: zakyurek@metu.edu.tr