*Note: The views expressed in this paper are solely the author's and do not necessarily reflect those of the Department of State or the US government.
The crisis in Kosovo provided an opportunity to apply GIS (geographic information systems) tools for managing the international response to a complex humanitarian emergency. The challenge was to create a common geospatial and data-organizating framework for a variety of national government agencies, international organizations, and non-governmental organizations (NGOs) working to address a multiplicity of problems, ranging from destruction of housing and infrastructure to residual hazards posed by landmines and unexploded ordnance.
The geospatial data framework for the international response in Kosovo had two components:
In Kosovo, most of the geospatial foundation data was developed by the US National Imagery and Mapping Agency (NIMA), which produced a "humanitarian planning map" that was designed for wide releasability using a standard commercial GIS format. The humanitarian planning map included layers for elevation, transportation, populated places, hydrography, administrative boundaries, etc. Equally important, NIMA produced a gazetteer-in both digital and hard copy form-of standardized place names, which helped clarify a confusing melange of Serbian and Albanian variants with often erratic spellings.
These data were refined and released in successive versions, each more inclusive, accurate, and detailed than the last. For example, road layers were initially released at 1:250,000 and later at 1:100,000 scale. The incremental data improvements were important, because they gave relief workers reasonably good data to work with early on, rather than waiting months for the release of "perfect" data.
In Kosovo, the task was made somewhat easier by the long gestation period for the crisis. The humanitarian planning map and data were the product of many months of work by NIMA and proved essential by providing those dealing with difficult crisis response issues-whether in US government or international agencies or NGOs-a common reference for geospatial data.
We can divide the Kosovo crisis into three phases:
The following are some examples of ways in which GIS was applied in each of these phases.
During the build-up, an escalating series of killings, bombings, house burnings, landmine explosions, etc. prompted various international efforts to reduce violence, relieve tensions, and alleviate suffering.
On the humanitarian side, the primary actor was the United Nations High Commission for Refugees (UNHCR), which operated with a constellation of NGOs and other humanitarian organizations. On the security side, an OSCE-sponsored mission called the Kosovo Verification Mission (KVM) took over in late 1998 from an earlier international coalition attempting to reduce tensions and violence.
A small Department of State team went to Pristina in November 1998 to promote the use of GIS as an efficient means of organizing and sharing information among the various organizations operating in Kosovo. The basic idea was that both the humanitarian and security agencies were collecting data for their own operations, but each also had a strong and legitimate need to know some of the information collected by the other. Why not put certain types of security and relief data in a standard database that was georeferenced and hence could be used in a GIS and shared?
For example, the UNHCR was collecting information on housing conditions and food and medicine needs in villages throughout Kosovo. KVM was collecting information on landmine reports and security incidents. UNHCR teams needed to know where hazards had been reported, and KVM needed information on conditions in villages and where relief teams were operating.
Working with these organizations, the State team designed some prototype databases, using a standard commercial relational database software, that could be easily integrated into a GIS. The team worked with KVM and UNHCR officials to assess what data they were already collecting and create a database structure that mirrored that, making as few changes as possible. It was recognized that the teams doing data collection would be using low-tech means-i.e., clipboards and ballpoint pens. If the data collection system was too complicated, no one would use it. Unfortunately, the subsequent deterioration of conditions forced both UNHCR and KVM to remove their operations from Kosovo. But the concept did stick, and some of it continued to be implemented. For example, the land mine monitoring team adopted the proposed database and continued to populate it with data and use it in a GIS.
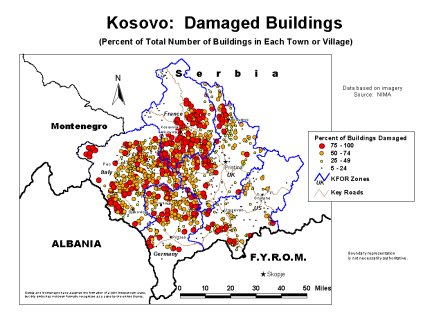
After KVM and UNHCR were forced to curtail their operations in Kosovo, information demands changed. For example, policymakers were very interested in estimates of damage to housing in towns throughout Kosovo. Imagery analysis provided a way to make such an assessment. Village by village, NIMA analysts could count houses where there was visible damage. This information was provided as a spreadsheet that included lat/long coordinates. This was a labor-intensive operation, and the data were released incrementally; ultimately, the full file had about 2,000 locations.
Putting this data into a GIS provided a very striking picture of the devastation that was occurring as ethnic Albanians were driven out and their homes destroyed. Graphic displays of the data-prepared using a GIS-were very helpful in presenting the issue to the public, as well as for helping different agencies plan for future relief efforts.
When the combat phase ended and hundreds of thousands of refugees began returning quickly to Kosovo, it was time to put into practice what had been previously discussed regarding an adequate survey of infrastructure damage-the UN's Rapid Village Assessment.
The UNHCR coordinated with other relief organizations on what should go into the survey questionnaire. The goal was to gather enough data to be operationally useful, but not so much that data input by field survey teams would become too onerous a task to be implemented. To facilitate data entry and minimize errors, the paper form carried by field teams was designed to correspond exactly with the structure of the relational database into which the information would be entered and compiled in Pristina.
A primary concern was to make an accurate survey of housing reconstruction needs. For this purpose, the survey form used a 5-level categorization of housing damage-ranging from little or no damage to destroyed or unrepairable-and provided a set of simple illustrations that helped explain the criteria for each category. In addition to counting the number of houses in each category in each village, the teams were asked to provide other data on condition of water supply, electric power, school and health care facilities, presence of displaced persons, relief agencies, etc.
For the GIS to work, locations needed to be accurately geocoded-a challenge because of the problems with place names already mentioned. Despite the great value of the NIMA gazetteer, it had not provided a unique identifier for each of the villages; this had to be created.
The UNHCR devised a 5 digit system, called a P (for place) code. The first two digits referenced the municipality (opstina) in which the village was located, while the last three digits assigned a unique number to each locality. The p-code allowed an accurate link between the database and the GIS regardless of which GIS software was being used by an organization. The p-code model pioneered in Kosovo is now being applied elsewhere (e.g., Mozambique).
In practice, the system worked quite well, and the UNHCR was able to issue an initial report covering some 500 villages within 10 days of dispatching the first field survey teams.
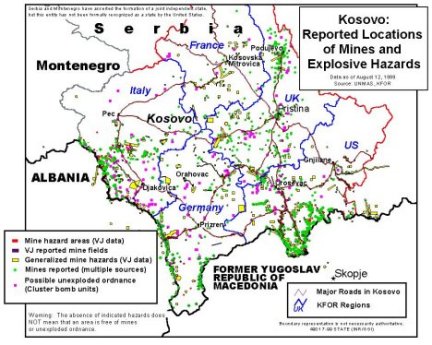
Another concern in Kosovo was the location of landmines and unexploded ordnance. In addition to the previously mentioned database of landmine reports, the NATO military coalition force (KFOR) received data on minefields provided by the former Yugoslav army, as well as information on target sites for NATO cluster bombs. These were put into a GIS and made available to civilian humanitarian organizations.
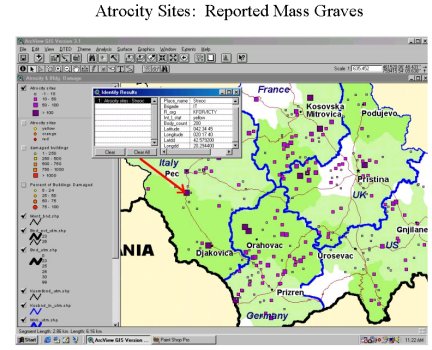
Another area where GIS is starting to be used is in forensic investigation of atrocity sites. This application has been somewhat slower to be realized, but awareness of its potential value is growing. Among other advantages, applying the data in a GIS in has been particularly effective in displaying data visually, showing both spatial and temporal patterns of war crimes, and informing the public about what happened.
The experience in Kosovo has provided some useful lessons for applying a GIS-based data management system in a complex humanitarian emergency. Among them: