California Integrated Waste Stream Profiles: GIS Application |
| Abstract | Introduction | Project History | GIS | Summary |
Presented By: Darryl L. Petker P.E., Doug Ralston and Steve
Barnett
California Integrated Waste Management Board, California Environmental Protection Agency
Submitted Title: California Integrated Waste Stream Profiles GIS Application
Submitted Abstract: The Integrated Waste Management Board (Board) is responsible for reducing the generation and improving the management of solid waste in California. A primary mandate is gathering and analyzing information for public information and program compliance. To this end, the Board has developed a comprehensive Web based database management system known as the California Waste Stream Profiles (Profiles).
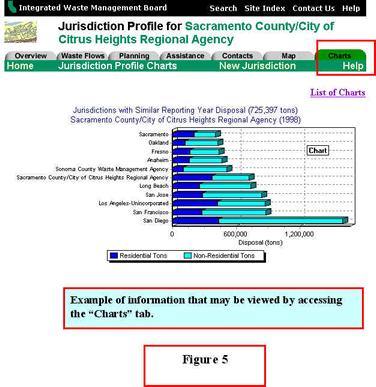
This summarized information is drawn from 15 of the Board’s strategic databases and presented via the World Wide Web. This data reports on three primary areas of Board responsibility: 1) local jurisdictions, 2) solid waste facilities and 3) waste material types. This information is displayed in text, pictures, GIS maps and layers, tables, lists, charts, graphs and links to other web resources.
The Board uses the Esri ARC View GIS, MapObjects and MapObjects IMS products and Arc Explorer to build mapping functionality. The GIS maps portray data on jurisdictional boundaries, solid waste facility locations and specific material recycling centers as well as related geographic layers for roads, cities, and counties.
The California Integrated Waste Management Board (Board) makes complex and sensitive decisions regarding solid waste issues in California and therefore requires accurate and up-to-date information. To assist in the decision making process, the California Waste Stream Profiles (Profiles) system was developed to provide summarized information from many data sources in a centralized and visual format. A major component of the Profiles is the availability of maps through Geographical Information Systems (GIS) software. These maps graphically display considerable amounts of information allowing quick interpretation of data from many data sources.
Use of Esri software allowed the creation of an interactive product that is easily distributed and accessible by staff and external clients. Using MapObject (MO) components allowed the creation of custom GIS applications that work within the Board’s existing in-house development environment. The addition of the MapObjects Internet Map Server (MO IMS) provided the ability to integrate the GIS application with existing internet services, and deploy an easy to use interface to Board staff and external customers.
| Background | The Challenge | The Solution |
The California Integrated Waste Management Board is one of six statewide government organizations that make up the California Environmental Protection Agency (Cal/EPA). The Cal/EPA is charged with protecting the public’s health and safety and the environment. The five other Cal/EPA organizations include the Air Resources Board, Office of Environmental Health Hazard Assessment, Department of Pesticide Regulation, Department of Toxic Substances Control, and State Water Resources Control Board.
The Board is composed of six appointed Board Members, serving four-year terms, and approximately 475 staff. Four members are appointed by the Governor, one is appointed by the President Pro Tem of the State Senate, and one is appointed by the Speaker of the State Assembly. The Board members meet in public to develop policy, provide guidance, and make decisions regarding statewide and local solid waste issues. Issues include statewide and local recycling rates, waste reduction programs, education, certified used oil centers, grants and loans, enforcement and remediation actions, and permits for landfills, waste transfer stations, and tire storage facilities. The Board must plan for and react to the changing needs of the California waste stream while attempting to meet regulatory mandates such as protecting the public’s health and safety and reducing the amount of waste disposed. In order for the Board members to make informed decisions, information must be readily accessible to them.
The State of California comprises 163,707 square miles and is divided into 58 counties, and over 450 cities/towns. It has the 8th largest economy in the world with over 30,000,000 people calling it home. California is geographically diverse with mountain ranges, vast agricultural areas, numerous industrial and high tech centers, and large metropolitan areas such as San Francisco, Los Angeles, San Diego, Sacramento, and Orange County. Climate variations range from 4 inches/year of rainfall in the desert areas to 50 inches/year on the north coast. Population densities vary between 2 and 17,000 people per square mile. These variations in the make up of California create a waste stream that is very diverse and constantly changing, and that is a challenge to manage. Californians generated an estimated 60 million tons of solid waste in 1999 at a rate of approximately 10 pounds/person/day.
A snapshot of the number of solid waste activities and facility types that the Board works with includes the following:
Activity/Facility
|
#
|
|
| Permitted Active Solid Waste Facilities | 531 | |
| Active Notification Operations | 147 | |
| Permitted Active Landfills | 182 | |
| Composting (Active – Facilities /Operations) | 110 | |
| Active -Notification Tier / All Operations | 209 | |
| Solid Waste Disposal Sites (CIA -sites) | 2587 | |
| Waste Tire Facilities | 444 | |
| Active Tire Facilities (Permitted/ Excluded) | 263 | |
| Permitted Tire Facilities | 66 | |
| Certified Used Oil Centers | 2623 | |
| RMDZ (Recycled Markets Development Zone) | 40 | |
Total (March 2000) |
7202 |
In addition to serving the Board’s information needs, the Profiles not only serve the Board but also provide information for many stakeholders, partners, and customers. Organizations that can use Profiles include the Governor’s Office, the California Legislature, federal agencies, other state agencies, regional and local governments, non-governmental organizations, environmental and citizens groups, and individual citizens.
The Challenge
The responsibility for developing and implementing plans and strategies for both reducing the amount of waste disposed and ensuring the safe disposal of the remaining waste resides with the Board. For years the Board has struggled with ways to collect, store, maintain, and display the large amount of information that it collects regarding solid waste.
Previously, a request for information from a Board Member or the Executive Office may have required staff a few hours to a few weeks to develop and present. The reason for the lengthy response time was that standard procedures had not been developed for responding to requests for information. In some cases, requests for the same or similar information would be repeated months apart requiring additional staff time to prepare basically the same report or information. The time required to answer the second request may not have been as long as the first, but considerably longer than was necessary. There was not an effective tool for displaying information for repeatedly asked business questions. Decision-makers were frustrated with the response time to inquiries and staff became frustrated with repeated requests for similar information. The Board wanted and needed a tool or system that would present summarized information in an up-to-date, easy to use, and visual manner.
Development of such a tool presented several challenges. First it was necessary to determine who the customers are, and identify their information needs. Second, it was critical to confirm the information needed was available or develop a plan or method to collect information that was not currently available, to meet the needs of the users. Quality control of existing or new information must also be incorporated into the new tool. The third challenge was to build on and/or adjust the current information technology (IT) structure to allow for the collection and display of information needed to answer business questions. Finally, it was clear that it would be critical to implement a culture change within the organization (management and staff) that would support a new system of data management. These four areas are discussed in the solution section of this paper. It was clear early on that meeting these challenges was not a simple task and would require a vision, executive support and teamwork.
The Solution – California Waste Stream Profiles (Profiles)
The solution had to be based on the business needs of those that would use the new application. There was a clear need for displaying considerable amounts of information on all aspects of solid waste. The solution had to be easy to use, up-to-date, and accurate. To ensure that the information displayed would be understood, it was decided that the data would be shown in text, charts, tables, graphs, and maps using GIS (geographic information systems).
It was recognized early on that the Profiles would be a challenging project requiring management support, numerous resources, and cross-organizational cooperation. With those concerns in mind the Board leadership recommended the initial phase of Profiles be limited to two areas of information to maximize the effort to develop a quality product. It was decided that the initial phase of the project would display information on: 1) Waste Stream Characterization and Diversion Rates for Jurisdictions, and 2) Waste Tire Issues. Both of these provided an excellent opportunity for the use of GIS to graphically display data for the decision making process.
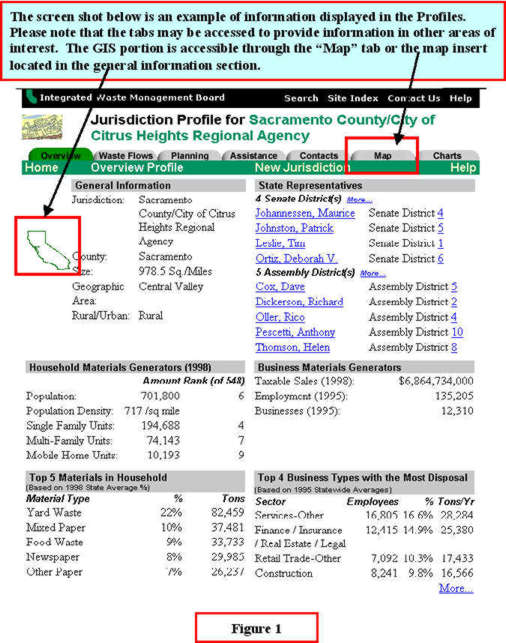
The information in Profiles is grouped into three areas: 1) Jurisdictions; 2) Facilities; & 3) Materials. The three information grouping areas were created by reviewing Board functions and responsibilities and attempting to develop simplified categories for the considerable amounts of the information contained in the Board’s source databases. Each of these three areas provides information in a predetermined format or screen shot. While in the jurisdiction area, the viewer may select different jurisdictions, but the same business questions will be answered. The same holds true for the facilities and materials areas. As an example, a viewer could inquire about either San Diego or Sacramento Counties. While the data supplied to the viewer will relate directly to their inquiry, the format for displaying the information will remain constant. This consistency is aimed at achieving the easy to use goal discussed earlier.
The following discussion addresses issues addressed in designing, developing, and implementing the Profiles.
The Resources - One factor critical to developing a solution to the challenges was to determine what resources were available for this project. The Board had determined that this project was a priority and was willing to dedicate the necessary resources. This project was to be completed in-house in approximately a one year time frame with various program staff temporarily assigned to work on this project. Funds were made available for additional computer equipment, training, and software when necessary.
Project Team - The project was led by the Office of Management Reporting Systems (OMRS), which was tasked with responsibility for developing the content, appearance, and feel of the Profiles. The OMRS unit was formed using three staff with a combined total of 35 years of experience in solid waste issues and extensive experience in CIWMB programs.
Working closely with the OMRS was the Information Management Branch (IMB) staff who developed the structure and applications for placing the Profiles on the Internet. It was decided early that IMB was a critical part of the Profiles team and would be responsible for maintaining the IT structure of the Profiles. IMB dedicated considerable resources in providing qualified staff to assist on the project. The core IMB group consisted of approximately 5-7 staff who would work on the project as their particular skills were required. IMB staff combined for a total of approximately 50 years of IT experience. The close working relationship between IMB and OMRS provided the platform to share ideas and solve problems, which was critically important in the development of the Profiles.
Development Model - Once the initial two focus areas for the Profiles were decided upon the development process was initiated. First, several meetings were held to determine the method that would be used to establish what information needed to be placed in the Profiles. The initial development team decided that using a preliminary screen shot as a starting point for discussion with the other team members would be useful. Nothing in the initial draft was considered sacred and anything could be changed. The OMRS staff developed preliminary screen shots based on past information requests and GIS information. Those preliminary screen shots were plotted on paper to a size of about 24" X 36" and then placed up on a board or wall in the brainstorming session with staff. Staff then reviewed the preliminary screen shot and worked on what and how to best summarize and organize the information for the GIS maps and data sheets. A variation on the affinity diagram exercise was used for these iterative brainstorming sessions as staff wrote directly on the screen shots or wrote on assorted colored post-it notes, applying them to the enlarged screen shots.
Groups of 4-7 staff gathered and discussed the information displayed, how it was grouped, missing information, suggestions, and comments. OMRS staff organized, facilitated, and made notes on these sessions. Notes from each session were left on the poster, which was left up for each group to review. Staff were encouraged to drop by and read other notes or add to the list. It was stressed that there was an open door policy with regard to comments on the Profiles. Involvement of the program staff also helped to get buy-in on the purpose and content of the Profiles. At first it took four to five iterations to develop a completed screen shot. With the experience of the first sessions it should now take no more than three sessions for development of future profiles topics.
OMRS staff took full responsibility for organizing the notes and preparing the next version of the screen shot. The idea was to limit the amount of work required of program staff, freeing them up to think about the needs of the project while realizing that they were only being asked for their input.
To insure that staff would not get too carried away with developing an unrealistic wish list for information, it was explained that the final design could require them to perform additional work in the form of data collection and maintenance for their program. This thought seemed to be all that was necessary to ensure that staff only suggested pertinent information.
Business Test - Once the Profiles information had been organized and developed into an acceptable format, the IMB group had to build and install the web-based system. When this was completed, three business tests were conducted. The design team met after each business test to discuss lessons learned and correct problems, if any. The first business test was conducted by those directly involved in the design and development of the Profiles and comprised approximately 10-12 staff from OMRS and IMB. The second business test was conducted on the Board Intranet from a temporary location and consisted of the first test group and the addition of 45 program staff that helped provide input and business needs information in the development stage. The third business test occurred when the Profiles were officially unveiled to the entire CIWMB staff for their use and comment. This consisted of approximately 400 staff. Valuable information was gained and comments received on all three tests.
Culture Challenge - The Profiles team would have to address the way that staff conduct business regarding the collection, maintenance and use of information. Development of Profiles will require all staff to realize that entering and maintaining information will require a change in the way they are accustomed to performing their jobs. Staff and first line supervisors are used to manually inputting information as time allows. As the potential of the Profiles is realized and demand by internal and external customers for accurate and timely information increases, the current methods of data entry and maintenance will have to be modified.
Quality Control - Quality Control is a major component of the Profiles system. The accuracy of the information displayed in GIS, charts, graphs, and text must be constantly checked for accuracy. OMRS has implemented a Quality Control program that will help maintain and improve the quality and appearance of the information displayed. The program incorporates daily and bi-weekly inspections. Those inspections are then used as the basis for quarterly and semi-annual performance reports. Those reports will be shared with management and used for project planning.
The Board maintains an up to date Information Technology structure. All work performed to create the technical applications were created internally. The Board uses the following client server configuration to implement the Profiles system.
Presentation Layer:
Business Tier:
Data Tier:
Geographic Information Systems (GIS)
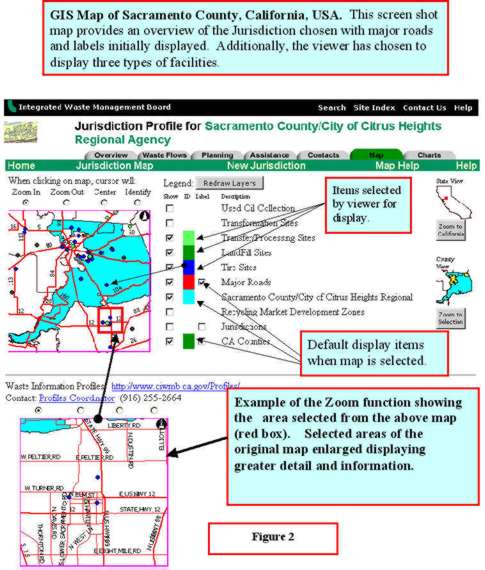
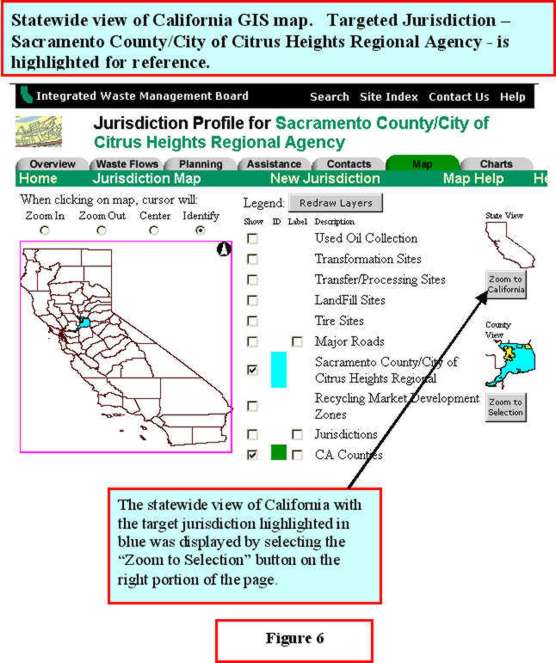
The Profiles mapping component is built using Esri MapObjects and MapObjects Internet Map Server within the Visual Basic development environment. The mapping solution is designed to display spatial information regarding the selected jurisdiction/site being viewed within the Profiles system.
A map session is initiated when the map tab is clicked on one of the Profiles information display screens. The underlying Active Server Page makes a call to the map program and passes the identification number of the current jurisdiction/site. The map program locates the identified jurisdiction/site, creates a new layer "on the fly", and zooms to the extent of the jurisdiction/site. The map program sends to the client browser the requested map and HTML required to interact with the map software. Once the initial map is displayed, the map software becomes generic in nature and allows the client general mapping functionality such as zoom, identify and layer display.
The Profiles map software has some interesting features not formally found in MapObjects applications or the Internet Starter Applications.
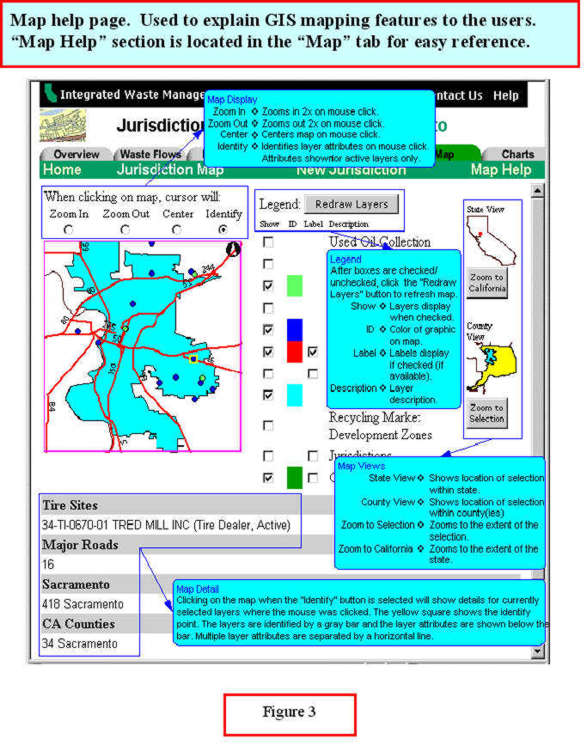
The map has the ability to turn on/off the layer label display independent of the label display.
In an Internet environment the map must keep track of each clients specific settings. Instead of passing all map settings as hidden items in the HTML display the settings are stored in an internal MDB format database and a record key is returned with the HTML display.
A collection (array) is used to associate actual field names with alias field names for display in the legend and identify.
Map labels are kept at a constant display size (regardless of the display extent) by computing the symbol height as a function of the map display height. [ Roads.DefaultSymbol.Height = Map.Extent.Height / 30 ]
Panning is accomplished by using a center algorithm. Instead of having four or more buttons to identify pan direction, the map allows the client to click anywhere on the map and the map display will center on the click coordinates.
The Profiles mapping goal is to provide an interface that allows the client immediate productive use of the map without the need for help screens and training.
The Profiles were placed on the Internet on April 18, 2000, and have been very well received by Board Members and staff, stakeholders, partners, and customers. Emails and telephone calls are received on a daily basis commending the Profiles for the information displayed in the text and GIS portions. Internally, numerous staff have commented on the significant time saving as a result of using the Profiles system. Considerable encouragement has been received requesting expansion of the Profiles to display additional areas of information.
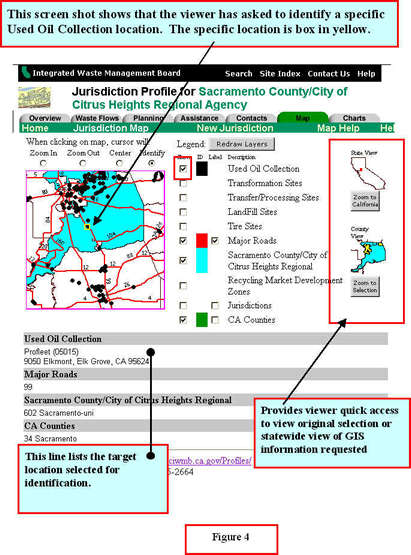
The Profiles have been shown to local, regional, and other California agencies, which have praised the depth of information, quality, and appearance. The GIS portion of the system has turned out to be a major point of interest to anyone who views the site for the first time. There is always interest in being able to view information displayed in a geographical manner. The ability of the GIS functions to zoom in and out of an area, highlight and identify specific solid waste locations and/or facilities such as landfills, transfer stations, tire disposal sites, certified used oil collection centers, has turned out to be one of the systems biggest assets.
The Profiles may be accessed at www.ciwmb.ca.gov/Profiles/
We would like to extend our thanks to the Board Members, Management and staff of the California Integrated Waste Management Board for their help and assistance in the development, testing, and successful implementation of the Profiles and its placement on the World Wide Web (Internet). We would like to thank Rubia Packard, Maureen Goodall, Julie Trueblood, and Meirve Davey for their patience and assistance in providing suggestions for this paper.
Additionally, special thanks are extended to John Sitts and Chris Allen for their efforts in the design, development, and implementation of the Profiles.
Darryl L. Petker P.E. Senior Technical Waste
Management Engineer
Office of Management Reporting Systems
California Integrated Waste Management Board
8800 Cal Center Dr., Sacramento 98526
(916) 255-2664
Doug Ralston, Manager
Information Management Branch
California Integrated Waste Management Board
8800 Cal Center Dr., Sacramento 98526
(916) 255-1060
Steve Barnett, Information Systems
Analyst/GIS Coordinator
Information Management Branch
California Integrated Waste Management Board
8800 Cal Center Dr., Sacramento 98526
(916) 255-2628
Darryl L. Petker P.E., Office of
Management Reporting Systems (916) 255-2664
California Environmental Protection Agency
California Integrated Waste Management Board
8800 Cal Center Drive
Sacramento, CA 95826