Jan Bjurström and Jonas Tornberg
Animation and visualization in design of a new transportation system
in existing urban environment using GIS and Virtual Reality
ABSTRACT
Please click on image to see full view...
A virtual city was built to visualize how an aerial cableway may solve an increasing demand
for public transportation in the city of Göteborg (Gothenburg). This model was made at
Chalmers University of Technology, school of Architecture and was optimized for a 3D Cube
environment.
The 3D model was created using Arc/Info 7.2 including the Grid submodul, ArcView GIS 3.1
and TerraVista 2.1 from Terrex Inc. (an Esri partner). The latter was used to generate the
virtual reality model. The 3D Cube was used to present the scene in virtual reality, and makes
it possible to take a tour with the virtual cableway.
It is believed that the integration of GIS and VR technology will become an indispensable tool
for planners in the near future. A 3D Cube makes it possible to test and experience various
planning alternatives, especially in an urban environment but also in other planning situations.
Keywords: GIS, Virtual Reality, VR, Aerial cableway, 3D-Cube, City 3D model
1. Introduction
The transportation demand increases substantially in the city of Göteborg, the second city of
Sweden having roughly 750,000 inhabitants. One reason is that the different Universities are
expanding, and the University Departments is located in various parts of the town. There is
also a demand for transportation between the University departments and the related
knowledge-based industry and housing. This scattering being intentional to transform
Göteborg to a "City of Know-How". However, the traffic nodes have to be connected by a
transportation system carrying students, teachers, and even goods. There are already today
difficulties in connecting the faculties and related functions physically. The traffic demand
here is calculated to reach the level of 10,000 persons per day in a couple of years.
A good transport system will support efficient use of the big investments within the university
sector.
The map in Figure 1 shows the existing and planned locations of Universities in Göteborg.
The Göta Älv River separates the town in two parts. One of the new big knowledge nodes has
started to grow on the north shore while the bulk of the existing University nodes are located
south of the river. The nationally important transports on the river must not be disturbed and it
needs headroom of at least 45 meters. New "bridging" has to be constructed adding
accessibility to the existing tunnel and two bridges in the central area.
Please click on image to see full view...
Figure 1. The university locations in the center of Göteborg result in a demand of a good
transportation system in the future.
2. A transport system proposal
Göteborg is asking for a transport system offering a complementary rapid and safe movement
of people and goods between growing nodes in the town. An aerial cableway may be one kind
of system that meets the requirements of the future urban infrastructure.
The passenger capacity must exceed the level specified to other public transport systems, i.e.
2,000 persons per hour. With a great number of cablecars seating six persons will satisfy this
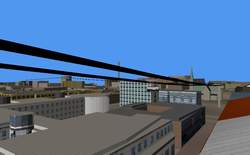
requirement. Top capacity is calculated to be 4,000 persons per hour. With a car speed of 5
m/s the travelling time between the two nodes, main campus of Chalmers and Chalmers
Lindholmen, will be just above 15 minutes, independent of when the trip starts (Figure 2).
The system is specified to stand for a wind speed of 28 m/s, equivalent to the existing bridges.
The cableway system will most likely be leveled high to reduce the number of pylons and
when crossing the river exceed the required headroom of 45 meters. The transport system will
if possible operate automatically to a great extent.
To design and implement a new transport system in an existing urban environment requires
extensive information and establishing support for the idea. The possibility to study and
experience the system in a virtual reality gives unique prospects for agents to influence and
participate in the design process. It is an example how new technology may be crucial for the
development and implementation this type of innovative proposals.
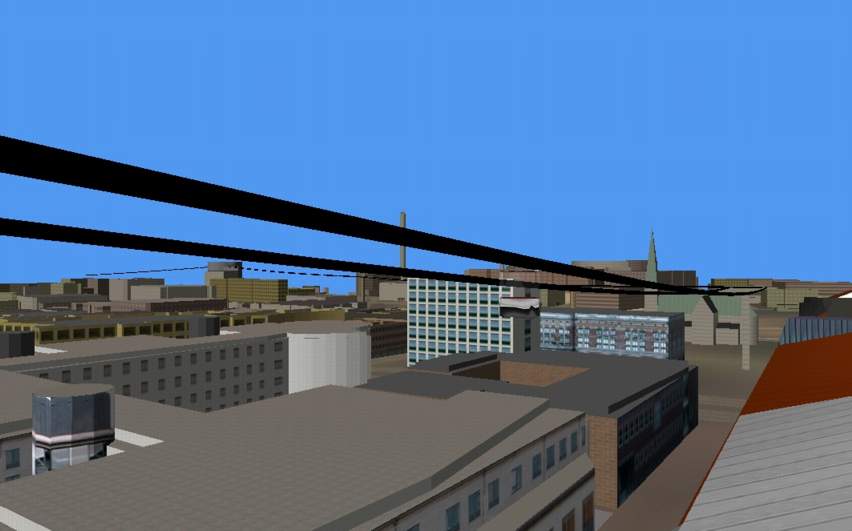
Please click on image to see full view...

Figure 2. The proposal to the aerial cableway connects the universities.
3. Creating the 3D scene
The softwares used to prepare input data and to create the 3D scene were: Arc/Info 7.2
including the Grid submodule, ArcView GIS 3.1, TerraVista 2.1 Terrex Inc.(which is a
partner to Esri).
The input data has been imported to Arc/Info and was prepared in order to suit the model
generator, TerraVista. The virtual reality (VR) model was adapted for presentation in a 3D
Cube. This device is a room with the dimensions 3x3x3 meters, having 5 projectors that
display up to 50 million polygons per second on the walls and on the floor (Figure 3). A
64-processor Silicon Graphics Onyx machine with high potential graphics equipment drives the
3D Cube.
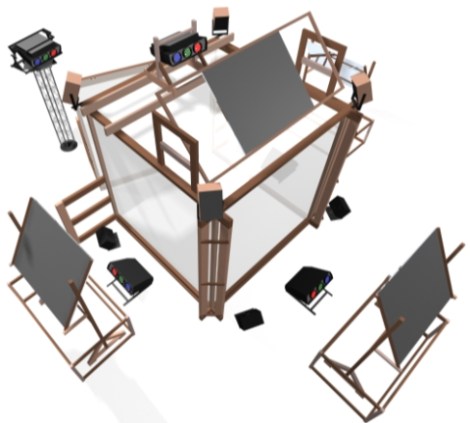
Please click on image to see full view...
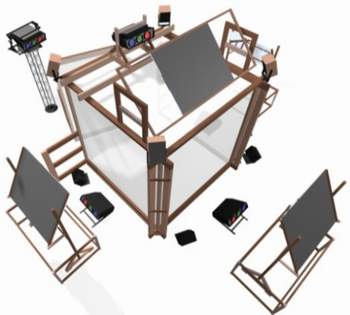
Figure 3. A Silicon Graphics Onyx II Computer, equipped with three separated graphic pipes run all five projectors. Each
pipe has two graphic channels thus enabling the system to run six projectors. Each projector shows the image in
stereo, so when wearing synchronized "Shutter Glasses" the viewer gets a completely immersive stereoscopic
view of the world. An electromagnetic field in the 3D-CUBE corresponds with sensors on the person, to track his
or her position. Certain "peripherals" such as gloves and pointers then make interaction with the environment
possible. The separately running Lake sound system simulates distance, direction and character of the sound to
give a complete illusion.
Opposite to many urban VR projects, which are lacking 3D data, we had to generalize the
roof objects of the buildings to reduce the amount of data to be able to get good performance
in the 3D Cube. The city of Göteborg has been mapped in high resolution with
photogrammetry giving x,y coordinates with z values. The study area is about 5x6 kilometers.
The length of the cableway will be approximately 8 km. Originally 66000 objects in the
building database was generalized to 7000 objects, which gave a fairly good city center
model. Other datasets used in the project are: DTM, orthophoto, water (we are working in a
seaport), streets, railways and the aerial cableway.
The TerraVista software version 2.1 (November 1999) was not ready to create 3D buildings
out of 2D polygons GIS data. The partnership with Esri had however the intention to
develop better treatment of 2D GIS data, even for the buildings data type. An extension,
Automatic Culture Generator (ACG), was under development and for this project we had the
opportunity to use an early beta version to be able to rise the buildings to the height above
ground, which was stored as an attribute to these polygons.
4. Source data
The following datasets were used to create the 3D scene:
-Digital Terrain Model (DTM), from points in a 12 meter grid (ASCII file).
-Roof lines having elevation value (AutoCad vector file).
-Water polygons without elevation (Shape file).
-Streets and railways without elevation (Shape file).
-Orthophotos, resolution: 0.25 meter (georeferenced TIFF image).
-Aerial cableway, 3D linear features digitized in ArcView GIS (3D Shape file).
In our situation we had to focus on a generalized scene that should cover a big part of the city.
The reason for this was that the objective was to create a possibility to experience the aerial
cableway from a virtual journey within the cablecar it self, as well as watch it from any
optional location.
The 3D model was built in a manner so that the buildings had flat roofs and random textures
on the outside walls. The shapes of the buildings were limited to have flat roofs because their
origin of 2D GIS data. That means that a roof as easy as a rectangle in shape is build as a box.
The height of the box is determined from the roof's height value and calculated from it's lowest
point in the terrain.
The TerraVista software is very tolerant software regarding its treatment of input data and
how it should appear in the terrain. There was however some modifications needed to be able
to put the buildings on the terrain.
The principle used is to drape features on the digital terrain model to produce 3D plots (just as
was possible in early version of Arcplot) . Some features such as buildings must have relative
heights, which means height above ground level, while other features such as the cableway
(3D linear data) must have absolute heights. Streetlines were widened to one width for all,
because the real width was not in the database. These features were draped on the DTM
without any special respect to horizontal appearance of the streets, which however is possible.
The preparation of the datasets included:
- In Arc/Info, the DTM is imported to a Grid and exported as an ASCII Grid file, which
can be imported to TerraVista.
- Buildings had to be built from roof polygons, and polygons had to be created from the
rooflines. Arc/Info's CLEAN command produces the polygons very easy. Then the
roof heights were estimated from one of the lines describing the roof. Buildings in
Sweden sometimes have flat roofs, but (unfortunately in this case) this is not the
prevailing type. There are also many smaller machine rooms for fans, elevators etc.
on the roofs that must be removed. The roof heights were retrieved from
the lowest line around the roof. This gave us the walls in real heights and most
buildings have a very realistic size appearance. There are of course some buildings
with large non-flat roofs that has to be modified in the 3D model, in order to
recognized. These buildings are often churches. One particular building close to the
cableway, the Fish Church ("Feskekörka" in the local dialect) which is a fish market in
a well known building, needed to look real (Figure 4). Elevation values had to be
recalculated from absolute heights to relative heights above ground. The relative
heights were calculated from the absolute heights minus the lowest ground level,
which was found in the DTM Grid. The roofs are cleaned from all features but tall chimneys.
The tall buildings and chimneys are not common in our city, but is very important as landmarks
when moving in the model or viewing a 2D perspective of the city. Adjacent roof polygons were
dissolved if their height was approximately the same. This is an important step to do,
because when the 3D buildings are build, all linear features get a wall down to the
ground and the number of such walls must be minimized to increase performance
when traveling in the VR environment in the 3D Cube. All the roof preparations were
done in Arc/Info. Then the roof polygons were converted to shape files.
- A water polygon does not need any elevation values. TerraVista makes water surfaces
from the lowest elevation found in the DTM in the area that are occupied by the water
polygons.
- Streets and railways are draped on the DTM. A uniform width was assigned to these
features. In this operation, it would have been preferable if a width attribute had been
available.
- The aerial cableway was digitized in ArcView GIS as a 3D linear feature, having
elevation values of absolute heights.
When building the 3D scene, you work with a project in TerraVista. The datasets are imported
to the project and can be used on all their extent, or in an area specified interactively.
This is convenient when testing new data or when investigating new ways of interpreting the data.
When the 3D scene is build, you can work with single objects in 3D-design software, such as
Multigen Creator [Infoga Referens]. This was important here to be able to refine the model.
Building the city in the way we did, gave us a huge model in very short production time, but
there are no details like phototextures on the walls or modeled complex roofs.
Please click on image to see full view...
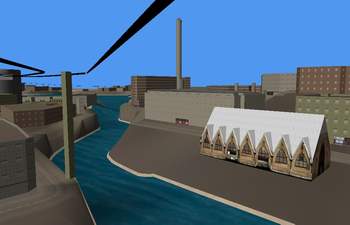
Figure 4. The well-known Fish Church is a fishmarket. More detail needs to be assigned to
such special landmarks. Even if most buildings are generalized to boxes, the model will
become much more realistic for a viewer if certain features look relatively "real".
5. Conclusions
The combination of geographic information systems and virtual reality technology will
become more natural in the near future. There will definitely be a high demand for versatile,
integrated GIS/VR models. For instance, the public has a chance to experience the possible
effects of the implementation of various construction plans and thereby give their opinion on
the best alternative. At some stages in a planning process, architects might prefer a
generalized model, since a lot of detail can "disturb" the planner who may lose the focus from
the building projects. In other projects, or for education, it might be better with a refined
model with photo textures and better 3D design to get the virtual city look real.
7. Acknowledgements
Our special thanks to Prof. Hans Bjur, Chalmers and Research manager Anders Hagson,
Chalmers for encouraging support. Thanks also to Prof. Björn Klarqvist, Chalmers and Dr.
Mats Söderström, Odal for helpful reading and Richard Clark, Terrex Inc. for special software
support.
References
Published
Reneland, M and Hagson, A (1996). PRT System in Swedish Towns - Conditions given by
and consequences for town structure and townscape
Terrex Terrain Experts Inc. (1999). TerraVista User's Manual V2.0
Internet
www.arch.chalmers.se
www.medialab.chalmers.se
Authors:
Jan Bjurström
Department of Urban traffic and Land use
School of Architecture
Chalmers University of Technology
SE-412 96 Göteborg, Sweden
phone: +46 - (0)31 772 2429
fax: +46 - (0)31 772 2394
e-mail: jan.bjurstrom@arch.chalmers.se
Jonas Tornberg
Department of Urban traffic and Land use
School of Architecture
Chalmers University of Technology
SE-412 96 Göteborg, Sweden
phone: +46 - (0)31 772 2433
fax: +46 - (0)31 772 2394
e-mail: jonas@arch.chalmers.se
Presented by Jonas Tornberg, M.Sc.C.E at the 2000 Esri User Conference

Chalmers University of Technology
SE-412 96 Göteborg, Sweden
Phone: +46 - (0)31 772 1000
Fax: +46 - (0)31 772 3872