Truck traffic in Southern California is projected to increase by 40 percent by year 2020. Los Angeles is the leading county in truck collisions, representing 28 percent of truck accidents in the state. Economic growth can be sustained if an efficient transportation is in place meaning goods are delivered safely, on time, and at a minimal cost.
A GIS-based modeling process for commercial goods transport was performed to provide an estimate of risk along the transport corridors of Southern California, specifically I-710. The model uses accident data, annual average daily traffic, and truck traffic as major variables in the risk analysis.
According to a report by the Southern California Association of Governments, the population in California is forecasted to increase by 43 percent from 1994 to 2020 while the regional volumes of commercial goods, by more than 40 percent. These increases will have a significant impact in the mobility and econoy of the region, especially Los Angeles County, which currently ranks among the most congested areas in the country. The economic viability of Southern California, which is home to some of the world's busiest ports such the Port of Long Beach, Port of Los Angeles, and the Los Angeles Airport can be sustained only if an efficient transportation system is in place.
The increasing goods movement activities and demand for “just-in-time” delivery of goods present greater challenge to improve the reliability and efficiency of the transport system. An efficient system would entail delivery of goods safely, with minimal delay, and at a minimal cost. It is to be noted that about half of total urban transport costs are related to freight (Czerniak, 1998).
Road accidents are one of the main causes of non-recurrent traffic delays which increase transportation costs. When these accidents involve trucks, the cost is further increased due to delays in delivery of goods, and its impact on other motorists, especially when an accident happens in interstate and major highways.
The purpose of this paper is to present the accident-related risks involved in commercial goods transport along the Southern California freeways, specifically I-710.
I-710, also known as the Long Beach Freeway is a 27-mile freeway in Los Angeles County. It runs through the cities of Long Beach, Compton, Lynwood, South Gate, Bell, Commerce, and Monterey Park. I-710 serves most truck traffic from the Ports of Long Beach and Los Angeles.
The study utilized GIS Arcview and Arc Info. The latter is used primarily for data conversion purposes. Most analytical work involving traffic and accident data was done in Arcview. Data on the California freeway system were obtained from the Southern California Association of Governments (SCAG). These data are in GIS Arcview format. The 199 traffic and accident data were collected from the California Department of Transportation (Caltrans), District 7. Accident data were scanned and converted into Geographic Information Systems (GIS)-compatible database.
The risk associated with the transport of goods, specifically hazardous materials, is traditionally expressed as the product of probability of accident and consequence of such an accident. This may be applied to evaluate the risk of transporting commercial goods in general. However, the estimation of risk using this method is complicated by the lack of comprehensive segment-based data on commercial goods transport.
The occurrence of an accident may be influenced by various factors such as the frequency of shipment or truck traffic volume, travel distance, highway geometry, temporal condition, and human factors. Accident rates at intersections and high volume truck exits, entrances and interchanges are of interest because they tend to be higher in those areas. Other indirect factors that may affect accident occurrence is the condition of infrastructure. For commercial goods in general, consequence may be defined in terms of commercial operating vehicles, drivers, passenger cars, cargo and other. The impacts of serious accidents involving commercial goods include volumes of cargos undelivered or destroyed, or goods not delivered on time.
Other definitions of risk of being involved in an accident include the ratio between the number of crashes associated with a specific set of conditions and the amount of travel performed under the same conditions (Cerrelli, 1997). This study will focus on the latter definition of risk. In which case, risk is defined as the ratio between the number of accidents involving large trucks and the truck vehicle miles of travel or more commonly termed accident rate. The probability of accidents involving large trucks are also presented to provide a preliminary estimate of risk using the first definition of risk. However, no attempt is made in this paper to assign a consequence value so as to complete the risk estimation process.
The analysis consists of determining the accident patterns and estimating the accident rates along I-710. The accident rate, expressed per million vehicle miles, is estimated using the following equation:
R = (A x 1,000,000)/(VMT x 365)
where:
R = accident rate per million vehicle miles
A = number of accidents per year
VMT = vehicle miles of travel
An accident is assumed to be a discrete, random event which can be modeled using Poisson distribution. Thus, the probability of an accident involving truck may be expressed as:
P(X = truck) = 1-(P(X = not truck)
P(X = not truck) = (R^X/X!)exp^(-R)
Movement of commercial goods may be affected by the occurrence of an accident on the road. The impact of an accident may vary depending on the severity of an accident as well as the type of goods moved. Various scenarios may include an accident involving another vehicle or an accident involving trucks carrying non-perishable, perishable, or dangerous goods. In the former case, the truck experiences delay although it is not involved in an accident. In the latter, the truck not only experiences delay, and depending on the severity of the accident, experience massive delay, waste of goods as in the case of perishable goods and gaseous substances, may cause driver or other motorist’s injury or fatality, and in worst scenario, where the truck carry hazardous substances
In California, fatal truck accidents represent around 11 percent of total fatal accident in the state and injury accidents represent 4.3-4.6 percent of total injury accident based on a five-year data representing 1995-1999. In 1999, Los Angeles is the leading county in injury truck collisions, with 28 percent of all injury truck collisions in the state followed by San Bernardino County with 8 percent and Orange County with 6 percent. On fatal truck collisions, Los Angeles County again led the state with 14 percent of state fatal truck collisions, followed by San Bernardino County with 11 percent, and Sacramento with 7 percent based on the 1999 data.
Speed is the primary collision factor for fatal and injury accidents where truck driver is at fault representing 37 percent of all factors. Other significant factors include changing lane unsafely (16 percent), improper turning (13 percent), and auto right-of-way (10 percent).
In 1999, a total of 2,217 accidents were recorded by the California Highway Patrol along I-710. This is around 5 percent higher than the 1998 data and 10 percent higher than 1997. The 3-year data showed that around 33 percent of all accidents involved large trucks. There were twelve accidents involving hazardous materials. The 3-year data showed 28 fatal accidents with 35 fatalities and 1472 injury accidents with 2234 persons being injured. In 1999, there were 881 involvement of large trucks in 490 accidents or around 22 percent of all accidents. Eleven fatalities and 748 injuries were recorded in accidents involving large trucks
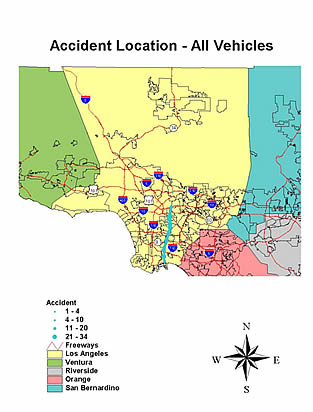
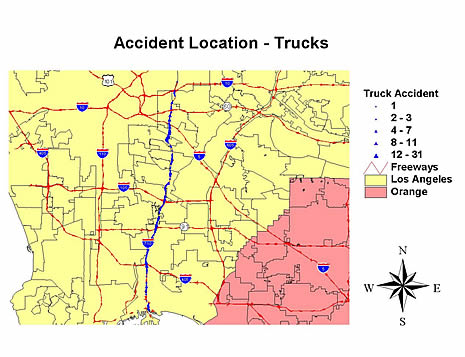
The 1999 frequency distribution of all accidents along I-710 is shown in Figure 1 while the distribution of accidents involving large trucks are shown in Figure 2.
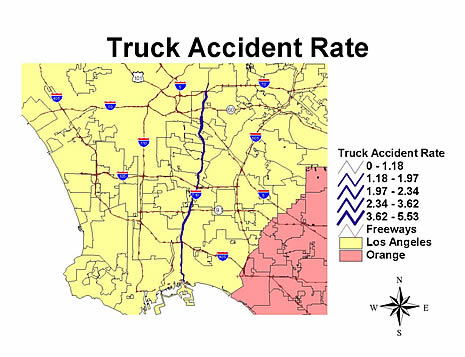
The highest accident rates and the highest probabilities of accident occur northbound, near and at the junction of I-5. These also appear to be the most critical section southbound. Based on probability analysis, there is 90 to 95 percent probability of an accident involving truck in this segment. If the truck traffic volume is used as a measure of consequence, these segments would still be the most critical, followed by the northbound segment at the junction of Route 91 or Artesia Freeway. This junction, as well as the junction of I-10 (northbound), and the junction of Route 1 or Pacific Coast Highway (northbound) have 80 percent probability of experiencing an accident involving large trucks.
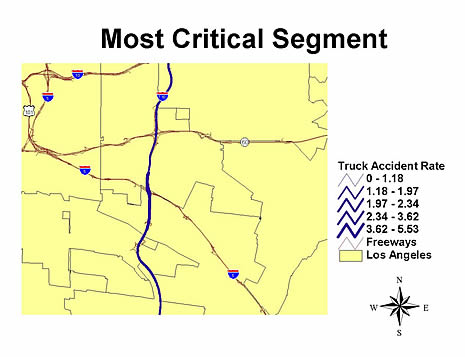
Other critical sections are southbound at Whittier Boulevard interchange, southbound at the junction of I-405 or San Diego Freeway, and northbound at the junction of Route 60 or Pomona Freeway. The distribution of accident rates involving large trucks are illustrated in Figure 3. The most critical freeway segment in terms of accident rates is shown in Figure 4.
An estimation of risks associated with the transport of commercial goods provides the necessary information in decision-making and in devising measures that could minimize the occurrence of an accident and its impact. The effectiveness of operational and design policies that will promote safe and cost effective transportation of goods while limiting environmental, safety, and health impacts can be evaluated using the results of risk analyses. Measures involving design practices (e.g., stopping sight distances) or use of dedicated truck lanes in areas with high truck traffic may be identified based on the results of risk analyses. Risk estimates can also be used to assess emergency response programs involving highway accidents.
This paper presents preliminary estimates of risks of transporting commercial goods and identified the most critical freeway segments along I-710. This is an ongoing research which will include analysis of I-5 and I-10 freeways. GIS Arcview was used to perform risk analysis using estimates of accident rates and accident probabilities.
Czerniak, Robert J., “Urban Goods and Freight Forecasting Conference Opening Session and Acknowledgments”. Conference Proceedings. Urban Goods Movement and Freight Forecasting Conference Two, San Antonio Texas.
Cerelli, E.C., Fatal Carsh Involvements – What are the Odds? Research Note. National Highway Traffic Safety Administration. July 1997.
Southern California Association of Governments. Regional Transportation Plan, Draft Report. 1998.
State of California Department of Transportation, 1998 California Transportation Plan, Statewide Goods Movement Strategy, August 1998.
The authors would like to thank METRANS for funding this study, CALTRANS District 7 and SCAG for sharing their data, Rayapu Varma for his assistance in data processing, and Marisa Crosman for her help in facilitating data collection.
Gulraiz Cheema, Graduate Research Assistant
California State University, Long Beach