Critical U.S.- Mexico Borderland Watershed Analysis, Twin Cities Area Of Nogales, Arizona And Nogales, Sonora
By Laura Margaret Brady, Floyd Gray, Mario Castaneda, Mark Bultman, and Karen Sue Bolm
US Geological Survey and Arizona Department of Environmental Quality
US Geological Survey and Arizona Department of Environmental Quality
The United States - Mexico border area faces the challenge of integrating aspects of its binational physical boundaries to form a unified or, at least, compatible natural resource management plan. Specified geospatial components such as stream drainages, mineral occurrences, vegetation, wildlife, and land-use can be analyzed in terms of their overlapping impacts upon one another. Watersheds have been utilized as a basic unit in resource analysis because they contain components that are interrelated and can be viewed as a single interactive ecological system. In developing and analyzing critical regional natural resource databases, the Environmental Protection Agency (EPA) and other federal and non-governmental agencies have adopted a “watershed by watershed” approach to dealing with such complicated issues as ecosystem health, natural resource use, urban growth, and pollutant transport within hydrologic systems.
These watersheds can facilitate the delineation of both large scale and locally important hydrologic systems and urban management parameters necessary for sustainable, diversified land-use. The twin border cities area of Nogales, Sonora and Nogales, Arizona, provide the ideal setting to demonstrate the utility and application of a complete, cross-border, GIS-based, watershed analysis in the characterization of a wide range of natural resource as well as urban features and their interactions. In addition to the delineation of a unified, cross-border watershed, the database contains sewer/water line locations and status, well locations, geology, hydrology, topography, soils, geomorphology, and vegetation data, as well as remotely sensed imagery. The project goal is to develop a GIS database that is widely accessible to the general public, researchers, and the local land management community with a broad range of application and utility.
Introduction
The twin border cities area of Nogales, Sonora and Nogales, Arizona, provide the ideal setting to demonstrate the utility and application of a complete, cross-border, GIS-based watershed analysis of the characterization of a wide range of natural resource and urban-industrial components and their common interactions. The twin border cities area, referred to as “Ambos Nogales”, typifies the condition of a number of border areas with its assortment of water issues, including surface- and groundwater contamination, inadequate water supplies inequitably distributed, flash floods, and endangered riparian habitat (Ingram and others, 1994). Population growth, nearing 250,000 (Sanchez and Lara, 1992), exacerbates already depleted ground water sources. Poor waste containment infrastructures threaten existing and future water resources as well as create health-related concerns based on environmental exposures encompassing physical, chemical, and biological agents. With these and other socio-economic issues occurring across the United States - Mexico border area, the region faces the challenge of integrating aspects of its binational physical and political boundaries to form a unified or, at least, compatible natural resource database upon which to execute a viable international management plan. The objective of this paper is to provide an overview of the newly generated watershed-based framework and key natural resource components, attributed features, and analytical tools database developed for a GIS-platform. In some cases a transnational, compatible database needed to be created, e.g. topographical base, hydrological and geological maps. Each section focuses on issues and solutions associated with the gathering and integrating of transnational geospatial data and preliminary results from the databases are presented.
The construction of the database is accomplished in three phases: (1) GIS database compilation and development; (2) creation of an integrative platform, available in Arc/Info and ArcView, that provides a means for new input of scientific research and enables integrated watershed management; and (3) presentation of the database as a means of continuing education, community outreach, and distribution to decision makers and the general public. This study is the result of an informal data-sharing partnership between the U.S. Geological Survey, Arizona Department of Environmental Quality (ADEQ), The University of Arizona’s Udall Center and others. The goals of the partnership are to combine and focus the resources of our investigative teams, thereby to eliminate unnecessary overlap in the execution of this study, and to make the database as widely available as possible through the combined publication and web-accessibility of the government and university community. Some possible release mechanisms for the data are a deliverable spatial data archive CD-ROM or an interactive data-warehouse Internet site.
Major issues in the Nogales wash, including natural resource degradation, technical data acquisition and manipulation, and logistics of publication and presentation, can be addressed with an integrated watershed GIS:
1) Pollution leaks; inefficient water usage and inadequate sewage containment characterize the urban infrastructure of this semi-arid region. Bacteriological contamination, seepage of nitrates, heavy metals and volatile organic compounds (VOCs) from industrial sites into soils and underground water supply have been identified in the waters of both cities (Varady and Mack, 1995). Surface and groundwater hydrological models to determine runoff and sub-surface flow paths could help to pinpoint sources of pollution.
2) Lack of digital data in a unified framework; the data concerning watershed, demographic, environmental, and infrastructure characteristics are not currently available in a contained geospatial database.
3) Current border maps are fragmented; most of the existing digital and analog copy datasets originating from either country terminate at the border, and resource policy decisions are implemented without much regard for impact on adjacent populations. Geospatial inconsistencies occur due to differences in mapping, cartography, resolution and time periods of creation. The international nature of the project increases our challenge of a regular GIS project involved with integrating databases due to national, linguistic, and physical barriers (Wright and Winckell, 1999).
4) Lack of communication; transborder data sharing between research and educational facilities and policy makers is lacking. This situation is partly due to the binational/bilingual nature of the region. A graphic digital representation of the factors influencing the transborder watershed could aid in enhancing understanding by sidestepping communication barriers and could be the first step in water quality conflict resolution.
Location of the Study Area
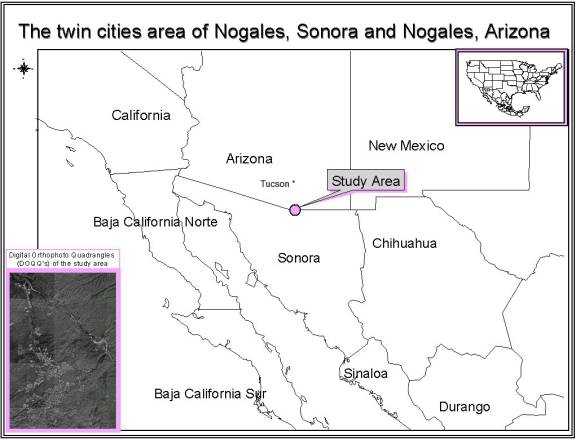 Figure 1: Location map depicting the study area of the twin cities of Nogales, Arizona and Nogales, Sonora.
 The twin cities of Nogales lie astride the Arizona-Sonora section of the U.S. – Mexico Border (fig.1), at Latitude 31.34, Longitude –110.94, approximately 110 km south of the metropolitan area of Tucson, Arizona (fig. 1). The area lies within the Sonoran Desert, locally occurring in a dissected, foothills-like setting that contains the headwaters and main reach of Nogales Wash. Several northeast flowing tributaries, Las Canoas, Mariposa Canyon, Potrero Creek, Alamo Canyon and Pesquiera Canyon flow directly into the main reach of the Nogales Wash system. Within the study area, specified geospatial components such as stream drainage, mineral occurrences, vegetation, wildlife corridors, and land-use can be analyzed.
The average high and low maximum temperature range is 93.9 - 27.4 *F (34.4 - -2.5 *C) with only an average of 17.66 inches (44.9 centimeters) of annual precipitation, almost half of which occurs in the summer months of July and August (http://www.wrcc.dri.edu/summary/climsmaz.html). These semi-arid conditions indicate a potential water shortage as well as limit pollution dilution potential (Liverman and others, 1999).
GIS Database Development
The purpose of this section is to describe the production of unified, consistent, digital, geographically registered cross-border watershed data to accurately portray the transboundary nature of the selected hydrologic sub-region. Binational water resource priorities were identified and systematically mapped to characterize transboundary relationships. Basic geologic and hydrologic data, in digital and analog format, that would be compatible with a GIS were initial research for the Nogales study area. The physical setting of the region is herein described using a watershed approach to aid in dealing with such complicated issues as ecosystem health, natural resource use, urban growth, and pollutant transport within surface and ground-water hydrologic systems. The procedures for delineating watersheds and creating stream networks are described in the following section, along with descriptions of the created transboundary watershed.
Hypsography
One of the projects preliminary accomplishments has been to generate integrated elevation data from the U.S. and Mexican sources in order to create a watershed wide topographic surface and derived themes such as slope, aspect, shaded relief, hydrologic features, and hypsographic contours (fig. 2). Due to projection, resolution and contour interval differences between datasets, the integration across the border was difficult. Digital Elevation Models (DEM’s) were acquired and concatenated for the areas of interest; resolution of the grids is 90 meters. The USGS National Elevation Data set (NED) (http://edcnts12.cr.usgs.gov/ned/) supplied 30-meter resolution DEM’s that were resampled to a 90-meter grid cell size for that portion of the analysis that occurred on the U.S. side of the border. The Mexico DEM’s were purchased through Resource Science, Inc. (http://www.resourcescience.com). These data came packaged in 3-arc-second projection using decimal degree units and were re-projected to Universal Transverse Mercator (UTM) and also resampled to a 90-meter resolution to achieve a uniform projection and grid cell size. Topographic contour lines were generated within Arc/Info from this newly created DEM, at a contour interval of every 100 meters to portray the elevation (fig. 2). The lowest elevation in the Ambos Nogales is 1,060 meters above sea level, and the highest peak is 1,710 meters. The average elevation is approximately 1,278 meters. The topography reveals the typical mountain and intervening valley structure of the Basin and Range Province. There is a regional North-Northwest structure grain in the area, typical of this portion of SE Arizona. The basins have varying amounts of alluvial sediments transected by stream channels.
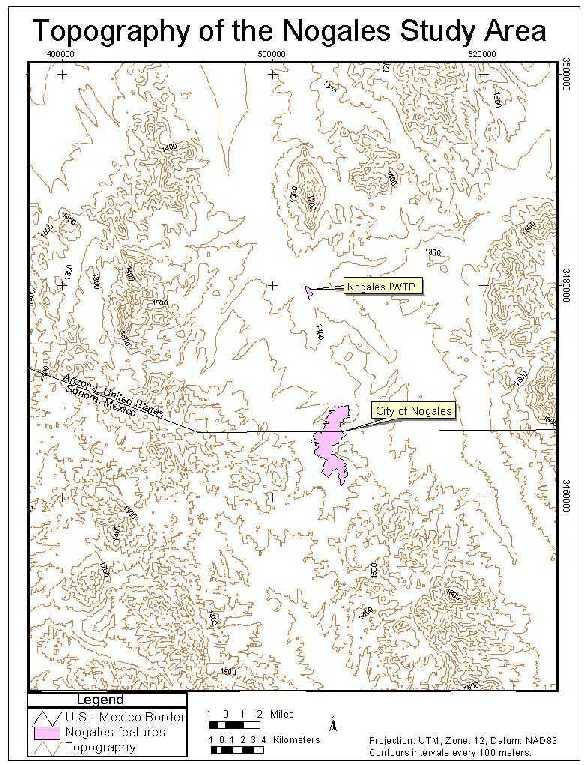 Figure 2: Elevation contours of the Nogales area at a 30-m. resolution.
 Watershed Delineation
A watershed is defined as a catchment basin, which is delineated topographically and drained by a stream system; it is a hydrological unit used for the planning and management of natural resources (Brooks and others, 1997). Components of a watershed include water, topography, soils, rock, vegetation, wildlife, climate and land-use. Stream networks were created from the newly generated DEM, using the GRID module of Arc/Info and compared to lower resolution vector datasets in the area. The point at which the Nogales wash enters the Santa Cruz River was determined to be the outlet of the Nogales wash tributary system and that point was used as a pour point in the watershed’s delineation. This was done using a script developed in ArcView (see Appendix), which utilizes the 90- meter resolution DEM and the previously created flow direction and flow accumulation grids to calculate the catchment basin of that specified point. The result of this digital construction of transborder watershed delineation identifies the areas of land within Mexico that are immediately contributing to the pour point or headwaters located in the United States. Figure 3 shows the newly delineated watershed area overlain with generated stream networks and a 1:250,000-scale digital raster graphic (DRG) of the area. The Nogales Wash watershed covers 235 square kilometers, just under half of the area is in Mexico. The topography is the major factor that identifies this basin boundary. Drainage in the basin is asymmetric and clearly focused along the eastern edge.
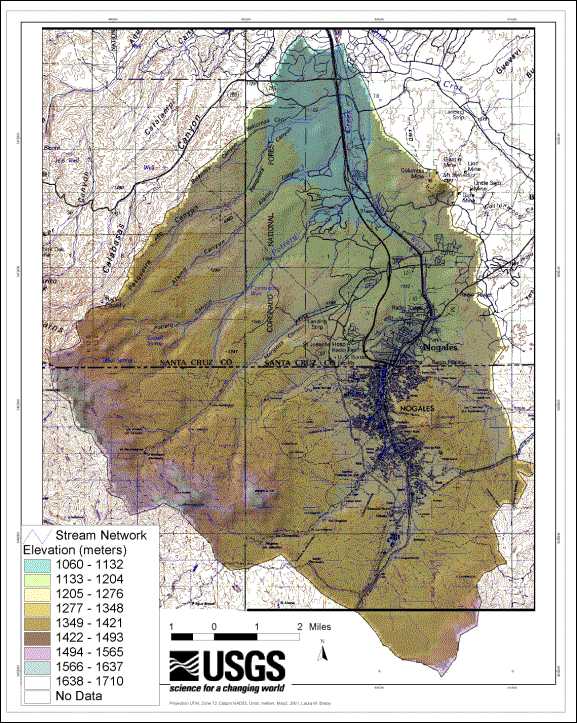 Figure 3: Nogales Wash watershed delineation portrayed in a hill shade relief of a DEM.
 Hydrography
The stream flow emanating from a watershed is the result of many integrated influences of the watersheds physical composition. The amount of water received though precipitation and how this water is distributed though space and time defines the watershed itself. The Nogales wash is a gaining stream, which receives water from the local groundwater table in addition to discharge from the border area upstream. The Santa Cruz River, which is located in southern Arizona and northern Sonora, Mexico, flows into the Gila River and then into the Lower Colorado River. There are numerous problems associated with the understanding of the Santa Cruz River system’s surface flows and groundwater/surface water relationship (US-EPA, 1996).
The Nogales Wash is a nested tributary within the Santa Cruz River drainage basin and has been identified as major sources of possible contaminant contribution to water in the downstream reach of the Santa Cruz River. Utilizing the predefined Upper Santa Cruz watershed boundary in the United States, identified by the U.S. Environmental Protection Agency in the “Surf Your Watershed” Website (US-EPA, 2000), pour points were identified and Upper Santa Cruz transborder watershed was created utilizing the Script in ArcView (see Appendix). Figure 4 depicts those stream networks generated within the GRID module of Arc/Info from the newly generated DEM, associated with the Upper Santa Cruz transborder watershed and the placement of the Nogales Wash watershed within.
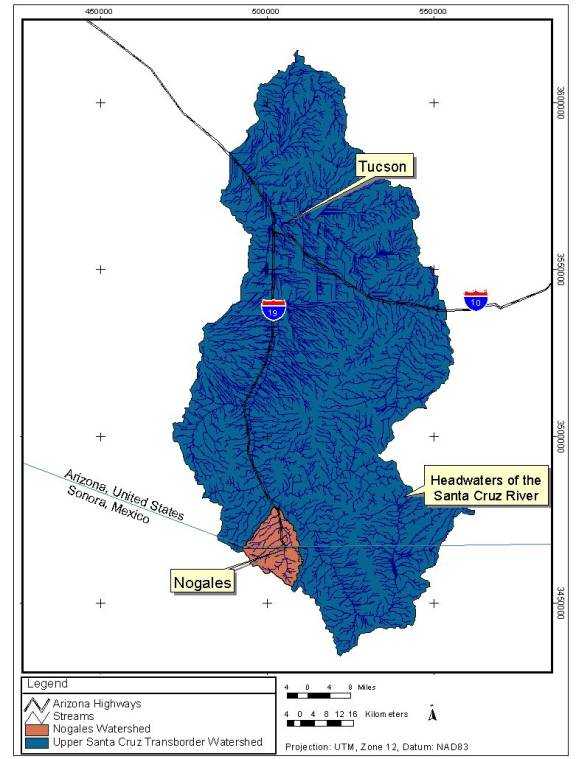 Figure 4: Map showing the relationship of the Nogales Watershed to the Upper Santa Cruz River Transborder Watershed.
A Digital Elevation Model was used to model the effects of land topography in the watershed delineation by identifying the streams, flow direction and a catchment perimeter or that portion of the land that effects a given outlet (Maidmont, 1993). Surface runoff flow paths are from ridge tops. Runoff flows from watershed boundaries toward the dissecting channels in which the flow accumulates toward the downstream discharge point. The surface runoff from each segment of land surface has its own unique flow path and velocities by which it reaches any designated point. In the Nogales area, during periods of surface runoff, the two sources of stream flow are surface runoff and groundwater discharge. When precipitation stops, the surface runoff rapidly ceases.
A surface runoff flow direction map (fig. 5) was generated in Arc/Info’s GRID module, from a 90-meter resolution transborder Digital Elevation Model (DEM), for purposes of study and analysis of water quality. As depicted, surface flow runs predominantly north and northeast.
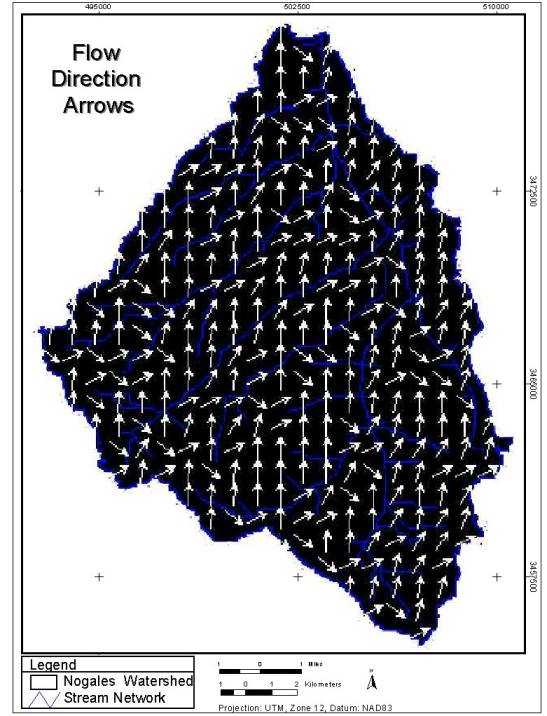 Figure 5: Flow direction map of the Nogales Watershed as depicted by a DEM in Arc/ Info’s GRID module.
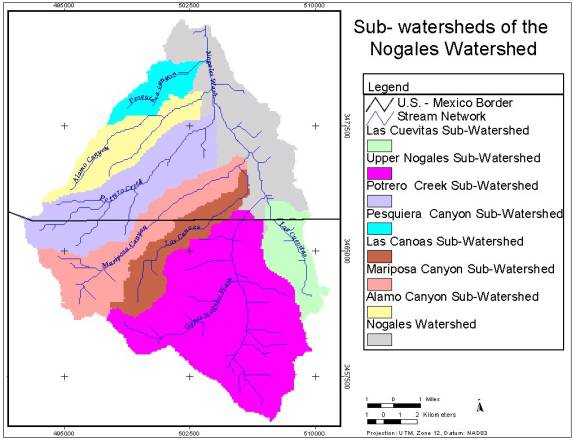 Figure 6: Sub-watersheds of the Nogales Watershed defined by streams and DEM input.
 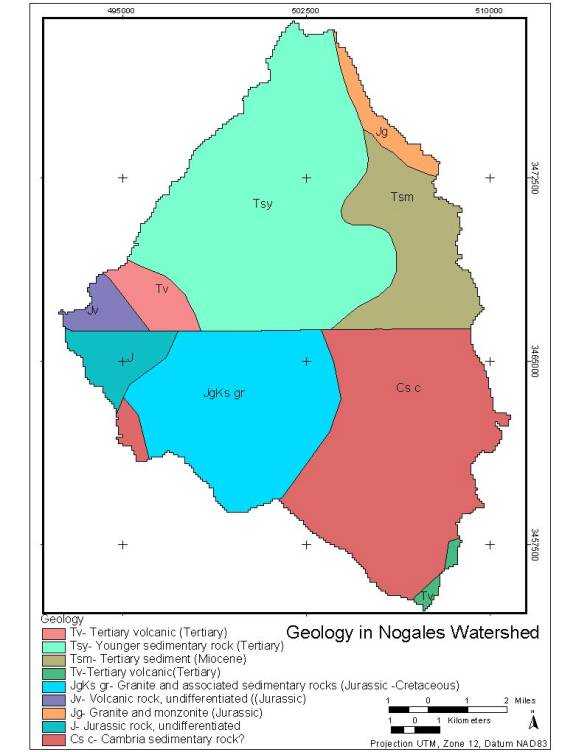 Figure 7: This image depicts the discrepancy in resolution and nomenclature encountered at the international border by combining geologic maps of State of Arizona at 1:1,000,000 (Reynolds, 1988) and the country of Mexico at 1:2,000,000 (Ortega-Gutierrez and others, 1992).
 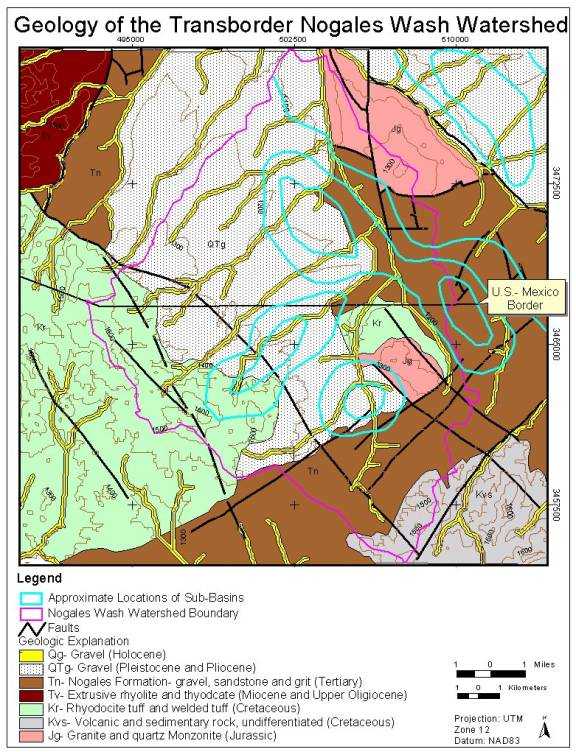 Figure 8: Preliminary geologic map derived from larger –scale base maps (Consejo de Recursos Naturales no Renovables, 1967; Gettings and Houser, 1997) and Landsat 7 TM imagery in the Nogales Wash watershed.
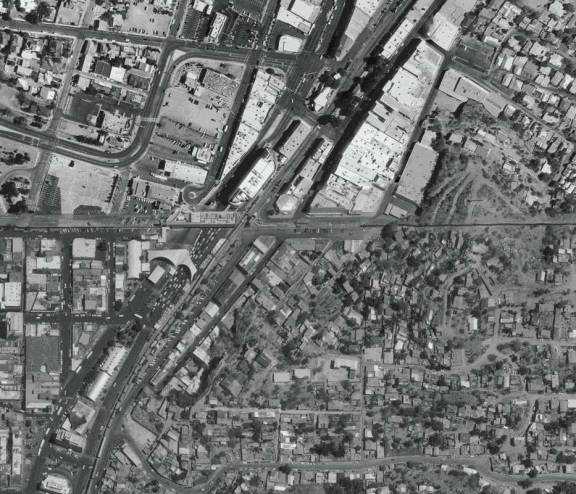 Figure 9: Aerial photograph taken of the central commercial downtown Ambos Nogales, portraying the border crossing which overlies the tunnel containing the Nogales Wash.
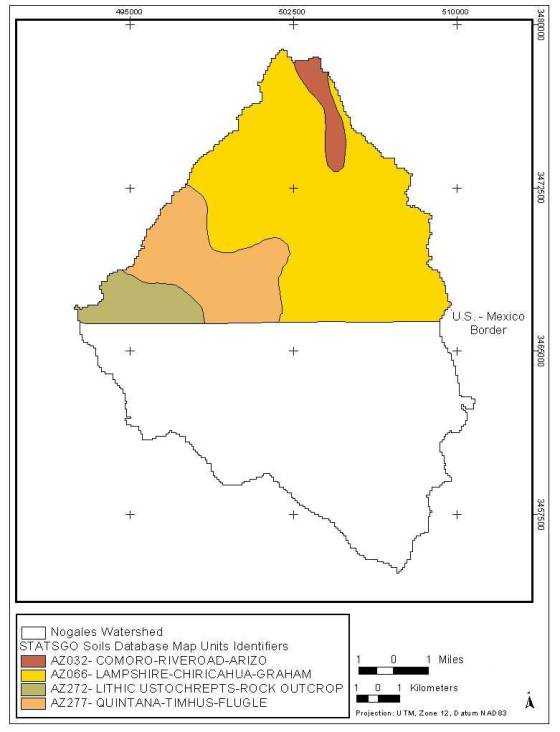 Figure 10: Soil types of the Nogales Watershed as defined by the STATSGO database (USDA-NRCS, 1995).
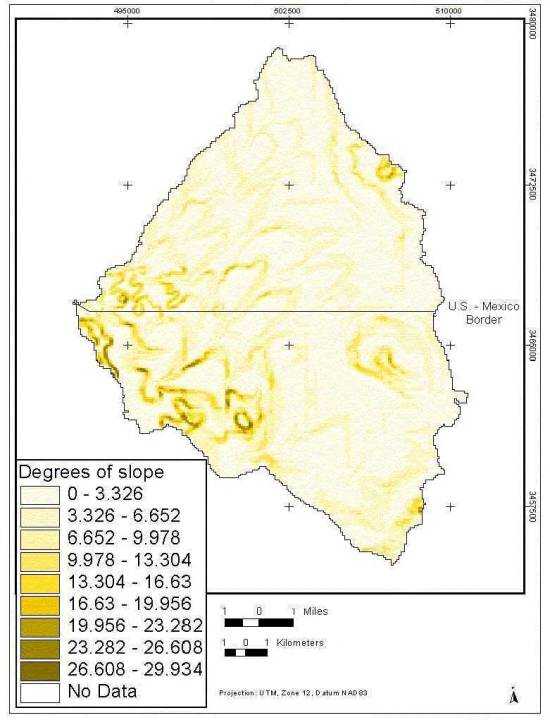 Figure 11: Degrees of slope depicted in the Nogales Watershed.
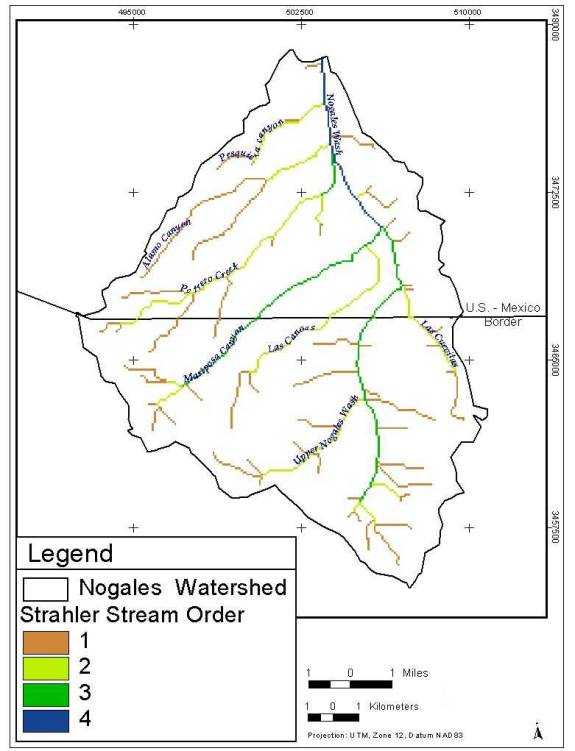 Figure 12: Strahler stream order depicted for the Nogales Watershed.
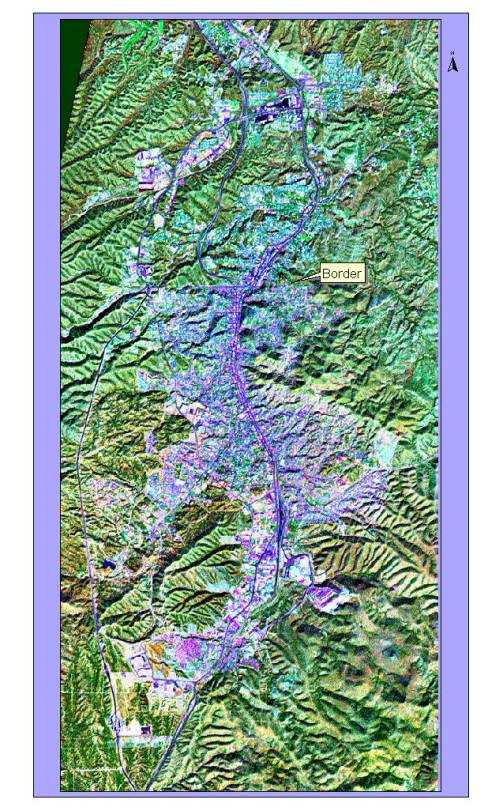 Figure 13: A satellite image of the twin cities of Nogales.
 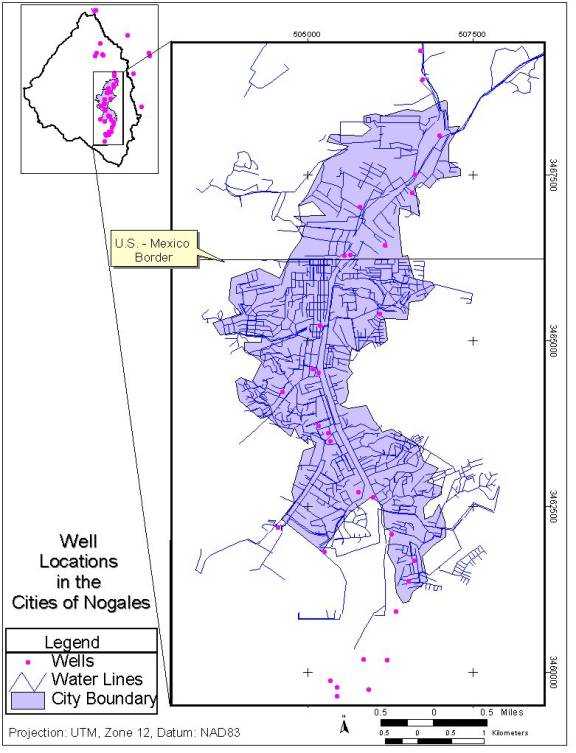 Figure 14: Well locations and water delivery lines within the Nogales watershed(modified after Varady and Mack, 1995).
 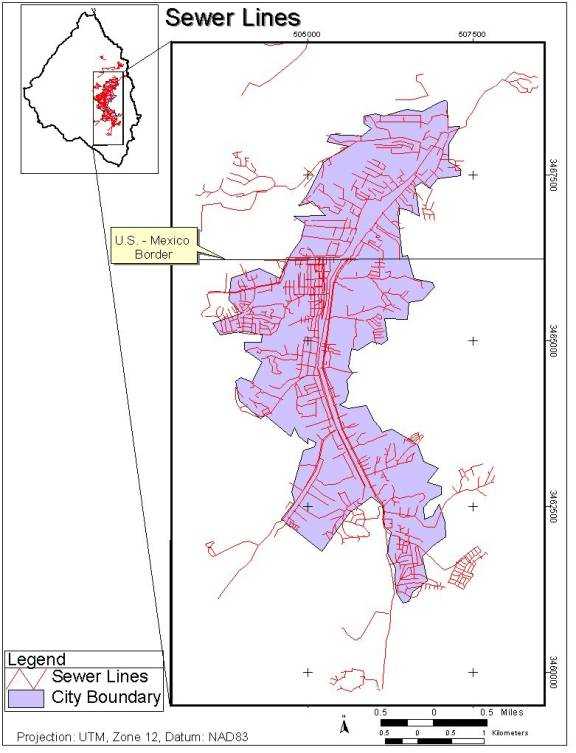 Figure 15: Sewer lines in the cities of Nogales, Arizona and Nogales, Sonora (modified after Varady and Mack, 1995).
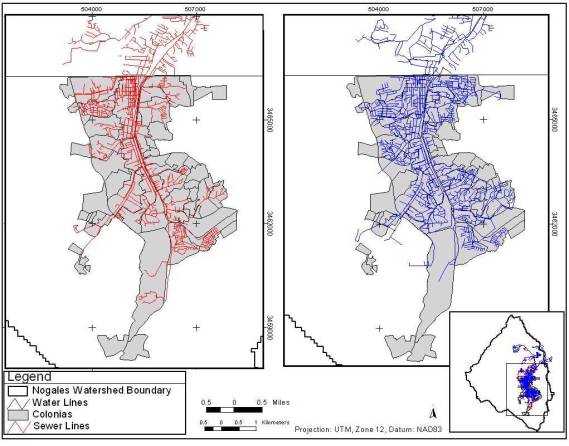 Figure 16: Image depicting those colonias in Nogales, Sonora that have no access to sewer and water delivery lines (modified after Varady and others, 1995).
 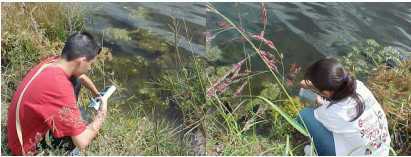 Figure 17: Michael and Christina, students from Desert View High School, collect water samples in Nogales.
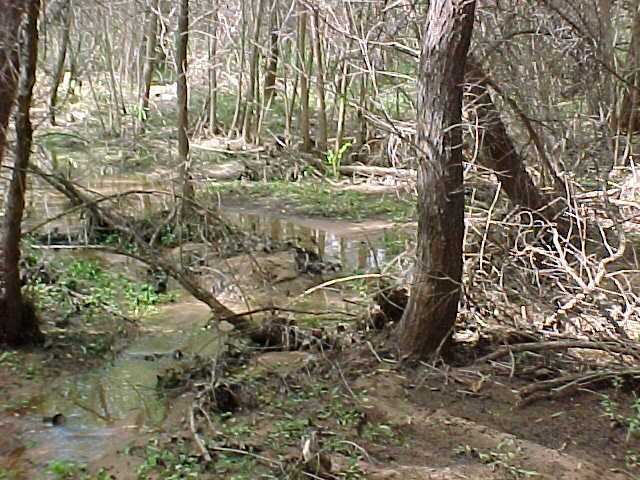 Figure 18: Photo taken by students from Desert View High School of the Nogales wetlands area..
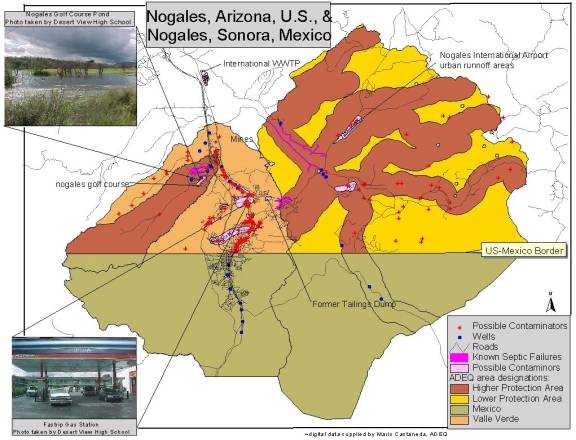 Figure 19: Sites of possible contamination identified by the ADEQ and by Desert View High School.
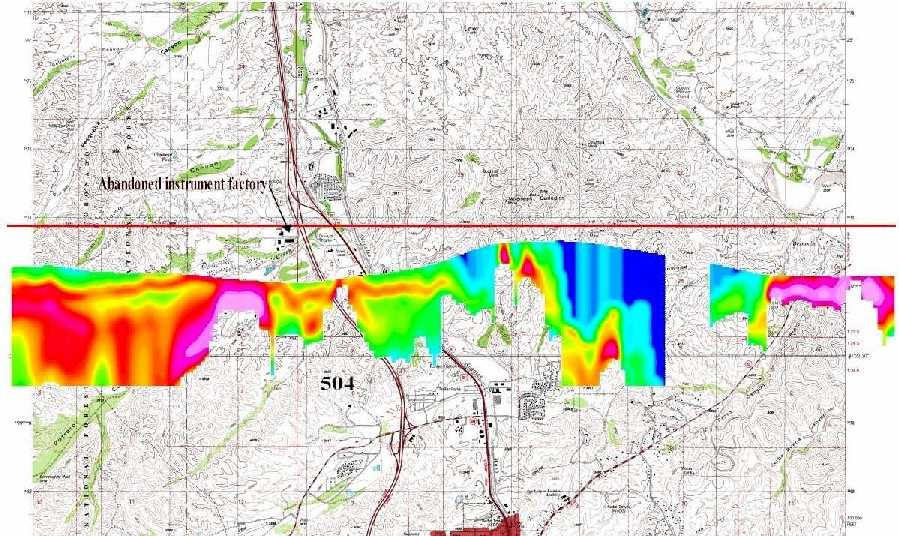 Figure 20: This Digital Raster Graphic (DRG) shows the EM flight line # 504.