Rodriguez Miriam, López Sergio, Rodriguez Analía, Merolla Silvia, Piergiacomi Marcelo
Implementation of GIS in Reconquista River Basin (167.000 Hectares), in Buenos Aires, Argentina, under the Project for Environmental Improvement and Flood Control of the basin. Basic accurate cartography and thematic mapping was developed, by using satellite and aerial imagery, integrating them with engineering designs. This information enabled to perform the updating of land value for affected parcels, inhabitants reallocation, and landscape and green areas preservation.
The GIS functionality implemented, plus processing of up-to-date imagery, was very useful to monitor the improvement works behavior during an unusually strong storm event, in may-2000, and focus investments in critical areas.
The Reconquista River Basin is an area of 1700 km2, comprises 19 counties or districts, has got 3,700,000 inhabitants (as per 1991 census list), 2,600,000 of which are favoured by the Project of Environmental Improvement and Flood Control.
The basin real situation is even more complex than it appears under the objective of the Environmental Improvement Project because of the high rate at which urban changes occur in the region, at a speed resisting any attempt to set a plan.
Under the circumstances, Geographical Information System implementation provided the user with a dynamic tool with which to observe, model and project these changes.
Hydraulic works affect directly the river surroundings altering the landscape, determining houses expropriation, changing land use/ land cover, etc.; and indirectly the social and economic basin context.
At the end of 1999 and beginning of 2000, political and economic factors affected the previously estimated work development schedule so that tasks planned for the lower and part of the medium sections of the river stream were not finished on time.
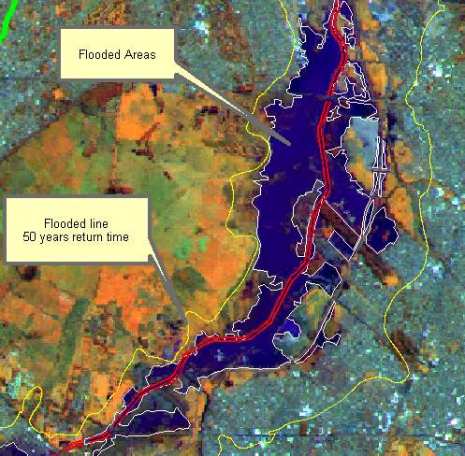
On May 2000, an unusually extreme storm took place. Satellite imagery, climate and hydrological data and the analysis of different thematic coverage such as flood recurrence and works done were integrated to produce maps. These maps showed clearly how works functioned adequately in the regions where they had been finished and how overflowing and flood occurred in areas where works had not been finished yet.
Affected area and facilities involved were estimated. Visualization from this survey helped take decisions, assess the real magnitude of the event and allowed UNIREC (Reconquista River Board from the Provincial Government) to show works efficiency and to obtain the financial means to finish them.
We may consider five stages
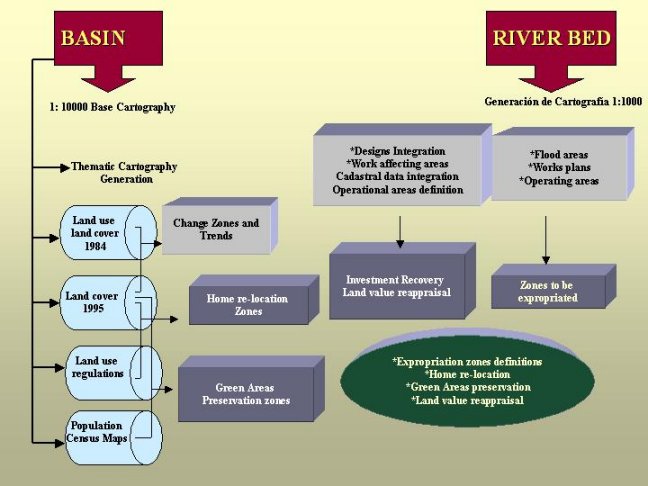
Cartography updating and cartography production at different scales. Incorporation of work design, cadastre, delimitation of Works-Affecting-Areas and expropriations. Scales 1:10000- 1:5000- 1:2000- 1:1000
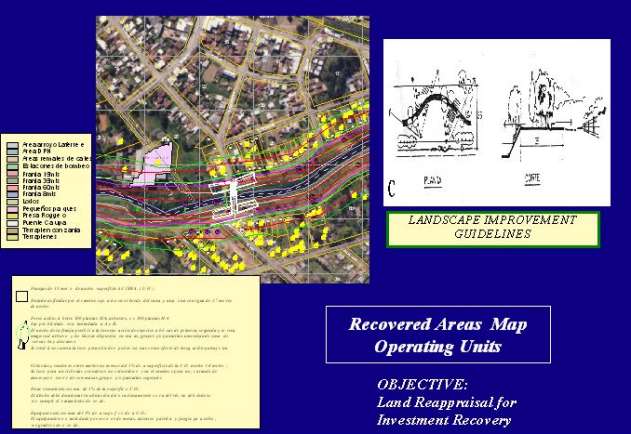
Thematic maps production: land use /land cover maps, multitemporal maps (based on aerial photos), urban management according to Municipal Resolutions, geological maps, digitalization of topographic cartography, digital elevation models (DEM) production for the basin, population maps (Census lists), education institutions, health institutions, road network updating (based on Spot Images), wasteland spotting or location (aerial photos), drinkable water supplied areas, waste water network supplied areas, incorporation of areas to be re-used (bicycle ways, entertainment places, vehicle parking, local re-forestation, sludge disposal pools, etc.
Design and implementation of a statistical model with the purpose of estimating future value of lots within the flood recovered area (based on spatial analysis, this area was defined or delimited between the flood line with a return time of fifty years and the same flood line after finishing works.) Production of new cartography (scale 1:1000) including present and estimated fiscal value and cadastral data as per block. By interpreting aerial photographs, the amount of houses involved in the Flood Recovering Area were estimated and therefore the amount of inhabitants who would be benefited by these works. Terrain modeling (DEM) was accurately performed in three sectors. Due to the changes man imposes on the area, modifying the region micro geomorphology, altering superficial drainage, it was necessary to take from the DEM, the drainage network of selected sectors in order to properly locate pumping stations.
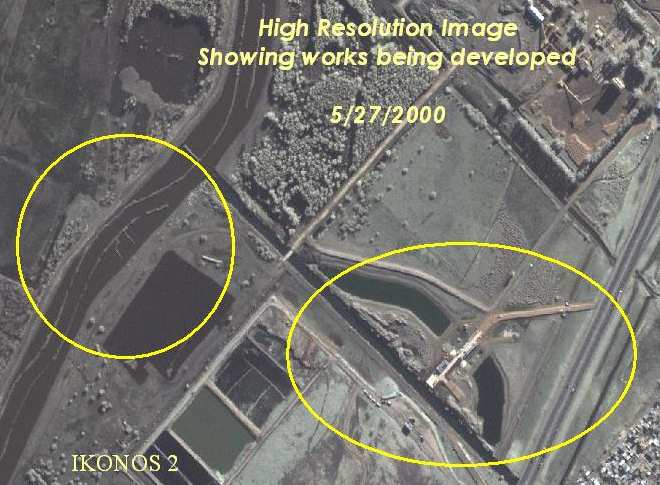
Assistance to hydrology emergency, mapping and quantification of the hydrology event magnitude of May 2000 using satellite imagery, Landsat scenes taken on dates near the event (May 18th, 2000), Landsat ETM (April 24th, 2000) and Ikonos 2 (May 27th, 2000).
Monitoring of already finished works through high-resolution spatial images.
We may mention three approaches according to the areas involved and the operation details or task description.
Plannimetric cartography from the Provincial Office of Cartography (last updated 1989) was digitized.
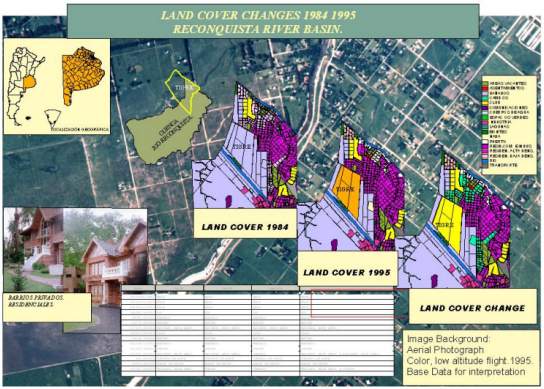
As cartography was not updated (considering cartography as the basis for any geographical reference system), a color aerial photography was designed, at 1: 10000 scale, which gave a global sight of the situation and allowed to produce land use and land cover maps, among other thematic maps, finally showing the degree of change and the trend in urban expansion.
The Municipal Resolution about land use and territorial management for every district of the basin was incorporated. Data were available in paper, sketch, draft or scheme, in every district, some were updated, some were not (the latest updating belonged to 1969); classification used also varied from one to the other so it was necessary for the professionals of the different disciplines to reach a common criterion in order to produce an only and cohesive map.
Aerial photographs from files (dating from 1984) were used in order to produce a multitemporal land use and land cover map, identifying strong changes including land use categories as for instance location of industries on residentiary areas or settling of private neighborhoods where flooding lands of low fiscal value existed.
Official topographic cartography was digitized at a scale of 1: 50000 in order to produce the basin DEM (digital elevation model) of the basin.
The whole public roads and railway system was updated using Spot 4 satellite imagery and the data were then related to the corresponding database (1: 25000).
Spatial analysis performed with ArcInfo was useful for several tasks, as spotting sectors where houses could be re-located considering land occupation, growth trends, average population, access ways, etc., among others.
Existing green areas were identified for possible preservation and new ones were projected.
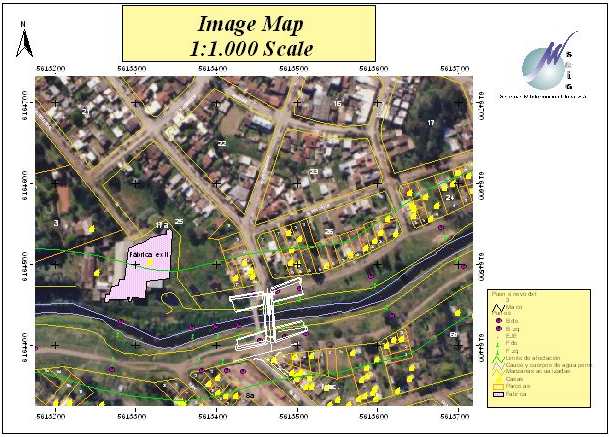
A buffer area of 350 m was covered in a color aerial photography (at a scale 1: 5000) on both margins of the Reconquista River bed. A photographic mosaic was prepared and divided into nine (9) image catalogues.
Using the photographic mosaic, cartography was updated at a scale1: 1000, integrating fifteen layers, approximately.
Using an analytical grid, 240 charts were produced, each with its marginalia, relative location chart, etc.
Engineering plans were incorporated to this cartography (hydraulic works included waterways, embankment, pumping stations, sludge disposal pools, etc). Topographic profiles (400 ones with 20 measurement points each) were added and the Work-Affecting-Area was defined including the involved cadastral lots in it.
The "Unidad Ejecutora del Río Reconquista" (UNIREC), that is the board in charge of carrying out works on the basin, using this accurate and updated cartography, decided to re-design waterways, determine the location of new bridges and sketched operation areas or land recovered areas
All these changes were incorporated to the Geographical Information System together with flood lines with a return time of 10, 25 and 50 years as well as the estimated line with a return time of 50 years after finishing works. The difference between the flood line with a return time of 50 years before and after works was defined as a Flood Recovering Area.
As said before, the so called "flood recovering area" is defined as the difference between the flood lines with a return time of 50 years before starting works and after finishing them.
A new flight was sent in 1998 to take 1:5000 scale color photography of the area with the purpose of updating the 240 charts composing previous cartography. With the new data, 600 - at 1:1000 scale- charts were produced to form updated cartography of the above-defined area.
Statistical modeling -never used before in Argentina- was applied as per blocks, gathering cadastral data from files and attributes data collection by means of field samples. Data was confirmed and nomenclature on the available cartography was adjusted. Sample collection was based on standard sampling with the addition of certain attributes forming part of the property ownership value. Modeling passed through two successive steps: variables exploration and multiple regression adjustment. SPSS Professional Statistics Program 6.1.
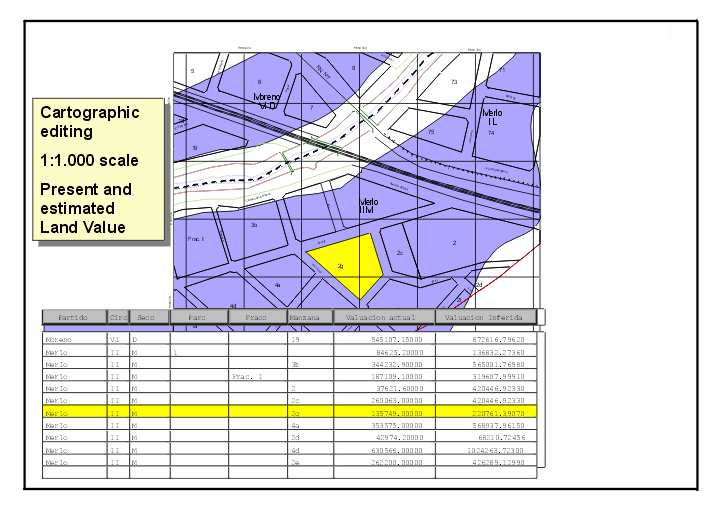
This method basically served to estimate the potential value of the region after finishing improvement works, comparing the existing difference (expressed as a percentage) between the present fiscal value of the blocks which already enjoy improvements and/or supplies and present fiscal value of the blocks belonging to the recovering area, considering their distance to access ways, the social and economic environment, the urban trend of the region, urban development and trends of the surroundings, etc.
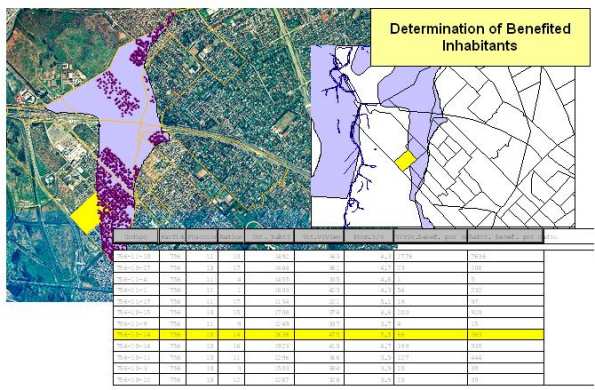
Another task that deserves to be described is the Estimate of Benefited Inhabitants. Data from the Instituto Nacional de Estadística y Censo (that is the National Organism for Statistics and Census Lists) taken in 1991 with prospect for the year 2000, as per census tract (that is the physic unit formed by an amount of blocks) were used, being these the best possible level of available data collection.
By interpreting aerial photography, the amount of houses within the re-appraisal area was computed, using data related to the average amount of inhabitants per house. Information was arranged as per districts but it can also be accessed per census tract.
In the end, high accuracy DEMs (digital elevation models) of three special sectors were carried out. Pumping stations and their catchments had previously been defined in those places but, between 1995 and 1998, houses were built on them, without control, thus modifying the place micro-topography. In order to avoid flooding of large urban locations, which had not been involved in the previous topographic situation, a new superficial run-off situation was determined considering the terrain model.
Therefore, this is the dynamics of a region, which, on the one hand, hinders any engineering planning and on the other hand, challenges Geographical Information System performance.
On May 16th, 2000 an extreme rainstorm affected the Basin. Though engineering works were well advanced, they were not enough to cope with the flood.
The event was monitored by means of a Landsat Thematic Mapper scene taken on May 18th (that is 2 days after the peak of the storm), it was then re-sampled with an ETM scene taken on January 24th and an Ikonos 2 scene taken on May 25th was also incorporated.
The fact of having worked with various scenes taken at different metric and spectral resolutions ensured efficient mapping which clearly showed the landscape characteristics and changes related to the degree of development of the engineering works and the evolution of land use. The use of Ikonos 2 high-resolution image helped detecting dramatic changes such as disperse urban increase (in the way of illegal settlements) and helped updating detailed cartography (future project: control of already finished works).
Spatial information managing enabled to quantify and assess the incidence of affected land use (1020 Ha). Urban "A" use or residentiary was affected by 1.7% of its 406 ha, while commercial, institutional and educational use or Urban "B" was not affected. Vacant lots were affected in 15% and settlements in 6%. Military areas were affected in 37% and the existing private airport was 70% flooded. From the environmental point of view, the fact that 49 Ha of wasteland disposal were flooded was quite relevant.
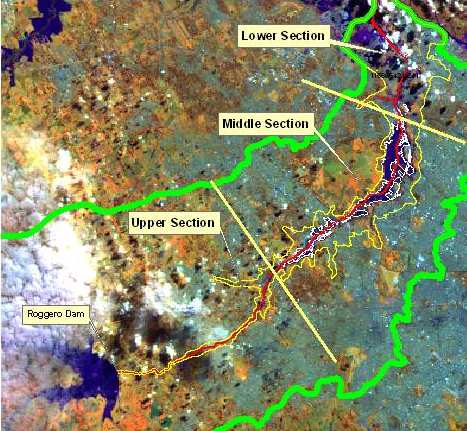
Time evolution of the Ingeniero Roggero Dam lake - located in the Upper section of the river stream- surface in hectares was also analyzed, considering that during the storm it covered 2022 Ha while under normal circumstances it covers 645 Ha.
|
ETM Scene of Basin Area (5/18/2000)
|
 |
|
Detail of flooded areas
|
 |
The event under analysis, with a return time rate of 8.4 years, was not meaningful when compared with the design storm with a return time of 50 years, but we can assert that the failure to complete works at the medium and lower sections of the river stream constituted a determining factor in water accumulation.
Especially for the medium section, the project foresees lateral embankments on both margins of the river to increase delivery capability when the maximum water level increases. In order to drain the areas that originally flew directly into the river, ten pumping stations were foreseen. They would pump water run-off from the sub-catchments above the embankments into the main Reconquista River bed.
Those pumping stations were been built and, at the moment of the event, the embankments were built but civil works and electromechanical works had not been finished yet. The embankments hindered normal water flow, which would have been assisted by electromechanical means if works had been finished. It is worth pointing out that in the upper and at the top of the medium section of the river stream, where waterways had been completed, the storm had minimum effect.
It is worth mentioning the quick and efficient response provided by the Geographic Information System, which, on the one hand, allowed to control and assist the flooded area, and, on the other hand, allowed to resume negotiating financial support to complete the engineering works previously planned.
|
|
Sistemas & Información Global S.A. Calle
54 Nş 701 - 1ş Piso Oficina 2 - La Plata B1900BEC |
||