The Water Erosion Prediction Project (WEPP) model is a continuous simulation, process-based model that allows simulation of small watersheds and hillslope profiles within those watersheds. The paper describes an approach allowing WEPP simulations based on using digital sources of information through the linkage with Geographical Information Systems. The ArcView extension is a geo-spatial interface for WEPP that utilizes readily available digital geo-referenced information such as digital elevation models, topographical maps, orthophotos, soil surveys, land use maps, and climate data to derive and prepare valid model input parameters to start site-specific soil and water conservation planning.
Decision-makers operating at different scales of interest and responsibility have to deal with different types of environmental problems and seek solutions to handle the complexity of natural and human actions causing these problems. The linkage of environmental assessment tools and Geographical Information Systems (GIS) and their capability in handling available geo-spatial data sources to prepare valid model input parameters for applications at various spatial and temporal scales are in high demand. The expansion and concentration of cultivated acreage, for instance, led to a drastic change in land use as well as water and sediment fluxes in environmental systems. Catastrophic events in the U.S. such as the Dust Bowl during the 1930s or the Mississippi floods in 1993 caused excessive losses of fertile agricultural land and increased concerns about the economic and environmental impact of soil erosion at local, regional, national and global scales. In response to such hazards related to soil erosion, especially from agricultural land, the development and implementation of techniques for natural resource management were fostered by interest groups and policy-driving organizations to support decision-makers in countries worldwide (Troeh et al., 1999).
There is a long history of developing erosion models for soil and water conservation in U.S. research. The most known and applied approach for estimating long-term average annual soil loss is the Universal Soil Loss Equation (USLE) (Wischmeier and Smith 1978) and the Revised Universal Soil Loss Equation (RUSLE) (Renard et al., 1997). Both are simple empirical equations based on factors representing the main processes causing soil erosion. USLE and RUSLE have proven to be practical, accessible prediction tools and were therefore implemented in the U.S. soil and water conservation legislation. However, these model approaches have been used and misused widely at various scales worldwide (see also Wischmeier 1976).
GIS in model linkages are dominantly used for data preprocessing and visualization of available data sources as well as the handling of data to apply environmental assessment models. A GIS-driven graphical user interface is a user-friendly approach to combine the decision-support of an environmental prediction model and the spatial capabilities of a GIS for practical assessment purposes (Renschler et al., 2000). A useful and successful implementation of an environmental model assessment approach requires the use of widely available data sets and the preparation of model input parameters to allow reliable model predictions. The prototype of a GIS-based interface - the Geospatial Interface for WEPP (GeoWEPP) (Renschler, 2001) - is an interface for using WEPP through a wizard in ArcView 3.2 for Windows 98, 2000 and NT. The currently released testing version of GeoWEPP ArcX 1.0 beta is an ArcView project/extension that starts with a user-friendly wizard (Fig. 1).
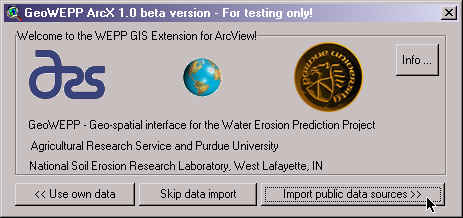
Figure 1. Opening screen of ArcView-based GeoWEPP wizard.
The GeoWEPP wizard allows the user to go through four essential steps to derive topographical input parameters for a WEPP watershed simulation based on a DEM of one's own or from a public source (U.S. Geological Survey (USGS) 1:24,000 scale):
The following sections will present these steps in more detail. Please note that the wizard is especially designed for GIS beginners including all the procedures and tools required to prepare all input data, run the model and visualize the results.
The first step of the wizard allows the user to import Digital Elevation Models (DEM) by downloading and interactively importing USGS datasets (Fig 2.). The downloading option allows the user to connect directly to the USGS Internet site for downloads and select the DEM Quad sheet by clicking on an interactive map (USGS, 2001). The four step DEM import procedure steps is designed in a way that adjacent DEM quad sheets are automatically merged.
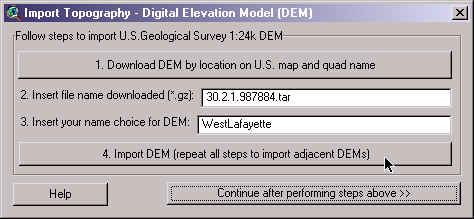
Figure 2. Screen of wizard to import USGS Digital Elevation Models 1:24,000 scale.
The display of the imported DEMs is a hill shade map view that allows even DEM-inexperienced people to get an idea about the topography of the selected area (Fig. 3). Note in the case study used, the merged USGS DEMs are of different quality in vertical resolution. In contrast to the 'West Lafayette, IN' 30 m-raster Quad sheet DEM with vertical resolution in meters, the 30 m-raster DEM 'Otterbein, IN' is originally in feet (0.3045 m). The hill shading of the latter shows therefore features like terraces due to the relatively large meter steps. It appears therefore less smooth than the merged DEM originally in feet. The visualization method used encourages the user to recognize the limitations of the different data sources used and to be cautious in modeling applications.
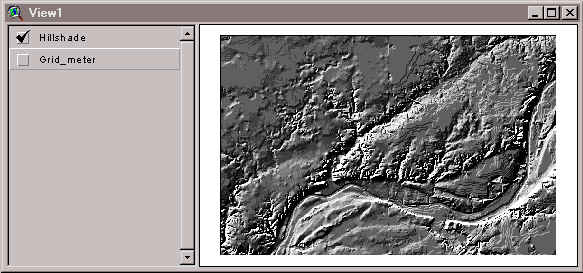
Figure 3. Hill shade view of merged DEMs 'Otterbein, IN' and 'West Lafayette, IN'.
Analogous to the DEM import wizard, a second wizard enables the user to interactively download a USGS digital topographical map - also known as Digital Raster Graph (DRG). Since the USGS does not provide a user friendly interface to locate and download DRGs of an area of interest comparable to the DEM download, the wizard has a link to a commercial site (GIS Datadepot, 2001). Besides other geo-spatial data sets, this provider gives access to DRG data free of charge by choosing a state, a county and the USGS Quad sheet name. The DRG image is then used by the wizard as an transparent overlay for the DEM imported in the previous step (Fig 4.). The topographical map includes user-friendly features that allow the user to locate their specific area of interest for an assessment.
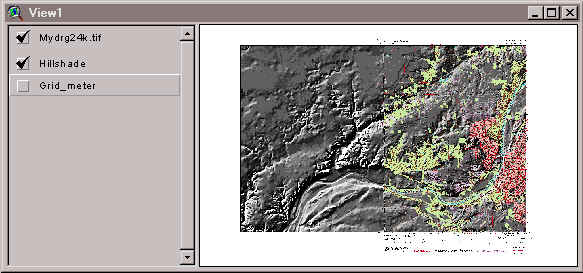
Figure 4. Transparent topographical map over hill shaded DEM scene.
Based on the imported topographical data of the DEM scene, a channel delineation takes place in the next wizard step. Channel parameters and a watershed outlet cell have to be set in the wizard to delineate drainage pattern and a watershed with sub-catchments (Fig. 5). The Topographical Analysis Software TOPAZ (Garbrecht and Martz, 2000) is integrated in the wizard.
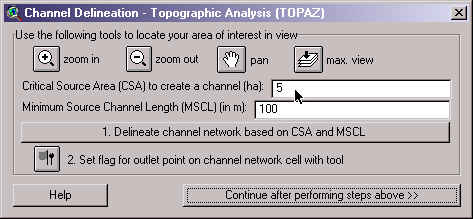
Figure 5. Screen of wizard to delineate watershed characteristics with TOPAZ.
TOPAZ requires a Critical Source Area (CSA) and a Minimum Source Channel Length (MSCL) to derive a channel network (Fig 6). After the network outline is satisfactory to the outline observed in the area (or mapped in the DRG), the wizard offers a tool to set the outlet for the watershed of interest (Fig. 5). The x-/y-coordinates in the view also allow the user to locate precisely a point of interest. After setting the outlet, TOPAZ derives the watershed boundary and subcatchment areas contributing to the channels (Fig. 6). The delineation of channel network as well as watershed boundary and subcatchments can be repeated until it matches the user's area of interest.
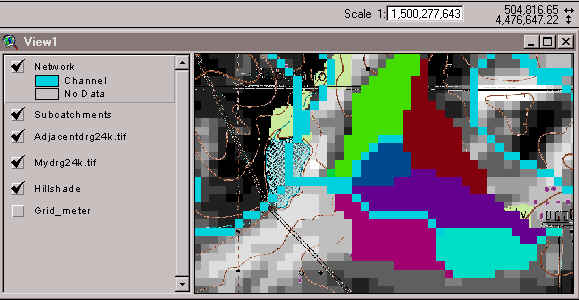
Figure 6. Delineated channel network (blue) and subcatchments in a watershed of interest.
Before the model run, the wizard guides the user through various steps to set the required minimum model input parameters for WEPP. Beside confirmation of the automatically climate station that is located closest to the watershed outlet, the user has to pick the names of the major soil, land use and channel parameter sets for the watershed provided by pick lists of the latest WEPP model (see also Flanagan and Nearing, 1995) (Fig. 7). An additional tool allows one to optionally change the soil and land use characteristics of the delineated subcatchments by clicking on the area in the map view (Fig. 6).
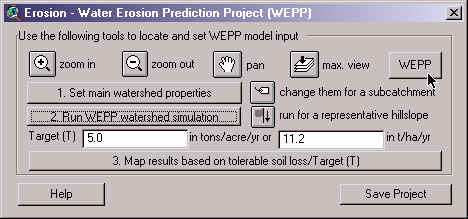
Figure 7. Screen of wizard to set WEPP model parameters.
The second step in this wizard runs the WEPP watershed model in starting up the WEPP TOPAZ Translator (Fig. 8). The translator lets the user get an overview about the main parameter settings and confirm these settings before running the WEPP watershed model. If changes need to be performed before running the model, the translator has to be closed and changes made by using the provided tools before running WEPP.
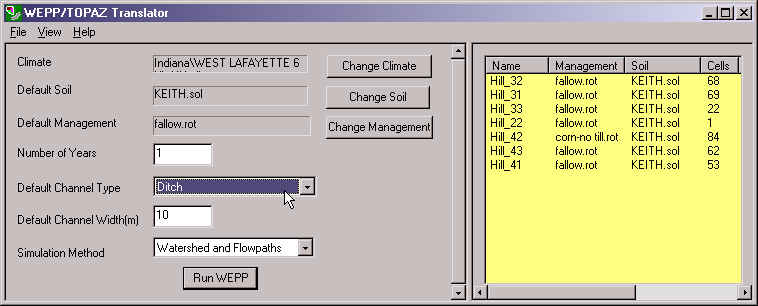
Figure 8. Screen of WEPP TOPAZ Translator to confirm model input settings.
The WEPP watershed simulation can be performed with two simulation methods (or both): (1) a relatively faster Watershed Method that allows one to simulate sediment yields from single representative hillslopes for each subcatchment with a channel routing for the watershed outlet and (2) a longer Flowpath Method that allows one to simulate and merge soil loss along all possible flowpaths within the watershed, but without channel routing. For more information about how to derive representative hillslopes as well as how to merge the flowpath by weighting their results according to flowpath length and contributing area, refer to Cochrane and Flanagan (1999) or Flanagan et al. (2000).
The WEPP model creates numerous outputs to its model components, including Climate Simulation, Subsurface Hydrology, Water Balance, Plant Growth, Residue Decomposition and Management, Overland Flow Hydraulics, Hillslope Erosion Component, Channel Flow Hydraulics, and Channel Erosion Surface. The current wizard allows you to visualize only a small portion of the WEPP model output of runoff, soil loss, sediment deposition and sediment yield from hillslopes and channel segments. The average annual simulation results for the WEPP Watershed Method are displayed as text file (Fig. 9) and visualized as a map.
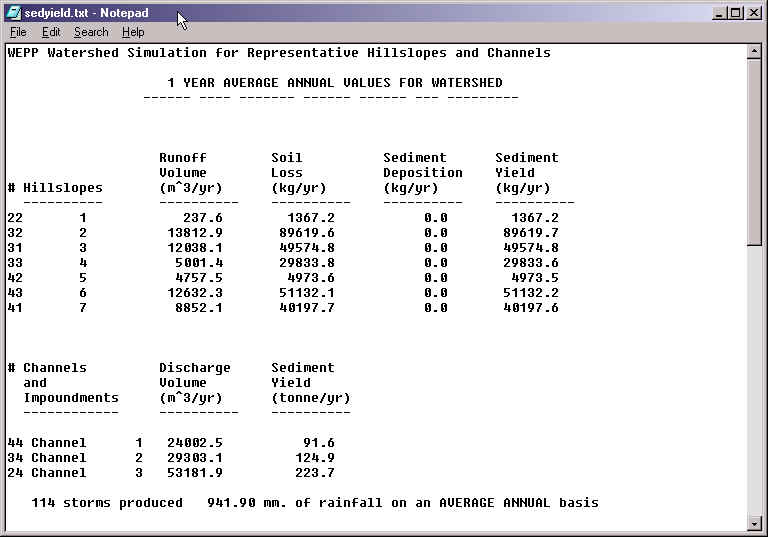
Figure 9. Text file for average annual simulation results for the WEPP Watershed Method.
Since ArcView 3.2 (surprisingly) does not allow display of negative values for raster maps, the assessment results are mapped as a relative measure to a tolerable soil loss or Target value (T). The concept of a T value (Schertz, 1983) describes in theory the annual replacement rate for a soil type to maintain a sustainable land use. The Natural Resources Conservation Service (NRCS) implemented T that is determined for each location based on properties of root limiting subsurface soil layers, current climate regions and an economic feasibility summarized for soils in land resource regions. T values usually range up to 5 tons per acre per year (11.2 t ha-1 yr-1). Relative to this T value, the results of soil loss and sediment yield are classified (Fig. 10.) and displayed in green colors, intolerable results are shown in red, and deposition areas are in yellow (Fig. 11 and Fig. 12).
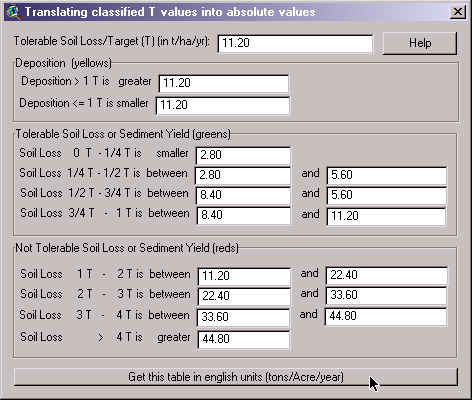
Figure 10. Legend showing the relative classes to the tolerable limit T.
The results for the Watershed Method are mapped as sediment yields from each simulated representative hillslope entering a channel segment (Fig. 11). In the case study shown in Figure 11, the hillslopes contributing from both sides to the northern first order channel segment are mapped in reddish colors for sediment yields greater than T (1 T - 2 T). While all other subcatchments are fallow and very vulnerable to soil erosion, the subcatchment with the corn no-till rotation produces the lowest sediment yields mapped in a lush green color (Fig. 11; compare hillslope H_42 in Fig. 8 and Fig. 9). The longer simulation with the Flowpath Method shows a much more detailed assessment for soil loss within the subcatchments (Fig. 12). Now it is possible to locate the problem areas (intensive red color) within the two subcatchments also indicated by the Watershed Method (Fig. 11). The results of the Flowpath Method also indicate a problem area in the southern subcatchment that was assessed as tolerable with the Watershed Method. After assessing the effect of this first land use scenario (Fig. 8), the user may change the land use to get acceptable T values for all watershed areas (Please note that the GeoWEPP version presented here is for a single soil and land use in each subcatchment. Future versions are currently under construction to include spatially distributed soil and land use along hillslopes).
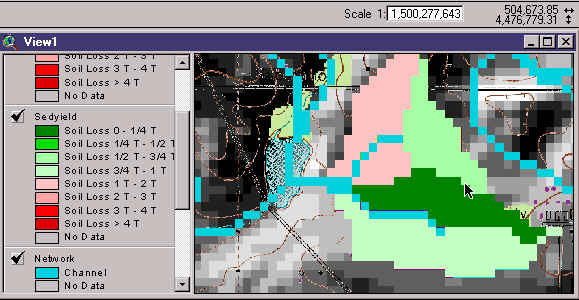
Figure 11. Map of sediment yields of representative hillslope simulated with the WEPP Watershed Method.
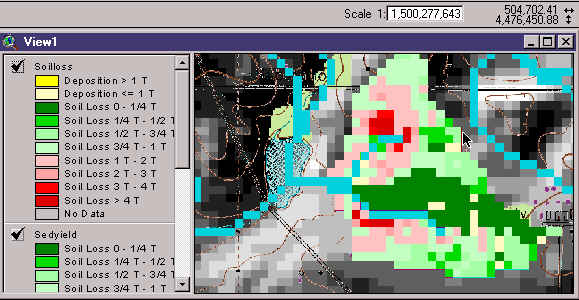
Figure 12. Map of soil loss of each hillslope raster cell simulated with the WEPP Flowpath Method.
The ArcView project/extension GeoWEPP helps GIS beginners and experts obtain data from publicly available data sources in the US to assess spatially distributed sediment yield and soil loss on small agricultural watersheds. The new assessment tool combines GIS and a process-based model to assess land use scenarios to determine the best management practices (BMPs) for a particular watershed of interest. Development of the prototype continues with the prototype available for testing. The final release will include the import of publicly available soil survey data 1:24,000 and the possibility to assess spatially distributed soil units and land use classes for larger non-agricultural watersheds.
The GeoWEPP project is a collaborative research between the Department of Agricultural and Biological Engineering (ABE), Purdue University, and the National Soil Erosion Research Laboratory (NSERL), U.S. Department of Agriculture Agricultural Research Service (USDA-ARS), West Lafayette, Indiana. The authors acknowledge the contribution of people involved in the GeoWEPP project: Jim R Frankenberger, Thomas A Cochrane, and Roel C Vining. GeoWEPP is made possible through executables and recompiled shareware code provided by: Jurgen Garbrecht and Lawrence Martz, Sol Katz, and The GNU Project. The GeoWEPP project resulted out of an international interdisciplinary project initially supported by Bernd Diekkrüger, Jon Harbor, and the German Academic Exchange Service (DAAD).
For more details on how to download and use the current GeoWEPP ArcX testing version see the GeoWEPP homepage (Renschler, 2001). This homepage has a link to an internet accessible GeoWEPP ArcX User Manual and Case Study that is continuously updated as your critique and comments come in. The goal is to make this document as well as GeoWEPP ArcX as user friendly as possible.
Ascough II JC, Baffaut C, Nearing MA, Liu, BY. 1997. The WEPP Watershed Model: I. Hydrology and erosion. Transactions of the American Society of Agricultural Engineers 40(4): 921-933.
Cochrane T, Flanagan DC. 1999. Assessing water erosion in small watersheds using WEPP with GIS and digital elevation models. Journal of Soil and Water Conservation 54(4): 678-685.
Flanagan DC, Nearing MA, editors. 1995. USDA-Water Erosion Prediction Project Hillslope Profile and Watershed Model Documentation. NSERL Report No. 10, USDA-ARS National Soil Erosion Research Laboratory, West Lafayette, Indiana. (See also: <http://topsoil.nserl.purdue.edu/nserlweb/weppmain/wepp.html>
Flanagan DC, Renschler CS, Cochrane TA. 2000. Application of the WEPP model with digital geographic information. In: Problems, Prospects and Research Needs. Proceedings of the 4th International Conference on Integrating GIS and Environmental Modeling (GIS/EM4); 2000 Sep 2-8; Banff, Alberta, Canada.
Garbrecht J, Martz LW. 2000. TOPAZ: An automated digital landscape analysis tool for topographic evaluation, drainage identification, watershed segmentation and subcatchment parameterization: Overview. ARS-NAWQL 95-1, USDA-ARS, Durant, Oklahoma.
<http://grl.ars.usda.gov/topaz/TOPAZ1.HTM>
GIS Datadepot. 2001. Download Digital Data. <http://www.gisdatadepot.com/catalog/US/sublist.html>. Accessed 1999 May 23.
Renard KG, Foster GR, Weesies GA, McCool DK, Yoder DC. 1997. Predicting Rainfall Erosion Losses - A Guide to Conservation Planning with the Revised Universal Soil Loss Equation (RUSLE). U.S. Dept. of Agriculture, Agricultural Handbook 703. 404 p.
Renschler CS. 2001. GeoWEPP - The Geo-spatial interface for the Water Erosion Prediction Project WEPP). <http://topsoil.nserl.purdue.edu/gis>
Renschler CS, Engel BA, Flanagan DC. 2000. Strategies for implementing a multi-scale assessment tool for natural resource management: a geographical information science perspective. In: Problems, Prospects and Research Needs. Proceedings of the 4th International Conference on Integrating GIS and Environmental Modeling (GIS/EM4); 2000 Sep 2-8; Banff, Alberta, Canada.
Schertz DL. 1983. The basis for soil loss tolerance. Journal of Soil and Water Conservation 38 (1), 10-14.
Troeh FR, Hobbs JA, Donahue RL. 1999. Soil and water conservation: productivity and environmental protection. Third Edition, Prentice-Hall Publishers. Upper Saddle River, New Jersey. 610 p.
USGS. 2001. U.S. Geodata Server. <http://edc.usgs.gov/bin/maptest/coords=55+-130+20+-65/scale=24/type=dem/zoom=8>
Wischmeier WH. 1976. Use and misuse of the universal soil loss equation. Journal of Soil and Water Conservation 31 (1): 5-9.
Wischmeier WH, Smith DD. 1978. Predicting Rainfall Erosion Losses - A Guide to Conservation Planning. U.S. Dept. of Agriculture, Agricultural Handbook 537. 85 p.