STUDY AREA
The Kanawha River is a sixth-order stream, and as such is classified as a large river. It is the fourth largest tributary of the Ohio River (Figure 1).
ABSTRACT
Large rivers worldwide have been dramatically impacted by human activity.
Most fisheries research in large rivers has focused on water quality as
an indicator of ecosystem health. Research on how benthic characteristics
of large rivers affect fish distributions is lacking. This paper
focuses on the use of ArcView and its extensions to characterize benthic
habitat in an industrialized river in West Virginia. The visualization
capabilities of ArcView are used to show interrelationships of various
habitat characteristics. The ability to provide 3-D imagery will
be a valuable tool for management and utilization of benthic habitat.
Large rivers worldwide have been dramatically altered to serve the needs of mankind (Petts 1984). In their normal condition, rivers exist as a longitudinal gradient of nutrients and community structure as well as sediment classification (Vannote et al. 1980). The addition of lock and dam structures to most rivers has resulted in dramatic changes in river morphology and flow rates (Nielsen et al. 1986), forming a series of impoundments ranging from lotic to lentic conditions typical of many large rivers (Ward and Stanford 1983). Hydrosedimentary characteristics have also been impacted as a result of flood and navigational controls (Nicolas and Pont 1997). Many species of fish are not tolerant of reduction or redirection of flow related to human alteration of large rivers (Curtis et al. 1997; Modde and Irving 1998).
Geographic information systems (GIS) have been extensively used to examine terrestrial habitat (Bojorquez-Tapia et al. 1995; Mangel et al. 1996) as well as Aquatic habitat (Teaford 1997; Toepfer et al. 2000). The benefit of using a GIS to examine habitat is that it allows the user to incorporate various layers of data to construct a complete picture of underlying habitat characteristics, from which models of habitat selection by fish species can be deduced. It is important to identify areas and features of the habitat that are important to fish and may represent bottlenecks for populations. Examples of this are overwintering habitat, reproductive habitat, et cetera. Limited habitat resources may affect survival of adults and recruitment of subadults into the adult population. Identification of critical habitat is a priority to many fisheries managers, especially those trying to manage large river fisheries resources (Raibley et al. 1997). The value of GIS to fisheries professionals is that it allows for 3-D visualization of fish habitat, with correct spatial features and attributes for each point. Previous analysis of fisheries data did not permit the analysis of spatial data in three dimensions.
Previous studies on the Kanawha River fish communities have primarily
focused on larval fish interactions (Odom 1987; Scott and Nielsen 1989;
Rider and Margraf 1997). Hershfield et al. (1986) examined the effects
of barge traffic on fish production. There have been no habitat use
studies of Kanawha River fish populations reported to date. Therefore,
the goal of this paper is to present the results of the benthic habitat
characterization portion of the multidimensional large river fisheries
analysis currently ongoing at West Virginia University. This paper
is part of a graduate dissertation from West Virginia University.
The United States Army Corps of Engineers (USACE), Huntington District,
provided funding for this project.
The specific question we wished to examine was what if any effect the
spatial attributes of depth and habitat (benthic sediment type) had on
the location of fish in a large river. To address this question,
we characterized the benthic habitat of the Marmet Pool of the Kanawha
River, WV, using side scan sonar (SSS) and bathymetric data provided by
the USACE. We then collected radiotelemetry data on 5 species of
fish for 8 months to determine movement and habitat use. These diverse
spatial data layers required a GIS to adequately analyze the data. The
Esri ArcView platform was chosen for our analysis because it afforded relative
ease of use as well as the ability to process the data in a timely fashion.
MATERIALS AND METHODS
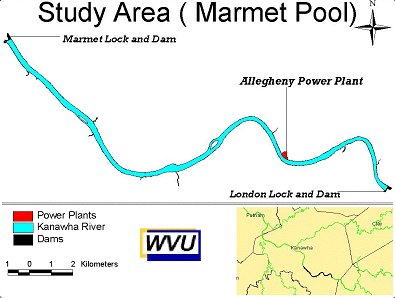
STUDY AREA
The Kanawha River is a sixth-order stream, and as such is classified
as a large river. It is the fourth largest tributary of the Ohio
River (Figure 1).
The Kanawha River watershed drains approximately 3,186,000 ha
(Kanawha River Basin Coordinating Committee 1971). The Kanawha River and
its fisheries have been greatly impacted by humans since the early 1800s
(Addair 1944). Currently the United States Army Corps of Engineers
(USACE) maintains approximately 145 km of navigable waterways on the Kanawha
River divided into 4 pools by 3 high-lift dams. Marmet Pool, the
second most upstream pool in the chain, is approximately 30 km in length.
It is characterized by a gradation from forested mountains upstream to
highly industrialized floodplains downstream, which is more characteristic
of the majority of the navigable Kanawha River.
Today there are 58 species of fish representing 14 families found in
the Kanawha River (United States Army Corps of Engineers 1985). Of
the 58 species of fish, 12 are considered game species by the West Virginia
Division of Natural Resources (WV-DNR). According to the WV-DNR,
the dominant fish species are common carp (Cyprinus carpio) smallmouth
buffalo (Ictiobus bubalus), and gizzard shad (Dorosoma cepedianum)
(D. Cincotta, pers. comm.). There is a great deal of interest on
the part of the WV-DNR to increase angling opportunities in the Kanawha
River (M. Hoeft, WV-DNR, pers. comm.).
RADIOTELEMETRY DATA
In order to determine how large game and nongame species partition
habitat resources in the Marmet Pool, a suite of 5 species was selected
instead of the traditional single-species telemetry research. Based
on our communications with the WV-DNR, we selected common carp smallmouth
buffalo, freshwater drum (Aplodinotus grunniens), flathead catfish
(Pylodictus olivarus), and hybrid striped bass (Morone saxatilis
X
M.
americana).
| Average | Minimum | Maximum | Average | Minimum | Maximum | ||
| Genus | Number | Length | Length | Length | Weight | Weight | Weight |
| Freshwater Drum | 7 | 583 | 514 | 660 | 3.4 | 2.3 | 4.0 |
| Common Carp | 16 | 624 | 325 | 785 | 4.0 | 2.5 | 8.0 |
| Smallmouth Buffalo | 17 | 554 | 475 | 645 | 2.6 | 2.0 | 4.3 |
| Hybrid Striped Bass | 9 | 530 | 495 | 559 | 2.5 | 1.6 | 3.5 |
| Flathead Catfish | 5 | 595 | 393 | 790 | 5.1 | 1.8 | 8.5 |
Fish were caught by electrofishing, anaesthetized in clove oil (Anderson
et al. 1997), weighed to the nearest 0.5 kg, and measured to the nearest
mm TL. Transmitters were surgically implanted into the abdominal
cavity as described in Walsh et al.(Walsh et al. 2000). Radio transmitters
had a battery life of at least 210 days and weighed 30 g in air, which
is less than 1% of the body weight of the smallest fish implanted.
Each transmitter operated on a unique frequency from 148.14 to 151.72 MHz
(Lo-Tek, Newmarket, Ontario, Canada). Instrumented fish were detected
with a scanning receiver and H antenna. Location efficiency was within
2 m as determined by blind testing of operators. All transmitters
were equipped with a contact name and phone number in the event that an
angler captured the fish.
Tracking efforts included locating individual tagged fish during daylight
every other week by boat from 26 May 2000 to 28 February 2001. For
every fish location, the exact position was determined using a handheld
GPS unit when the boat was positioned over the strongest signal.
In addition to recording position information, measurements of temperature,
dissolved oxygen (DO), specific conductivity, salinity, turbidity, and
pH were made.
HABITAT DATA
The SSS data for this project were collected and processed by a USACE
contractor. The bathymetric data were collected by the USACE and
post-processed by a USACE contractor. The data were provided to West
Virginia University by the USACE as part a research agreement. The
SSS data consists of a transect conducted down the center of the pool using
a SSS sonar attached to a GPS unit for real-time GPS location data.
In the laboratory, the SSS sonar data was analyzed and converted into ArcView
shape files containing polygons of similar particle sizes. The bathymetric
data were collected in a series of transects across the river from the
London locks and dam upstream to the Marmet locks and dam downstream.
This data was then converted into ArcView point coverages.
DERIVED DATA
In order to build a model showing how fish interact with sediment and
depth within Marmet Pool, we had to build new data layers based on the
existing USACE data. To begin, we obtained 1:12,000 DOQQ data from
the United States Geological Survey (USGS). We next digitized the
boundary of Marmet Pool based on the DOQQs. The bathymetric and SSS
data were supplied to us in an ArcView shapefile format, so no manipulations
were needed. Next, we converted the bathymetric data into contour
lines using ArcView�s Spatial Analyst. A TIN was then created from
the contour lines. This TIN was clipped using a grid made from the
pool polygon. The SSS data was then overlaid on the bathymetric grid
using the ArcView Spatial Analyst extension. This provided us a calculated
representation of sediment type, and allowed us to statistically analyze
the habitat data. We then used the Geoprocessing Extension to perform
spatial joins between the telemetry data and the sediment type and water
depth. Following this, we were able to build a matrix of all fish
locations, with water quality variables. This was combined with the
sediment and bathymetric data to provide a complete habitat description
for all fish encountered in the first part of the study.
RESULTS
The purpose of this study was to evaluate spatial attributes of depth
and sediment type (particle size) and their effect on fish distribution
in the Marmet Pool of the Kanawha River. We implanted a total of
7 freshwater drum, 16 common carp, 17 smallmouth buffalo, 9 hybrid striped
bass and 5 flathead catfish during implanting events in May and June 2000.
Each of the 54 instrumented fish was located at least 1 time after implantation
and an average of 7 times (1-14) during the study period for a total of
340 individual tracks. Although mortality of tagged fish is likely,
we did not receive any phone calls regarding the tags, nor did we locate
any dead fish during the study. There were 5 or more observations
for 95% of the implanted fish. Most observations of tagged fish were
made in the summer (N=177), followed by the fall (N=110) and winter (N=53)
months.
As part of this study, we examined water quality data measured at each
fish location. There was no significant biological difference between surface
and bottom measures of temperature, dissolved oxygen (DO), specific conductivity,
salinity, turbidity, and pH. Any statistical differences were within
the tolerances of the equipment used to measure water quality. This
is expected given the typically homogeneous nature of most large rivers.
We used ArcView to determine the mean particle size and depth that
each species was associated with to see if there were any differences between
the species (Table 2). Unfortunately, we had several fish locations
that fell into the unclassified areas for either depth or particle size.
These were removed, leaving 306 of 340 recorded observations for the spatial
analysis.
| Average | Std. Dev. | Average | Std. Dev. | ||
| Genus | Count | Particle Size | Particle Size | Depth | Depth |
| Freshwater Drum | 13 | 39.7399 | 26.2813 | 4.7608 | 1.7476 |
| Common Carp | 121 | 31.6672 | 28.0119 | 4.1354 | 1.7458 |
| Smallmouth Buffalo | 116 | 28.6436 | 23.6349 | 4.2842 | 1.7119 |
| Hybrid Striped Bass | 30 | 44.8372 | 34.7503 | 3.5714 | 1.5716 |
| Flathead Catfish | 26 | 43.1992 | 36.9370 | 3.5010 | 1.5879 |
There did not appear to be any correlation between species, depth, and particle size. However, the standard deviations for this data are extremely large, which indicates that there may be a problem with how the data were interpolated and/or categorized. We do feel that there are some extenuating data circumstances which may have hampered our analysis as mentioned in the discussion section (below).
Most fish were located in the upper half of Marmet Pool during the months of this study (Figure. 1). We did not observe any behavior we could associate with spawning. Temperatures and DO were fairly homogeneous in the river during each season, with the exception of an occasional temperature peak near the Allegheny Power Plant located in the upper half of Marmet Pool. Fish did not appear to differentially use the power plant area over surrounding areas.
The actual locations of the fish in the channel did vary somewhat on a seasonal basis. During the summer and fall, most fish were found in the mid-channel area of the river. During the winter, drum, carp, and buffalo had a higher frequency of observations along the shoreline than in mid-channel, whereas hybrid striped bass and flathead catfish were more often seen in mid-channel during the winter.
DISCUSSION
The emphasis of this paper is how we combined sucessive data layers
to
determine sediment type (particle size) and depth based on the location
of the fish during telemetry. The results of this study do not provide
conclusive evidence for how fish in the Marmet Pool are partitioning habitat.
However, based on this preliminary work, we can start to uncover the mechanisms
that may influence fish distributions within the river. It is difficult
to determine the exact sediment type and depth a fish is located in while
conducting radiotelemetry with only a receiver and a GPS. The ability
to predict which sediment type and depth a fish is most likely in is a
valuable asset to understanding how fish are keying to their habitat.
This paper is a first step in combining GIS with multiple layers of fish
distribution and habitat data to produce a predictive model. While
we were unable to conclusively show any associations, this paper does provide
methods and a jumping off point for future research endeavors.
The habitat and radiotelemetry data we had available from this project presented several unique challenges for analysis. The first (and most important) is that the spatial scale of the different data layers varied. Radiotelemetry is inherently very large scale, whereas the polygon that contains the boundaries of Marmet Pool is based on 1:12,000 DOQQ images. The bathymetric and SSS data are also large scale (approximately 1:300) with a reported error of 1-5 m. Concurrently, the error associated with the GPS unit used to collect fish location data ranges from 7-15 m. In addition, depth and sediment measurements in the river can become autocorrelated when measured in serial fashion, and exact locations of sediment patches are key to understanding the effects of depth on particle size.
There are errors associated with both the bathymetric and SSS data we used for this study as well. One source of potential error associated with the bathymetric data is that the data were collected in a series of transects across the river channel. This leads to difficulty during interpolation of the bathymetric points into contours, and then the conversion of these contours to a TIN. Trained analysts classified the SSS data, but there is always some level of subjectivity when data are assigned to classes. However, in this case, there are no computer programs currently available that can differentiate the nuances of benthic sediments from shadows and other artifacts generated during SSS collection (Nieman et al. 1999).
Finally, the Kanawha River is a major thoroughfare for barge traffic
transporting coal and chemicals in and out of West Virginia. As a
result, the nature of the river channel has been radically changed from
the pool-riffle habitat it and other pre-colonization rivers must have
shared. The natural hydrology and flow pattern of the river has been
modified from that of a flowing river to a series of connected pools.
These pools are more streamlike in their headwater areas, and more lakelike
in the tailwaters as a result of flow reduction by the dams. This
has also affected sediment transport patterns and caused changes in benthic
habitat as a result. The Kanawha River channel today has a prominent
scour feature from dredging operations as well as barge traffic.
These features make it difficult to assess changes in habitat, especially
from the perspective of the fish.
This study is a small part of an ongoing research project at West Virginia
University that combines multiple data layers using GIS in order to construct
a predictive model of fish community structure and habitat within the Kanawha
River. We plan to use the Esri GIS platforms to combine remote sensing
data such as SSS and radiotelemetry with hydroacoustic fisheries assessments,
classification of satellite images, and the creation of a Kanawha River
fish species database in the construction of these models. Our net
goal is to create a GIS that can be used by fisheries managers in similar
large river systems to assist in meeting fisheries objectives.
We would like to thank J. Howell, J. Strager, D. Wegmann, and D. Nieman
for their assistance.
Addair, J. 1944. The fishes of the Kanawha River system in West Virginia and some factors which influence their distribution. Ph.D. Dissertation, The Ohio State University, Columbus OH.
Anderson, W. G., McKinley, R. S., and Colavecchia, M. 1997. The use of clove oil as an anesthetic for rainbow trout and its effects on swimming performance. North American Journal of Fisheries Management 17: 301-307.
Bojorquez-Tapia, L. A., I. Azuara, E. Ezcurra, and O. Flores-Villela. 1995. Identifying conservation priorities in Mexico through geographic information systems and modeling. Ecological Applications 5: 215-231.
Curtis, G. L., J. S. Ramsey, and D. L. Scarnecchia. 1997. Habitat use and movements of shovelnose sturgeon in pool 12 of the upper Mississippi River during extremely low flow conditions. Environmental Biology of Fishes 50: 175-182.
Hershfeld, D. C., D. J. Orth, and L. A. Nielsen. 1986. Fish production in the Kanawha River and its relation to barge traffic. Polskie Archiwum Hydrobiologii 33: 295-303.
Kanawha River Basin Coordinating Committee. 1971. Kanawha River Comprehensive Basin Study Vol. IV. Appendix G. Water Supply and Water Quality Requirements. Department of the Army, Huntington District Corps of Engineers West Virginia.
Mangel, M., L. M. Talbot, G. K. Meffee, M. T. Agardy, and and 38 co-authors. 1996. Principles for the conservation of wild living resources. Ecological Applications 6: 338-362.
Modde, T. M. and Irving, D. B. 1998. Use of multiple spawning sites and seasonal movement by razorback suckers in the Middle Green River, Utah. North American Journal of Fisheries Management 18: 318-326.
Nicolas, Y. and Pont, D. 1997. Hydrosedimentary classification of natural and engineered backwaters of a large river, the lower Rhone: Possible applications for the maintenance of high fish diversity. Regulated Rivers; Research and Management 13: 417-431.
Nielsen, L. A., R. J. Sheehan, and D. J. Orth. 1986. Impacts of navigation on riverine fish production in the United States. Polskie Archiwum Hydrobiologii 33: 277-294.
Nieman, D. A., Sermarini, G. S., Sherman, S., and Ettinger W. S. Use of side-scan sonar and GIS for mapping substrate and dredging disturbance in large rivers. Randall, R. E. Proceedings of the Western Dredging Association Nineteenth Technical Conference and Twenty-First Texas A&M Dredging Seminar. 99. Center for Dredging Studies.
Petts, G. E. 1984. Impounded Rivers- Perspectives for Ecological Management. John Wiley and Sons, New York.
Raibley, P. T., K. S. Irons, T. M. O'Hara, K. D. Blodgett, and R. E. Sparks. 1997. Winter habitats used by largemouth bass in the Illinois River, a large river-floodplain ecosystem. North American Journal of Fisheries Management 17: 401-412.
Teaford, T. T. 1997. The application of GIS to a paddlefish radio telemetry study. Saint Mary's University of Minnesota.
Toepfer, C. S., Fisher, W. L., and Wade, W. D. 2000. A multistage approach to estimate fish adbundance in streams using geographic information systems. North American Journal of Fisheries Management 20: 634-645.
United States Army Corps of Engineers. Kanawha River Navigation Study: Winfield Lock Replacement, Appendix D. Environmental Assessment and Analysis. 441. 85.
Vannote, R. L., G. W. Minshall, K. W. Cummins, J. R. Sedell, and C. E. Cushing. 1980. The river continuum concept. Canadian Journal of Fisheries and Aquatic Sciences 37: 130-137.
Walsh, M. G., K. A. Bjorgo, and J. J. Isely. 2000. Effects of implantation method and temperature on mortality and loss of simulated transmitters in hyrbid striped bass. Transactions of the American Fisheries Society 129: 539-544.
Ward, J. V. and J. A. Stanford. 1983. The serial discontinuity concept
of lotic ecosystems. Pages 29-42 in T. D. Fontaine and S. M. Bartell,
editors. Lotic Ecosystems. Ann Arbor Science Publications, Ann Arbor, MI.