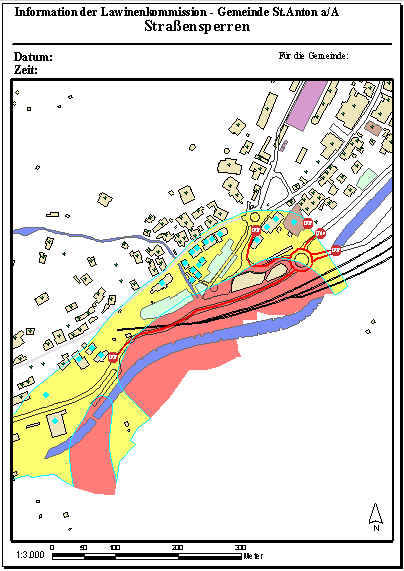
Map of Settlement in Hazard Zones
Back to Text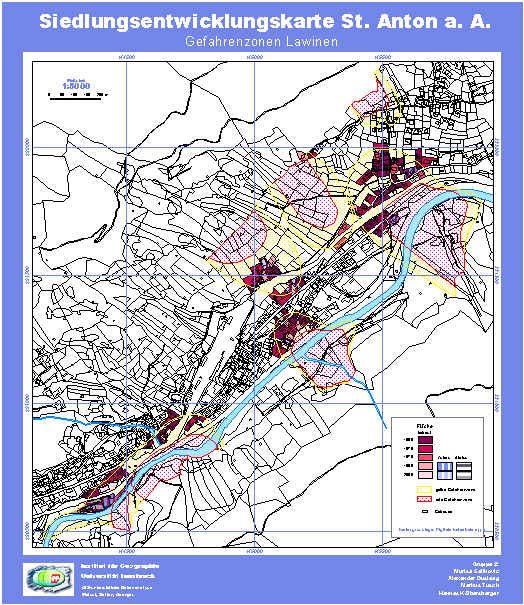
St.Anton a/A is a small mountain village with aproximately 2.500 inhabitants, situated 100 km in the West of Innsbruck at the boarder between Vorarlberg and Tyrol (Austria). During the winter-season the number of people living in St.Anton increases up to 12.000. The overnight stays per year have increased from about 32.000 in 1947 to about 1 million in 2000. The intense touristic development necessitate the investigation of a so called Integrated Risk and Crisis Management Plan. The connection of practical needs - related to natural hazards - with most modern prognosis and simulation technologies is managed by Geographic Information Systems. The structure and organisation of the Risc and Crisis Management Plan will be shown in the paper.
After the winter 1999 with its extreme events the Community of St.Anton a/A decided together with the Austrian Institute for Avalanche and Torrent Research
(Federal Forest Research Centre, Innsbruck / Vienna, Austria) to investigate an Integrated
Risk and Crisis Management Plan. There are several reasons to do this. As shown in the following chaptures during the high season St.Anton a/A is a very croweded
tourist resort. On the other side - and the good snow conditions are also a result of this - heavy snowfalls may occure. In generally this is, with respect to
the extended control measuers, not problematic. The Austrian Service for Torrent and Avalanche Control (Gebietsbauleitung Oberes Inntal) spent about 17 Mio. Euro
(approx. 14 Mio. US-Dollar) sinc 1988. The first measures where build in the year 1969. After that a Hazard Zone Map was created in 1979. On the base of this
Hazard Zone Map the intense construction of measures started. Previous to the Alpine Ski Championship 2001 accomplished in St.Anton a/A the measures control
reached its peak by creating approximately 3.000 meters snowpack-stabalizing structures and a catching dam with a earthmoving of about 140.000 cubicmeters within the
least three years.
In addition to this permanent measures the local government decided to initialize temporary measures to deliver tools to the decicionmakers. All this tools will
be summarized in the so called Integrated Risk and Crisis Management Plan. This paper will show the development of St.Anton a/A as a worldwide known tourist
resort (cf. chapter I.1.). Then, in chapter I.2. an overview of the total concept of the Risk and Crisismanagement Plan will be given. Subsequent to the
introduction to the touristical history of St.Anton a/A and the overview of the Risk and Crisis Managment Plan three examples of the application of Geographic
Information Systems (GIS) within the frame of the Risk and Crisis Managment Plan will follow. In the first example (II.1.) it is shown how GIS is helpfull in locating
areas where a Laserscanner can be situated. And it is also shown how GIS has to be extended to deliver a function to do this spatial analyse. In chapter II.2. it is
demonstrated how GIS can be used to interprete and analyse results of external numerical simulation models. The application of different standard GIS operations
(spatial query, thematic query) in risk and crisis management is shown in chapter II.3. with examples of roadblocks and evacuations related to avalanche danger.
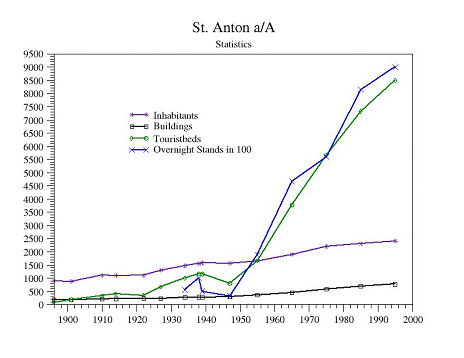
Figure 1: Developement of St.Anton a/A 1896 - 1999
The municipality of St.Anton a/A was funded previous to the 13th century and had several names. The new name St.Anton a/A was established in the year 1929. Due to the high altitude (1300 - 1580 m) in former times (pre winter tourism epoch) the village remained small with less than 1000 inhabitants. Until the end of the 19th century the main subsistence was earned by farming and traffic facilities. With the establishment of a railway connection between Innsbruck in the East and Bregenz in the West by tunnel under the Arlberg (1884) a constant development of the number of inhabitants, buildings, tourist beds and overnight stands occured. Until now specifically the number of overnight stands and tourist beds increased rapidly and constant (cf. Figure 1).
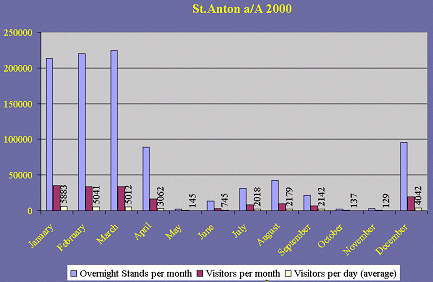
Figure 2: Overnight stands and Visitors in the year 2000
The last years the overnight stands per year are close to 1 Mio. St.Anton a/A is mainly a winter tourist resort with the greatest amount of overnight stands in January, February and March with sligthly above 200.000 overnight stands and approximately 30.000 Visitors per month. During the low season in spring with May and June and the low season in autumn with September, October and November there are only a few tourist visiting St.Anton a/A. Also in summermonths July and August the number of tourists visiting the village and its interesting and beautiful surrounding is only a small part compared with the winter season.
The entire Risk and Crisis Management Plan is divided in two main parts. i) The Riskmanagement with the tasks of Riskhandling and Planning of Measures
is subdivided in the two functional groups Riskanalyse and Riskassessment. ii) The Crisismanagement itself is subdivided in the functional groups Crisisprecausion and
Crisishandling. There is a clear border between this functional groups. This is clearly marked by the happening of a disaster or catastrophic event.
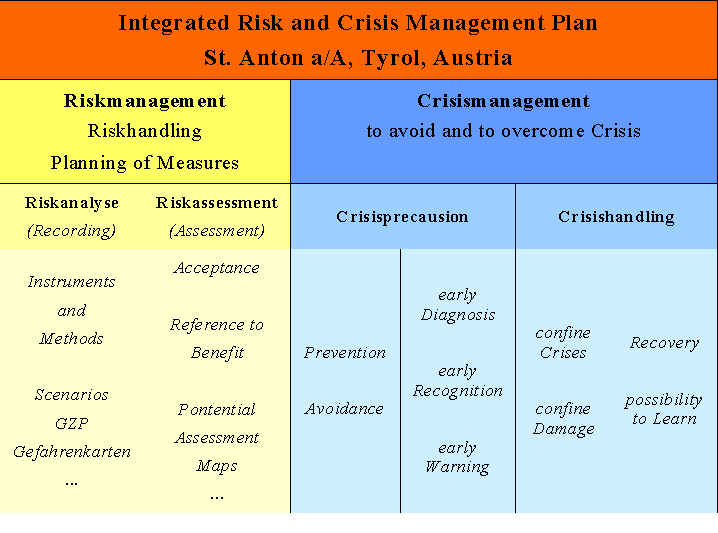
Figure 3: Concept of the Integrated Risk and Crisis Management Plan
One aim of the project is to implement the latest Simulation and Prognosis technologies to both parts - Riskmanagement and Crisismanagement
- of the entire plan. In terms of Riskanalyse a high developed numerical avalanche simulation model - SAMOS - is used to calculate scenarios and to create Scenario
Hazard Maps. This Scenario Hazard Maps are a input parameter to assess risk and to analyse the cost-value ratio. In Crisisprecausion too, the most modern Technologies
are implemented in the system of managing extraordinary situations. One example is shown below anonther example is the inclusion of Automatic Weather Stations with a
completely energy balance station. Both are used to get information of the situation in the release areas of potential avalanche areas and deliver a lot of parameters.
One of the most important parameters for the decisionmakers is the snow depth. Up to now snow depth measurements are related to one or only a couple of points. With
the new develeoped Laserscanner the snow distribution of an entire area can be gained. These are only a few examples of a complex system to make decisions (diagnosis)
and to come to an early recognition and an early warning system. A modern Crisismanagement is mainly related to a working communication and information technology. Of
course the most modern management and information technologies will be implemented in the Crisis Management Plan.
The legal aspects of the Integrated Risk and Crisis Management Plan are:
As mentioned above, St.Anton a/A is a high developed winter sport resort with nearly 1 Mio. overnight stands a year. It is already mentioned that January, February and March are the busiest months. But, these are also the months with the highest probability of avalanches. The maximum amount of coincidense probability between Tourist Seasonality and Exposure to Avalanches is reached (cf. Figure 4).
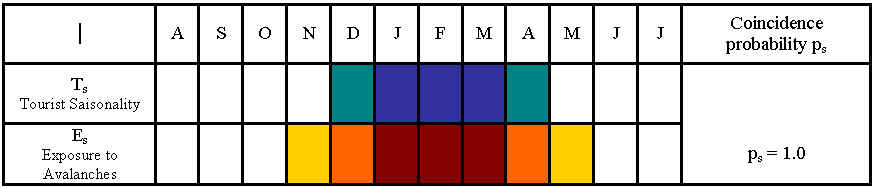
Figure 4: Coincidence probability
As shown in Map of Settlement in Hazard Zones and Figure 5 the number of buildings in the Yellow and Red Zones of the Hazard Map remains constant since the implementation of the Hazard Zone Map in 1979, although it would be legaly correct to build under legal restraints in the Yellow Zone, and although the settlment area is one of the limiting factors of St.Anton a/A. It seems to be a fact that the implementation of a Hazard Map is an appropriate tool to control settlement in endangered mountain areas.
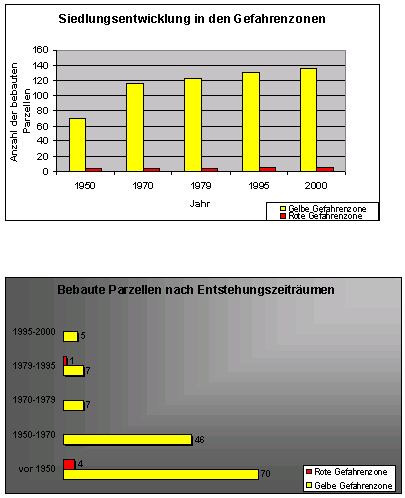
Figure 5: Developement of the Settlement Area in the Hazard Zones (Figures refer only to the central part of St.Anton a/A)
Even, as mentioned in the Introduction, the Austrian Avalanche and Torrent Control did a lot of measures in and arrount the municipality of St.Anton a/A the community of St.Anton a/A decided to implement a Integrated Risk and Crisis Managment Plan. This is mainly a result of the really intense touristic developement combined with the potential natural hazard risks. During the high season in avarage approximately 5.500 visitors are daily in the village. Additionaly to the nearly 4.000 to 5.000 inhabitants and employees in the absolute high season the total number of peoble living in the area reaches up to 13.000 to 15.000. Following this numbers and the fact that St.Anton a/A is situated in a distinctive mountainuous area a risk and crisis management plan as proposed by the author seems to be a reliable tool in managing natural hazards.
As already mentioned above up to now snow depth measurements are related to one or only a couple of points. With the new develeoped Laserscanner
the snow distribution of an entire area can be gained. The Laserscanner by itself has been developed from Riegl which is a company in Upper Austria. The hardware
installation has been done by
ILF Consulting Engineers, Innsbruck, Tyrol. The software applications and implementation has been done by
Joanneum Research, Graz, Styria. The Austrian Institute for Avalanche and Torrent Research function as scientific
attendance on topics related to snow, avalanches and implementation of the Laserscanner into the Risk and Crisis Management Plan.
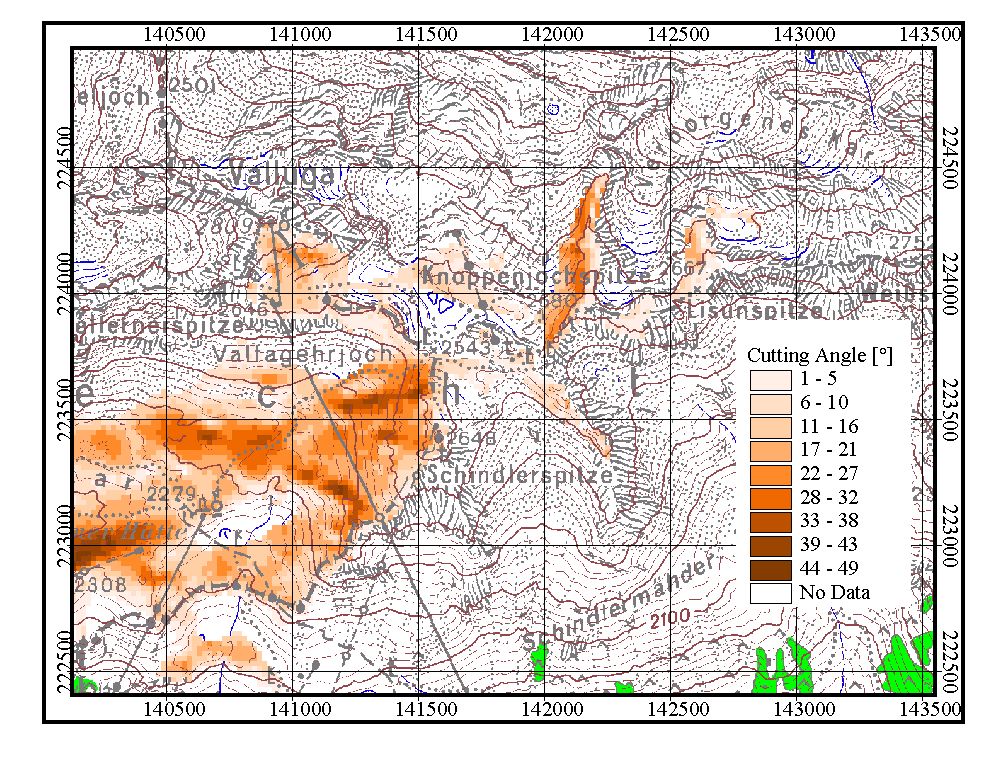
As the Laserscanner is only to be able to measure distances to visible areas below an cutting angle of approx. 30 to 35 degrees, GIS are a necessary tool to optimize the position of the scanner previous to its final installation. To do this, two components are combined to create a Map of Cutting Angles. First a standard function of nearly all Geographic Information Systems calculate the visibility of areas from a specific location (i.e. the intended location of the Laserscanner). This is the input GRID to calculate the cutting angle of the laser beam with the cell of the Digital Elevation Model representing the topographie. The lower the cutting angle the better the functionality of the Laserscanner. As the scanner covers areas which are within a distance of about 2.300 m this parameter is also to be considered in the cutting angle function which has been written at the Institute for Avalanche and Torrent Research.
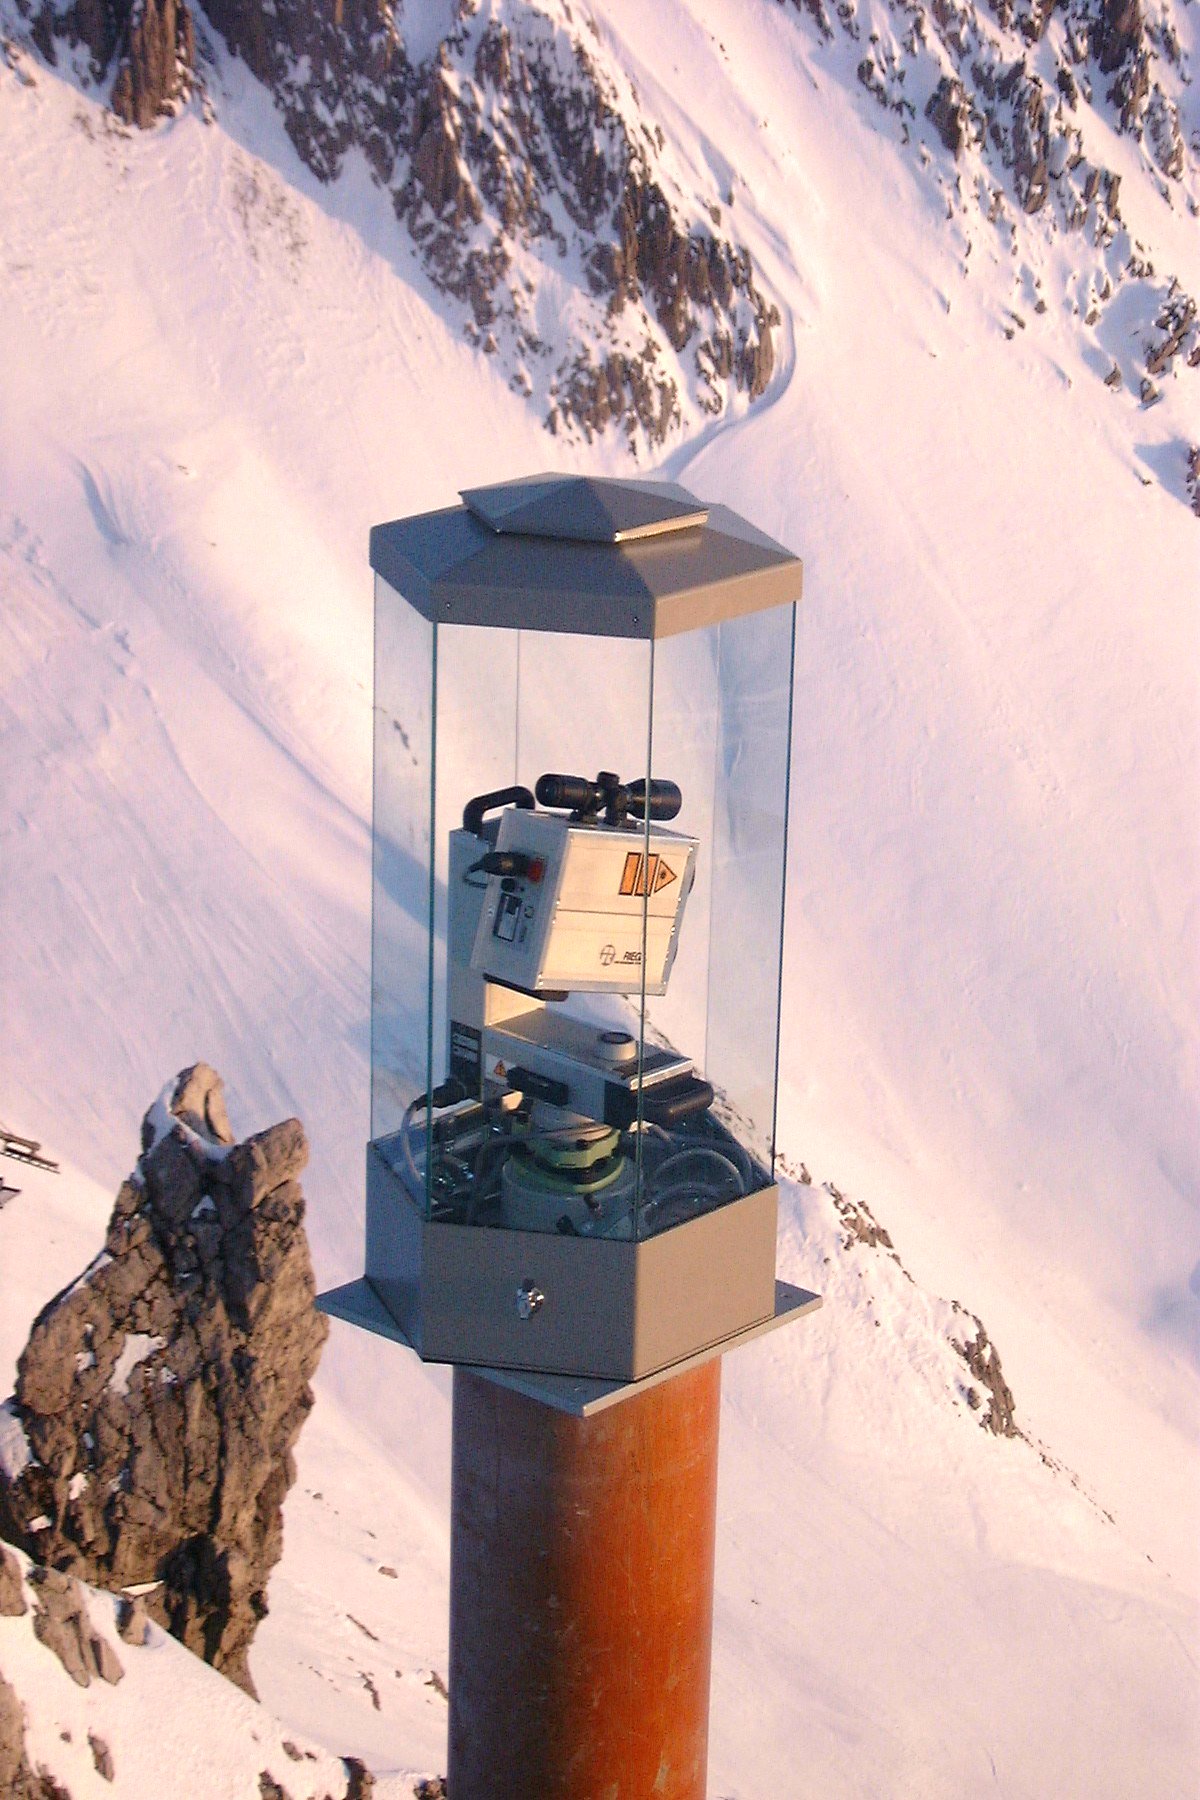
Figure 6: Laserscanner on the Valluga 2.650 m (Photo: Scheikl/Hochreiter, ILF)
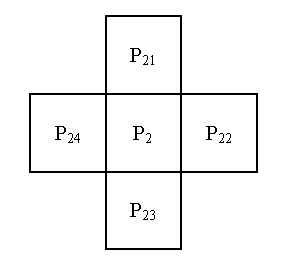
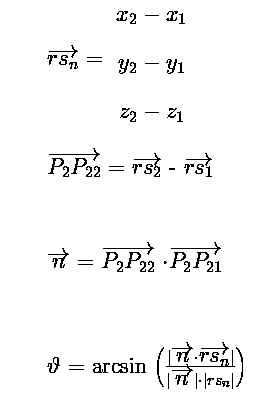
Figure 7: Cutting angle - cells and equations for plane of cells P2, P21 and P22
The calculation of the cutting angle follows simple vector analyses. First the inclined and exposed plane has to be described. This can be done by combining the cell of interest with the surrounding cells. Then the cutting angle between the beam of the source cell (i.e. Laserscanner) with the inclined and exposed cell can be calculated.
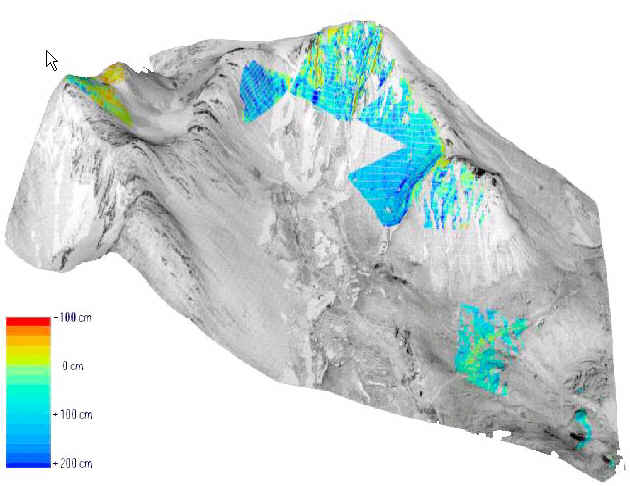
Figure 8: Example of a Scan Scene on the Valluga toward the Schindlerspitz (ILF, Winter 2001)
The background of Figure 6 shows the slopes of Schindlerspitz that represent an ideal position to the Laserscanner. The result of a scan session is shown in Figure 8 depicting the slopes of Schindlerspitz too. This spatial 3D scanning - in contrast to the common selective measurements - delivers valuable information about the snow depth over an area of interest. It is also possible to get information about wind direction and wind transport capacity by combining the scanning method with Automatic Weather Stations situated nearby.
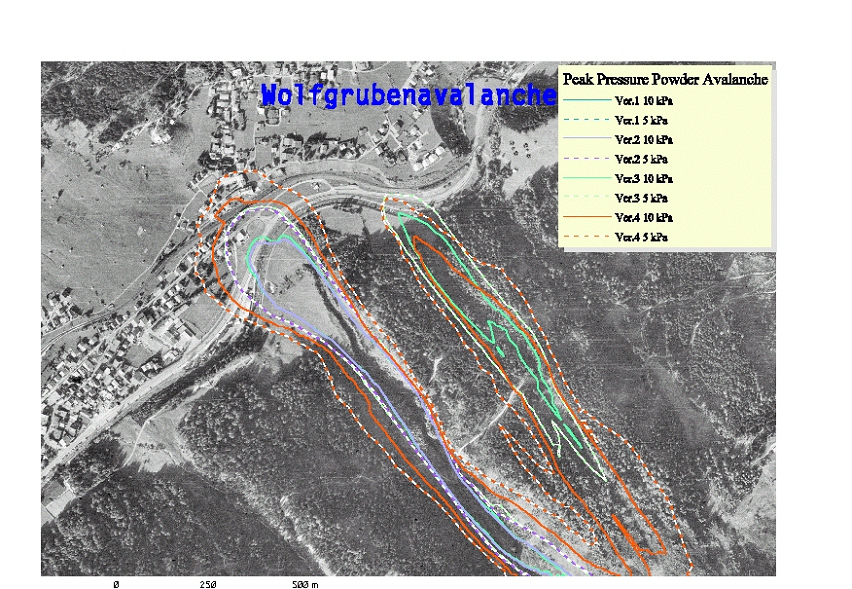
A central technique in the analyse of risk due to natural hazards is the processing of scenarios. With respect to snow avalanches the scenario processing is strictly realated to simulation models. In Austria the developement of a threedimensional avalanche simulation model based on fundamental fluid mechanics was done by AVL List, Graz in cooperation with the Austrian Instiute for Avalanche and Torrent Research and the Austrian Service for Torrent and Avalanche Control. SAMOS (Snow Avalanche MOdelling and Simulation) is a physically based model that couples a 2D granular flow model for the dense flow layer and a 3D turbulent flow model for the powder layer with a simple transition model (Sampl et al. 2000). In the year 2000 an entrainment module was added to SAMOS to calculate avalanches that work in the snow layer along the track (Sailer and Rammer 2001).
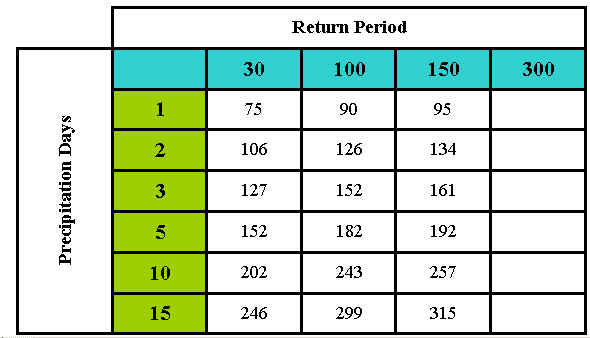
Figure 9: Extremum statistics of snow fall of the period from 1895 to 2000
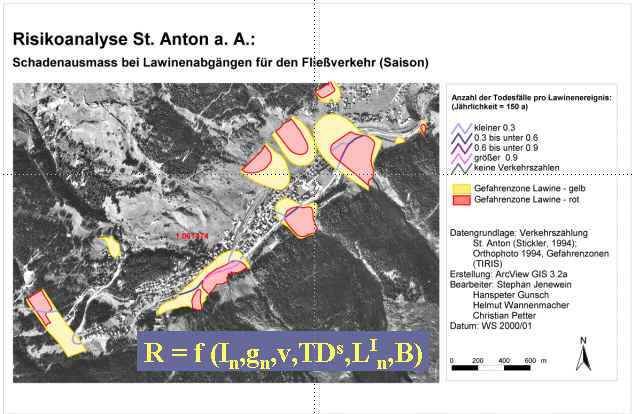
With regard to the scenario calculation with SAMOS the main information is gained from the extremum statistics that have been done from the Austrian Weather Service, Regional Centre Innsbruck. The amounts of several snow depths are grouped and classified to get at least three to four distinctly differing scenarios. The results of the simulation (run-out area, dynamic pressures, etc.)are transfered to the risk analyses (Map of Avalanche Scenarios). The output of the result of the numerical simulation with samos is spatially analysed with Geographic Information Systems. To calculate the risk to be killed in a specific to avalaches exposed road section is a function of (BUWAL 1999):
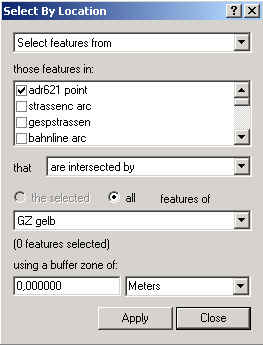
Figure 10: Spatial query of addresses in hazard zones
Even though control measures have been done on all relevant avalanche paths, in extraordinary cases road blocks or evacuations may be necessary. Ditto in the frame of evacuation plan and road blocks the simulation results are decisive parameter for the decisionmakers and the authority of St.Anton a/A. Few years ago the Tyrolean Government TIRIS (Tiroler Raumordnungs Informations System) started to georeference all addresses throughout Tyrol. Together with the Digital Hazard Map and the Digital Catastrial Map it is possible to build up the necessary steps to the evacuation plan completely within the frame of a GIS and without additional features. Starting with a simple spatial query (cf. Figure 10) and a thematic query the endangered road sections are highlighted (cf. Hardprint: Evacuationplan).
Additional to georeferenced addresses a database consisting of hotel and house names, together with phone and fax number, grid square and e-mail addresses is related to the addresses database. This offers the oportunity to have all major information to manage the information and mandatory evacuations (cf Figure 11). Additionaly to the hardprints the visualisation with an LCD Projector of the basic maps offers other advantages. During the meeting the decisionmakers do have all the same standard of knowledge with regards to the areas in discussion and the localities. And also in case of executing roadblocks or evacuations the visualisation and hardprint copies of the results of the meeting delivers a unique and from all members of the crises squad accepted opinion.
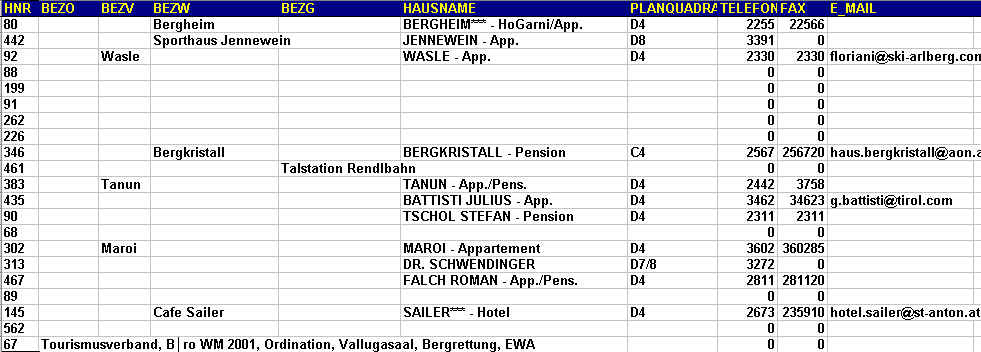
Figure 11: Result of spatial and thematic query
A Integrated Risk and Crisis Management Plan as introduced in this paper is a highly complex construction. The topics range from recording
and analysing natural hazard risks as a combination of hard field work and computer simulation to applied Crisis Management with the aim to prevent disasters and in case
of the occurance of a disaster to manage the critical situation. Provided that the policymakers have the readiness to invest time and money a Integrated Risk and
Crisis Management Plan supports additional tools to policy- and decisionmakers. Both, time and money, is required to fullfill all the steps of investigating agendas
and management plans with regard to crisis handling. This is not only true for the local authorities of the municipality but also for the next higher level of the
district government of Landeck. The establishment of an extended database is one of the efforts to a succsessfull execution of the Risk and Crisis Management in work.
Therefore a great number of organisations are involved in the implementation. Due to the high developed Geoinformation Departement of the Federal Province Government
of Tyrol (Noggler 2000) the mentioned demands are met in a wide range.
Particularly Geographic Information Systems are not only a helpfull but also a mandatory instrument to follow the needs of an effective Risk and Crisis Management Plan.
The above examples show the important role of Geographic Information Systems and their use in crisis management. All Integration Sector
(Sailer 2000) of GIS in analysing natural hazards are comprised in the entire system as suggested in this paper.
Map of Settlement in Hazard Zones
Back to Text
Map of Cutting Angles
Back to Text
Map of Avalanche Scenarios
Back to Text
Map of Risk on Roads
Back to Text
Hardprint: Evacuation plan
Back to Text
References
BUWAL, 1999. Risikoanalyse bei gravitativen Naturgefahren, Methode, 107/I. BUWAL,
Bern, 115 pp. Back to Text
Noggler, B., 2000. GIS im Intra- und Internet. Naturgefahren in Tirol. TIRIS. Back to Text
Sailer, R., 2000. GIS-Adaption in Avalanche Simulation with SAMOS. IUFRO Internationla Workshop: Hazard Mapping in Avalanching Areas.
Proceedings: 79-91. Back to Text
Sailer, R. and Rammer, L., 2001. Recalculation of an artificial released avalanche with
SAMOS and validation with measurements from a pulsed Doppler Radar. Natural
Hazard and Earth System Science, submitted. Back to Text
Sampl, P., Zwinger, T. and Schaffhauser, H., 2000. Evaluation of Avalanche Defense
Structures with the simulation Model SAMOS. Rock and Soil Engeneering, 1/2000:
41-46. Back to Text
Stickler, H., Hafele, R. and Greussing, E., 1994. Verkehrskonzept St.Anton a/A: Analyse und
Konzept. Ingenieurbüro Stickler, Innsbruck. Back to Text