The National Transition Database's GIS Module: A Management Information
Tool for the National Weather Service
Paula Kingsbury
Paper Submission #1097
The National Transition Database (NTD) provides
the National Weather Service (NWS) staff access to current information
about the implementation and status of the NWS's Modernization and Associated
Restructuring (MAR) initiative.
The Mission of the MAR initiative is, as stated in the Strategic
Plan for the Modernization and Associated Restructuring of the National
Weather Service :
To modernize the NWS through the deployment of proven observational,
information processing, and communications technologies and to establish
an associated cost-effective operational structure. The modernization and
associated restructuring of the NWS shall assure that the major advances
that have been made in our ability to observe and understand the atmosphere
are applied to the practical problems of providing weather and hydrologic
services to the Nation.
The modernization information includes office
transition summaries, equipment commissioning and decommissioning, certification,
occupancy and Weather Forecast Office (WFO) schedules. The NTD recorded
changes, additions and subtractions to personnel, equipment, offices, schedules
and timelines required for the modernization effort. This process began
with a congressional act in 1993 and was completed in fall of 2000.
The configuration of the NTD consists of a
core data base (CORE) and a series of working data bases (WDB). The CORE
contains the "official" status of the modernization activities; historical
and planned. The WDB supports managers by coordinating applicable activities
on a day to day basis. When the data in the WDB's gets approved and becomes
"official", it is then downloaded to CORE and accessed by the users. Each
account is tailored to the users specific needs. Each user has read and
report generation capabilities for the portions of the CORE and WDB's to
which they have access. The NTD provides both on-line and off-line support
and was designed to be responsive to the needs of all users.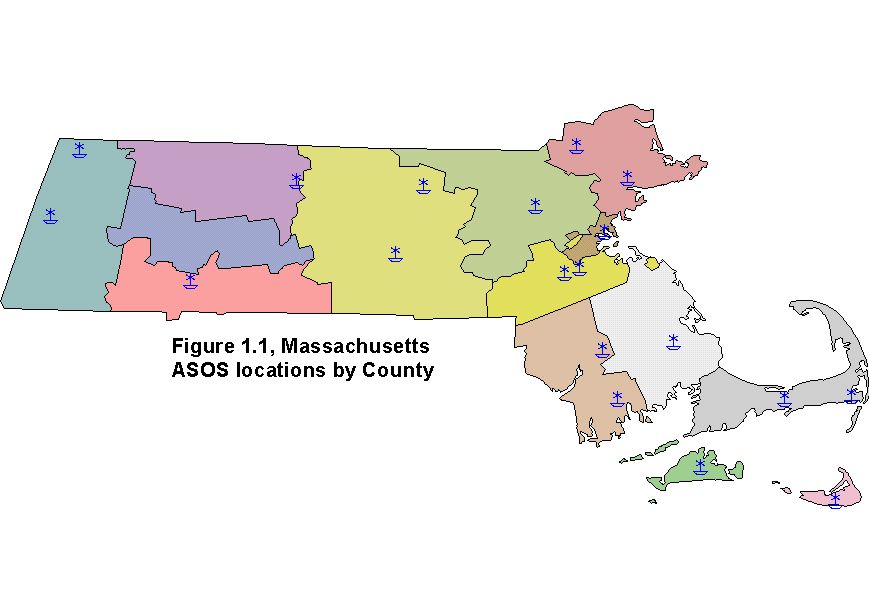 The
GIS module was formed in 1997 in the hopes to provide a graphic way to
disseminate information for managers as well as to document the status
of the commissioning and decommissioning effort. The data for the GIS was
structured in customized views to minimize database size and relevance.
For example, the Equipment view contains information such as name, office
id, latitude, longitude, equipment type, state and region to name a few.
This view provided all of the changes to the equipment data.
The
GIS module was formed in 1997 in the hopes to provide a graphic way to
disseminate information for managers as well as to document the status
of the commissioning and decommissioning effort. The data for the GIS was
structured in customized views to minimize database size and relevance.
For example, the Equipment view contains information such as name, office
id, latitude, longitude, equipment type, state and region to name a few.
This view provided all of the changes to the equipment data.
Figure 1.1 displays a map of the Automated
Surface Observing System (ASOS) for the state of Massachusetts along with
a county overlay. From this example, it is easy to see which counties contain
specific equipment. There are several kinds of equipment that the NWS manages
including ASOS, NOAA Weather Radio Transmitters (NWR) and Next Generation
Radar (NEXRAD). These systems have defined coverage areas. From a management
standpoint, being able to ensure that every area of the United States has
coverage became easier using a GIS.GIS uses became clear as more people
became interested in the capabilities of linking into the NTD and using
the current data . Once such example is each Weather Forecasting Office
(WFO) is responsible for all forecasting activities within its County Warning
Forecast Area (CWFA). All equipment in that area has a reporting office
linked to that WFO. Linkages were made in the NTD to track these connections.
Figure 1.2 shows the Southern Region and the
associated CWFA's along with their WFO ID. When a quick moving thunder
storm or flash flood occurs, it is important to know which WFO is responsible
for coverage and thus, the equipment tied to that WFO can be utilized to
monitor and take weather readings. It is also useful for planning and management
efforts to ensure proper coverages for all counties and on the flip side,
not to overburden the resources of the WFO.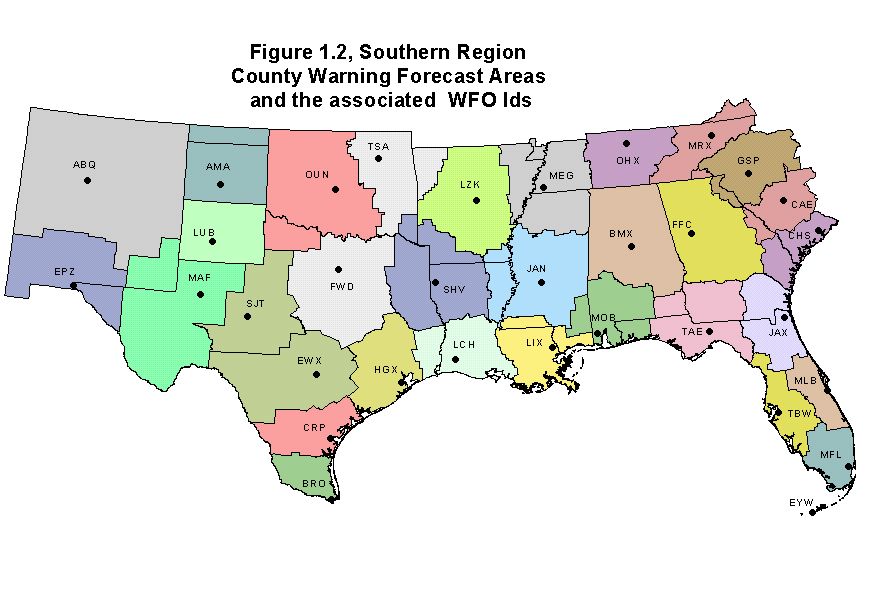 As the commissioning phase of MAR continued on, a web page was developed
to track the status of offices and circuits. The method of MAR was to bring
the new Advanced Weather Interactive Processing System (AWIPS) on line
and then, start to 'decommission' the older Automation of Field Operations
Services (AFOS). In this effort, maps were made every week to check the
status of each location.
As the commissioning phase of MAR continued on, a web page was developed
to track the status of offices and circuits. The method of MAR was to bring
the new Advanced Weather Interactive Processing System (AWIPS) on line
and then, start to 'decommission' the older Automation of Field Operations
Services (AFOS). In this effort, maps were made every week to check the
status of each location.
Figure 1.3 illustrates the AFOS circuit status
in the western region. The dashed lines represent the circuits that had
been decommissioned while the solid line represents the 'still active'
circuits
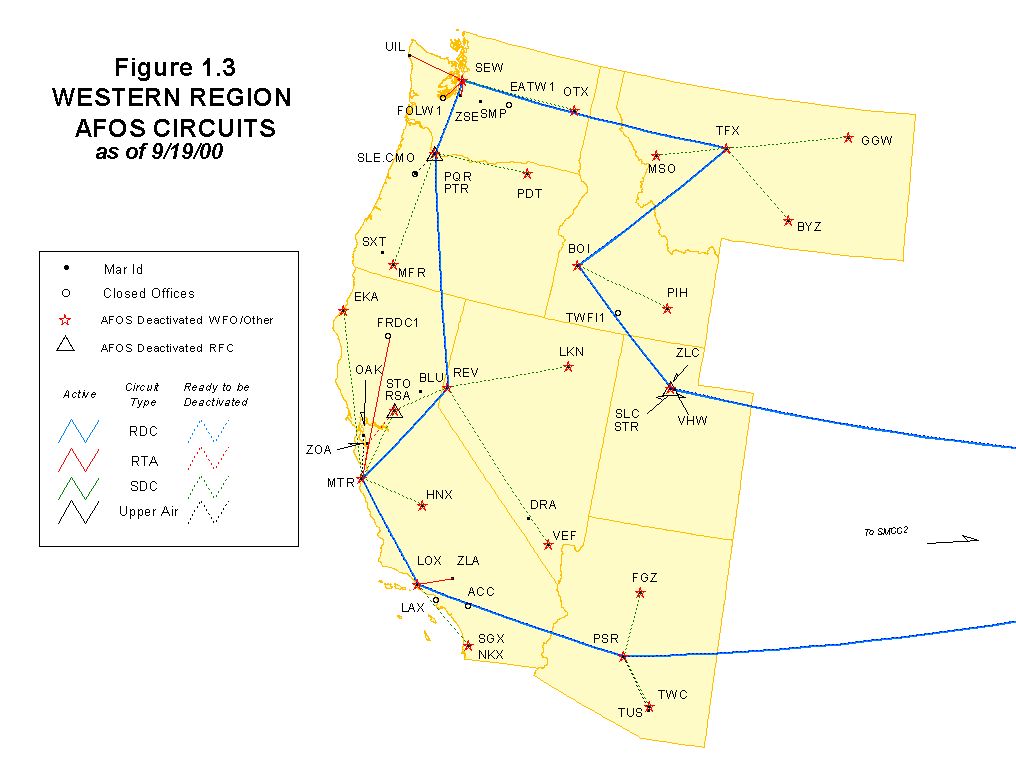
at the time of map generation. From these regional maps, the offices
could determine their status in the decommissioning process. The larger
circuit (Blue) on the Western Region map could not be 'decommissioned'
until the smaller (red, green), outer circuits had all been deactivated.
To activate a change in status to decommissioned required all hardware,
office space and personnel were re-allocated thus forming a 'closed' site.
Once that paperwork was received by NWS Headquarters, the main circuit
could be decommissioned.
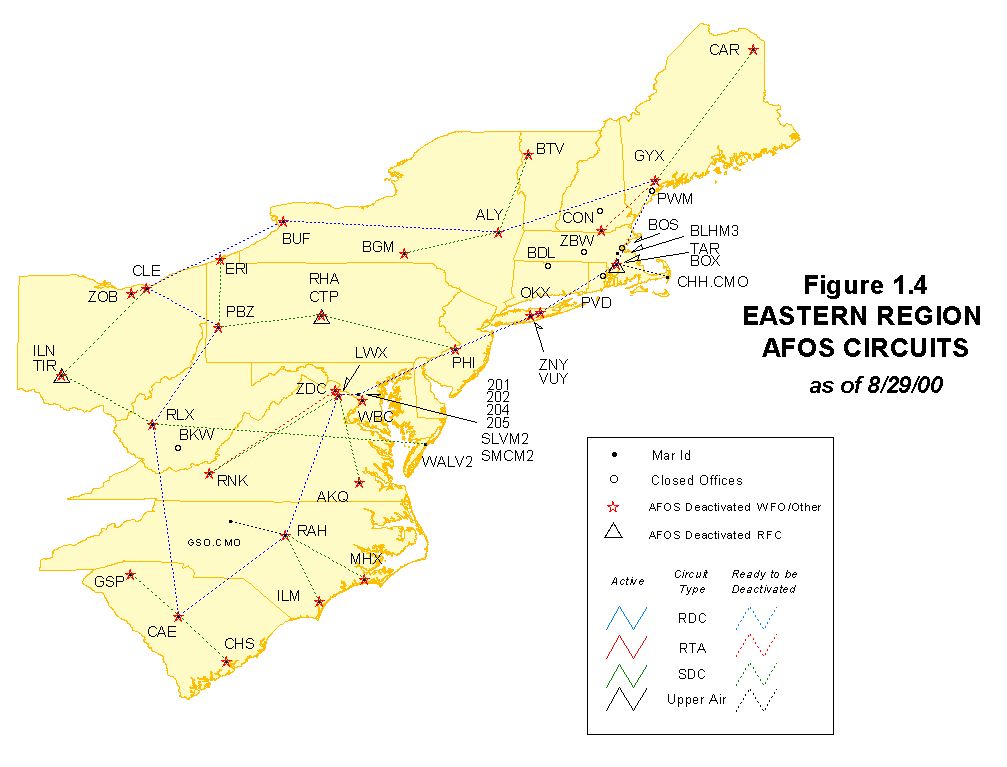
Figure 1.4 shows the Eastern Region AFOS circuit
map. Here, all the circuits are represented by dashed lines, indicating
a decommissioned status. While the decommissioning process was going forward,
the commissioning of the AWIPS circuits had already been completed.
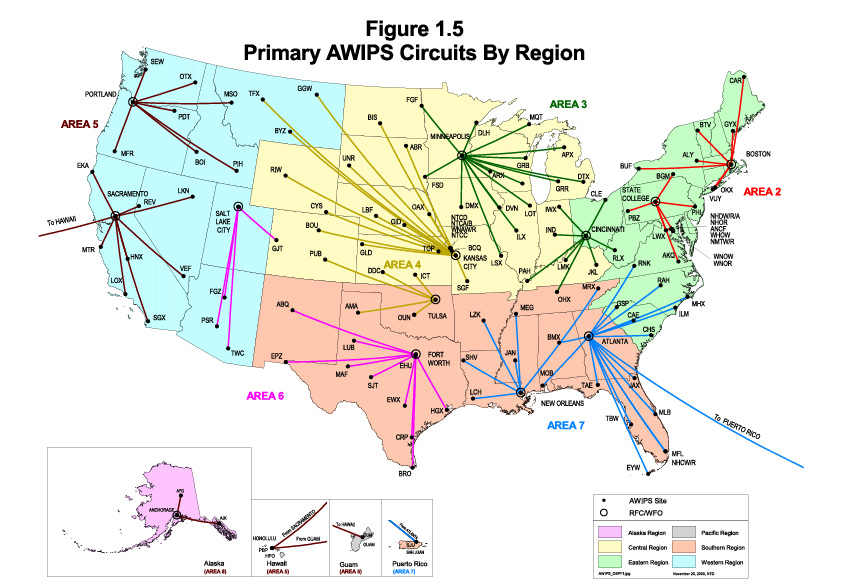
One of the requirements of the plan was before
the decommissioning of AFOS began, AWIPS must be active. Figure 1.5 is
a U.S. map of the Primary AWIPS Circuits. The AWIPS circuit design included
multiple backups to ensure reduntant connectivity for all offices.
Another data resource utilized for NWS maps
are shape files created by a group that maintains all county warning forecast
and zone forecast areas for AWIPS (Web:
http://isl715.nws.noaa.gov/mapdata/newcat/).
These files are available in shape file format, contain metadata history
and can be downloaded from the web. These files are important because if
changes are made to zone boundaries or CWFA's by headquarters or a particular
region, then any map published on the web or in hardcopy, must reflect
the new data.
The NTD has been seen as a success in data
management for the MAR effort. Looking ahead and seeing the possibilities
of having such a system as the NTD making NWS data accessible, is a new
concept called the Management Information Retrieval System(MIRS). MIRS
would take the success that the NTD had and expand the concept. Most of
the data in the National Weather Service has been isolated and not easily
accessible. The plan for MIRS is to provide linkages to the many different
databases so that the issue of accessability can be overcome. Each program
office or group that provided a linked database would be responsible for
maintaining all updates to the data. However, one of the challenges to
this configuration is to establish a level of data formats and linkages
so that all levels can be intertwined. This is a new plan and direction
that the Weather Service is taking.
The NTD GIS platform was using ArcView 3.2
and ArcExplorer 2.0. Plans are now being formed to upgrade to ArcView 8.X
and incorporate modules such as ArcIms, ArcSDE, and Spatial Analyst. The
objective in the next few months is to take the existing ArcView projects
and transfer them to the web using ArcIms. A prime example are the state
maps that show all equipment and forecast zones. These currently are only
available in hard copy reports. The maps would have greater utility if
users are able to customize or perhaps overlay different data layers for
research or planning purposes.
There is a changing trend within the NWS to
expand and explore all that a GIS can offer. The new MIRS implementation
will move GIS management and planning into the spotlight. The map component
of MIRS is considered a large facet of the system and is being configured
to expand along with the demand. In the future months, testing and implementation
will occur on all levels. Expecations are high that MIRS will provide an
accurate and user friendly system for all forms of NWS data management.