Using GIS to Estimate Threatened Sunflower Distributions
Stephen C. Brown
University of Texas at San Antonio
O. W. Van Auken
University of Texas at San Antonio
Abstract
Raster GIS (ArcView with the ArcView Spatial Analyst extension) was used to model community distributions and changes in populations of the threatened Puzzle Sunflower in the northern Chihuahuan Desert. This presentation will demonstrate how GIS can be used to streamline and enhance the process of estimating plant distributions from sampling transects. Participants will learn how a GIS analysis can reveal community changes that, without a GIS, would ordinarily be very difficult to detect. Because the flower is a threatened species, revealing its location could be detrimental. A method for creating GIS data that is not tied to real-world coordinates will also be demonstrated.
Background
The Diamond Y Spring Preserve is an inland salt marsh along Leon Creek in Pecos County near Fort Stockton, Texas. This salt marsh is ecologically important because several threatened and endangered plant and animal species occur here. Of interest to researchers at the University of Texas at San Antonio (UTSA) was the community relationships and interactions of the threatened sunflower Helianthus paradoxus (Puzzle Sunflower). For the purpose of this study, it was important to estimate the total number of H. paradoxus and to create surface plots of its community distribution(s) and that of other plant species across the marsh.
Traditional ecological sampling methods for estimating the total plant population meant taking random field samples and statistically calculating total population. While that is still necessary, creating surface plots of community density was more difficult using traditional methods. The manipulation of class breaks in such surface plots was much harder still. However, ArcView's Spatial Analyst extension offers a new tool to the ecologist to easily overcome these barriers.
Methods
A grid corresponding to transect sample points in the marsh was created with AutoCAD. The advantage of creating a transect theme in this manner is that there are no "real world" geographic coordinates associated with the grid. Had a georeferenced basemap of the area been used or the sampling transects mapped with Global Positioning Receivers, it would be easy for collectors of rare flowers or other species find the site. Such a method uses "digitizer table units" for geographic coordinates.
Using the Geographic Information System ArcView (version 3.1) and its Spatial Analyst extension (version 1), this grid was interpolated into a raster surface plot. Cover and density measurements for each species were calculated using the Inverse Distance Weighted (IDW) method. The 12 nearest sample points (neighbors) were used in making the calculations. The number of plants sampled at each transect point was used as the Z value. Contour plots were prepared for each species using cover or density (depending upon which method was more species appropriate). Because the H. paradoxus population had been sampled over several years, it is possible to use map subtraction via the map calculator function to model increases and decreases in the sunflower population or to create "average" maps based upon multiple years of data.
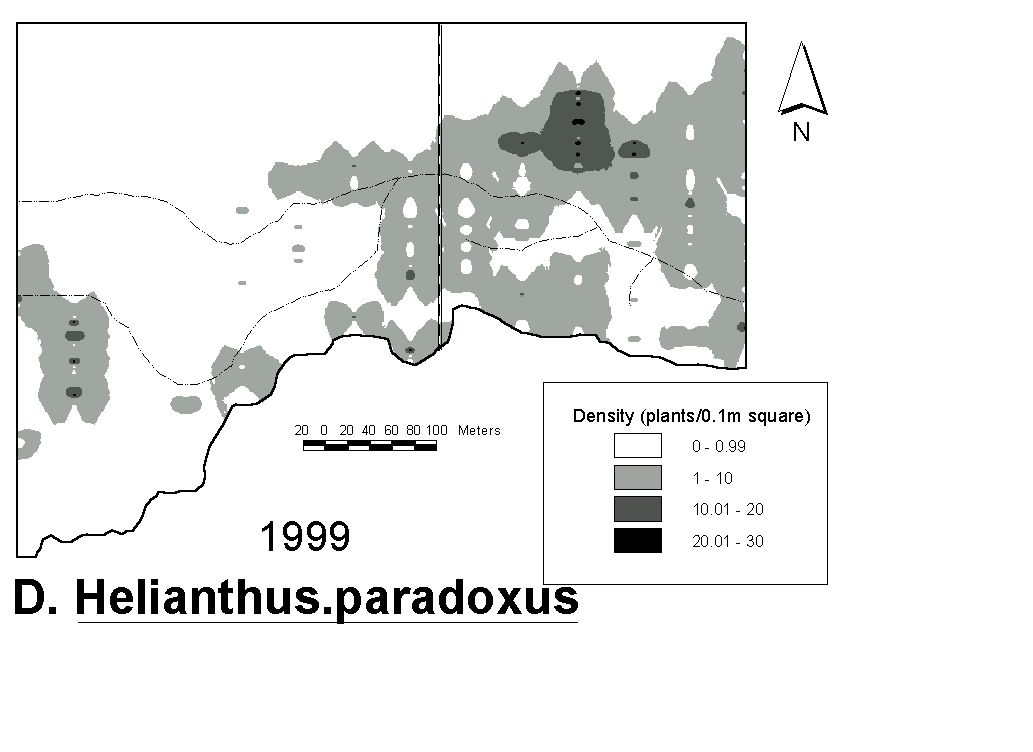
A black and white plot was used, with various shades from white with lowest density (zero) to black with the highest values, because of the complexity of the distribution. Black and white was also used because many scientific journals do not have the ability to print in color. Plots with as many as 23 cover or density classes were examined, but the best visual presentation was found when only four classes were used (Figure 1.).

Figure 1. Density of Helianthus paradoxus calculated using Spatial Analyst. Total area of this map and the individual species distribution maps is 21.85 ha.

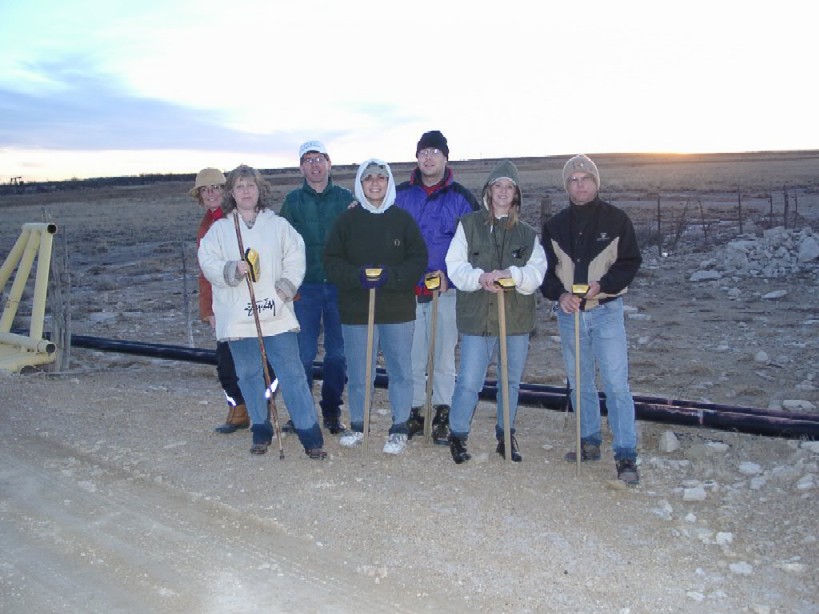
Figure 2. University of Texas at San Antonio Researchers with the Diamond Y Springs Preserve in the Background.
Acknowledgments
The University of Texas at San Antonio's Department of Earth and Environmental Sciences would like to acknowledge the thousands of hours UTSA graduate students have invested in researching and documenting the ecology of this beautiful resource (Figure 2.) Additionally, UTSA thanks the Nature Conservancy for their cooperation in this project.
Authors
Stephen C. Brown, Ph.D.
and
O. W. Van Auken, Ph.D.
Department of Earth and Environmental Sciences
University of Texas at San Antonio
6900 N. Loop 1604 West
San Antonio, Texas 78249-0663 USA
(210) 458-4455