This paper will describe the process of creating a Web Application that uses
WWW to publish and distribute GIS data to the citizens of Alachua County in Florida.
The Web Application reflects an effort from the Growth Management Planning Department
to increase opportunities for civic engagement seen as critical to successful planning.
This paper will discuss our approach to the selection and creation of the data,
to the design of the application, and to the selection of the map serving software.
The paper will outline the anticipated value of such an application to citizenry decision
making, and it will highlight potentials for future development of the application into
a stand-alone educational tool for middle and high school students.
Keywords:Web Application, Map Servers, GIS Data, Urban Planning
Many major elements for an enterprise GIS, such as data warehousing, compliance with
data standards and a standardized map production system are currently in place in Alachua
County. The Property Appraiser's office is the major hub of the GIS enterprise and currently
the most appropriate one for creating a societal GIS.
Nevertheless a significant void exists for a well designed and fully functional
departmental GIS in many of the County's Departments. At the Growth Management
Department, faced with the issue of finding a best suitable implementation model for
GIS, within the existing infrastructure of network, hardware and software, and driven by
the goal to implement one in a relatively limited time, our attention was turned toward
investigating a web based GIS model.
Rapid growth of the Internet over the past decade has opened up new ways to supply data,
tools, models and other information for potential users. Internet delivery provides
opportunities to increase invlovement of stakeholders in the decision-making and planning
process at the same time providing a scalable model for a departmental GIS.
A prototype application was developed to serve as case study for a web based implementation
model for a departmental GIS at the Growth Management Department, in Alachua County.
This web application for now bundles together data that had existed in one form or
another
in the department, scattered and burried under several layers of subjective knowledge.
This prototype application provides for viewing, querying, identifying, downloading, and documentation
browsing of these data. It allows for better data discovery, impact analysis,
and public review, facilitating ease and speed of information retrieval.
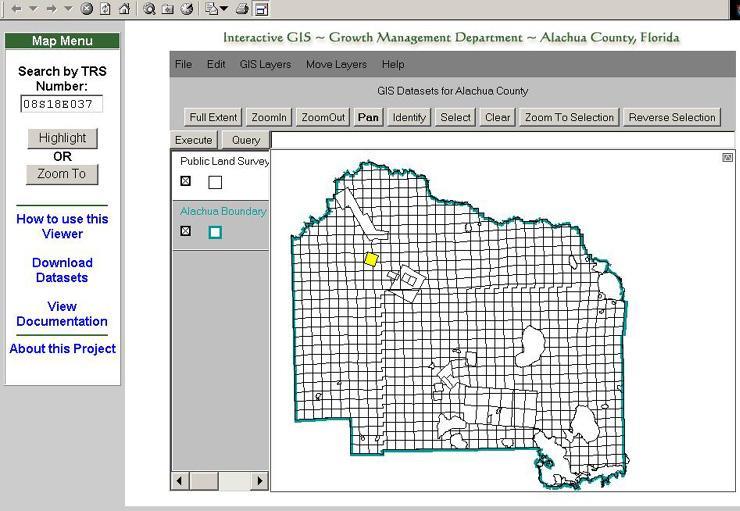
The user interface chosen for this project is a typical web browser. Microsoft Internet Explorer 4.0+ or Netscape Navigator 4.06+ were the browsers that were used. The browser interface provides a simple means for remote users to interact with the GIS data. A basic assumption was that in this age of a computerized society, most citizens and professionals in the department, already possess some basic intuition for manipulating a simple GUI. The interface consists of three frames. A vertical frame along the left side of the user's screen contains hyperlinks to the main functions of the application and a Township Range Section (TRS) search form. The search form allows for narrowing down the geographic area of interest to a specific TRS. A horizontal frame across the bottom of the user's screen provides space for information coming from the database. The horizontal frame displays pre-defined relevant information from the database, including photographs if available. The main frame predominates the user's screen and contains the actual viewer which is determined by the screen resolution of the client's computer at upload time. Users with high screen resolutions are able to view more graphical map detail than users with low resolutions. By default, the Alachua County Boundary and the Public Land Survey System (PLSS) data layers are initially loaded on this viewer.
The JShape object module which is a java applet, was used to implement the application. JShape can be easily integrated into an existing web site, or in an entirely new site which can take full advantage of JShape's external controls. The dimensions of the object can be controlled keeping any functionality or features. JShape's user interface mimics the look and feel of most contemporary applications. The java applet follows standard GIS software conventions, such as dataset layering, symbolic coloring, and detailed data reports of selected map features. The user can zoom and pan the maps quickly to find more information about specific areas. JShape allows for customization of only one of the five drop down menus. The other four menus cannot be modified from the author's original design. HTML, JavaScript, and JShape's Script were used for the coding implementation of the application. JShape version 2.19 was used for the purposes of this study. However, JShape version 3.0 as a commercial package has been released since the beginning of this project and it includes many enhanced features and controls.
Figure 1. The user interface implemented as a single point of contact.
Explore Datasets
Main Functions of the Application
Once the JShape viewer has been loaded, the user has control over what data is displayed
on the map. The prototype presently has 32 data layers.
As additional layers are loaded, they are stacked on top of the previously loaded layers.
The order in which the layers are stacked can easily be changed using the integrated menus
of the JShape viewer. Users can also select and zoom too specific areas of interest using
the integrated JShape controls.
Once a data layer is loaded, the user can retrieve detailed information about single
features of the layer. By clicking the Identify button located along the top of the
JShape viewer, the user can simply click on a feature of interest.
If any additional information can be found in the database for the chosen feature,
it will be displayed in a table at the bottom of the user's screen.
This process can be repeated indefinitely without having to reload the entire web site
or the JShape viewer. For selected data layers, small pictures will appear in the data
table. By clicking on the pictures, a new browser window will open, displaying a full
size photograph, in a hotlink model.
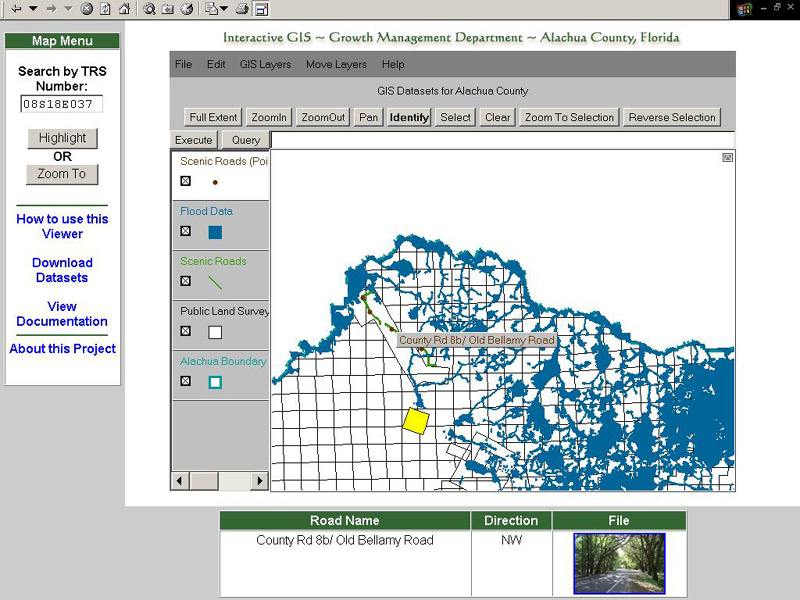
Figure 2. A hotlink function and some layers.
Download Datasets
Most of the datasets used in this application, are also
available for download in zip format.
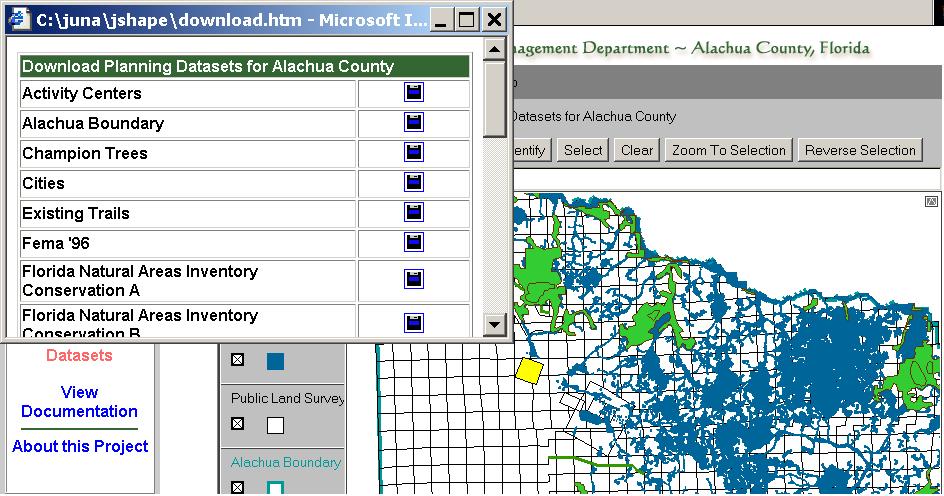
Figure 3. Download Interface.
Browse Metadata
A list of datasets with corresponding hyperlinked metadata is also available.
Part of the metada was created at the FGDL (see 'GIS Database' for details),
part of it was created at the Growth Management Department, Alachua County, Florida.
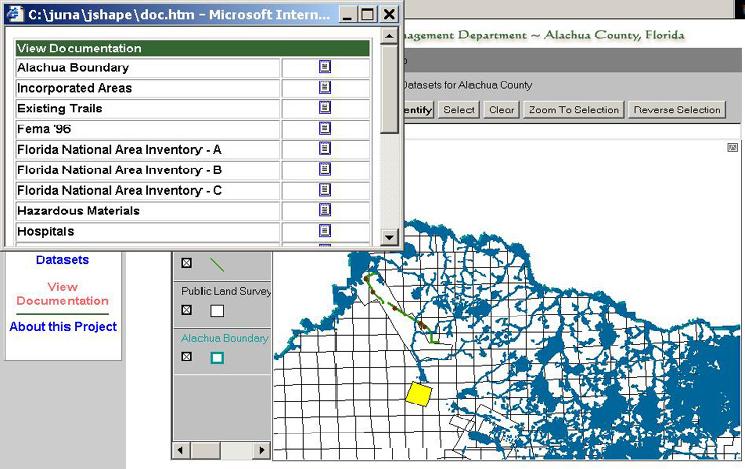
Figure 4. Metadata Interface.
Tutorial
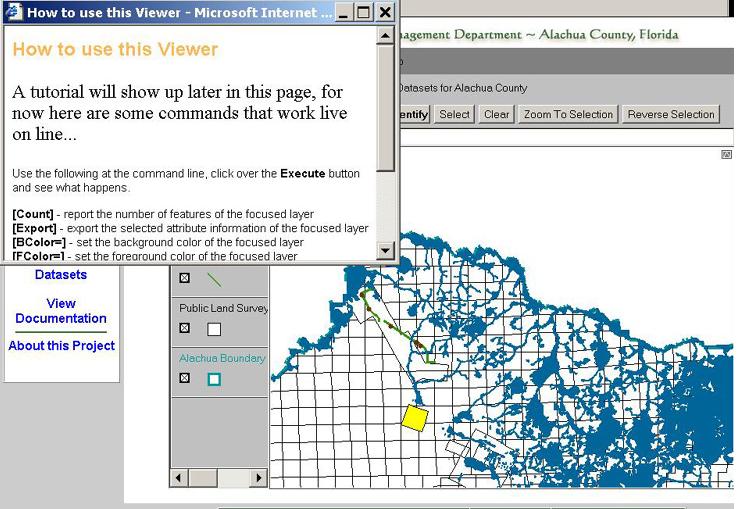
Figure 5. Tutorial Interface.
Part of the datasets used in this prototype comes from the Florida
Geographic Data Library (FGDL), prepared at the GeoPlan center, University of Florida.
FGDL is a mechanism for collecting,
standardizing and distributing GIS data for the entire state of Florida on
CD-ROMs (See http://www.fgdl.org/ for more
information). We re-projected the FGDL data and clipped it to our own requirements.
The other part of the datasets was created at the Growth Management Department,
Alachua County, during the current and recent years.
JShape uses standard file formats to display map information.
We used shapefiles which can be compressed down to 20% of their original size,
to minimize file size and network traffic.
Data files are used to link detailed information to the features defined by the shape file.
Text files or DBF files can be used along with the shapefiles.
When the client requests a data layer, the shape and the corresponding attribute file
are loaded by the JShape applet. Once loaded, the map is redrawn to show
the new map features. The size and color of the drawn features can be customized
for each data layer. A legend is sometimes used to differentiate between separate
portions of any single data layer. The datasets for a single layer vary greatly in
file size, ranging from 10 kilobytes to 20 megabytes. The file size is a major
concern when the JShape data is accessed over a network. Since the applet downloads
the entire dataset, instead of just the data in which the user is interested in,
long loading times are expected. In a typical intranet environment, a user can expect
to wait three to four minutes for the larger datasets to load. Even longer download times
can be expected for remote users accessing the data through a dial-up modem.
a. Zero costFor the purposes of this project and future development, we will focus on researching the use of the commercial JShape 3.0. The commercial release of JShape includes more GIS features and data connectivity options. The major factors involved with this decision are cost, customization, and the available skill level of our web developers. We will also be researching the feasibility of connecting the JShape interface with Oracle databases, allowing live access to current GIS data. More data layers will also be implemented for more meaningful data analysis.
b. No server required
c. Simple installation procedures
d. Fully customizable and integratable into existing web sites
e. Required expertize
f. Standard GIS Menu navigation
g. No geoprocessing features
h. Hotlink capability
Had it not been for the impeccable support of Rick Drummond, Director, Growth Management Department, Alachua County, Florida, this paper and the work behind it would still be an illusion. The authors would like to thank him.
Rocheleau, Bruce (1995). "Computers and Horizontal Information Sharing in the Public Sector."
In Harlan J. Onsrud and Gerard Rushton (Eds.) Sharing Geographic Information (pp. 207-229).
New Brunswick, New Jersey: Center for Urban Policy Research.
Scarponcini, Paul (1997). "Eyes of the Enterprise", Database Programming and Design, (p. 51-60).
Brobst, Steven and AVR Venkatesa (1999). "Active Warehousing", Teradata Review, Spring,(p. 26-33).
Author Information:
Juna Goda Papajorgji is GIS Coordinator at the Department of Growth Management in Alachua County, Florida, and a doctoral student at the department of Urban and Regional Planning at the College of Design, Construction and Planning at the University of Florida. Contact her at: juna@ufl.edu.
Paul Zwick PH.D., is Chair of the Department of Urban and Regional Planning and Director of GeoPlan Center, at the College of Design, Construction and Planning at the University of Florida. Contact him at: paul@geoplan.ufl.edu.
Timothy Clark is a sophomore student at the College of Computer Engineering at the University of Florida and a GIS intern with the Growth Management Department in Alachua County, Florida. He is an aspiring skaters club president. Contact him at: sk8ertim@ufl.edu.