 (/p>.
(/p>.
The features that make the Red Sea so valuable ecologically and economically are also leading to its demise through the demands of oil exploration shipping and tourism. The resulting loss of biodiversity and marine pollution is not affecting the quality of the red sea itself, but also the well-being of people in the seven nations who claim it shores. The aims of this present research is to study the biodiversity of Mersa Alam- Hammata sector including the delta of Wadi Gemal of the Red Sea in terms of terrestrial flora and fauna and marine species composition , and propose with areas for conservation activities. This was achieved by developing a geodatabase and inventories of the coastal and marine ecosystems and resource uses and analyse the data spatially for assessing suitability for developmental activities. This geodatabase will be available to governments, universities and private sector interests for the purpose of promoting the knowledge of this area. The main goal to be achieved by these conservation activities is to maintain the habitat and biological diversity, the culture of local inhabitants and orient the coastal management to ensure sustainability.
The Red Sea is a body of water like no other, in that it is a semi-enclosed sea communicating only with the Mediterranean through the man-made Suez canal and with the Indian ocean through the shallow Bab El-Mandab strait. This unique physiography has created a marine environment that supports flourishing coral reefs and endemic wetland communities in latitudes far north of their limits elsewhere. Ironically, the features which make the Red Sea so valuable ecologically and economically are also leading to its demise through the demands of oil exploration shipping and tourism. The resulting loss of biodiversity and marine pollution is affecting the quality of the red sea as well as the well-being of people in the seven nations who claim it shores.
Like the other Red Sea nations, Egypt is the state of rapid economic development and population growth that is placing intense pressures on its limited natural resource base. This situation is coupled with a number of socioeconimc, institutional and ecological realities that provide both constraints and opportunities for how Egypt manages the short-and long-term exploitation of these resources. All parties who depend on the productivity of the Red Sea realize that the fragile terrestrial, coral reef and marine environments of this globally unique coast cannot withstand continued unregulated, unmanaged development.
The aims of this present study is to study the biodiversity of Mersa alam- Hammata sector, (including Wadi Al-Gemal area) of the Red Sea, in terms of terrestrial vegetation and marine species composition, as one of the proposed areas for conservation activities, This was achieved by developing a geodatabase and inventories of the coastal and marine ecosystems and resource uses that would be available to governments, universities and private sector interests for the purpose of promoting the knowledge of this area. This geodatabase produced is based on GIS applications and is used as a planning tool to define sensitive areas along the coast that need detailed plans of action for conserving the biodiversity of the area under study.
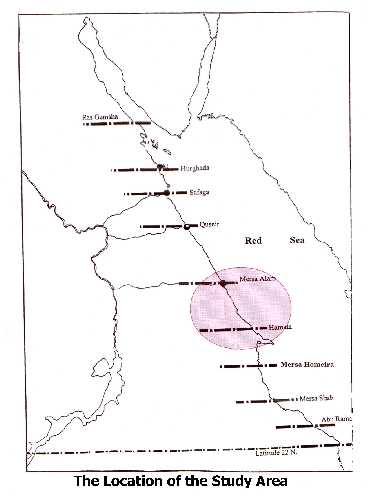
The area under study is a sector of the Red Sea coastal system. It encompasses a segment of the Red Sea coastal plain and mountains (refer to the following section "The Red Sea Environment"). It is located between 24° 25` N in the north and 24° 05` in the south, and between Red Sea shoreline in the east, and about 34° 40 E in the west and covers 70 km north/south. It is bounded by Mersa Alam on the north, and Hammata/Wadi Gemal on the south including Gebal Hammata and deltas of Wadi El-Gemal (Figure 1 )
The area encompasses a variety of habitat diversity, which include mangrove communities, intertidal mud flats, littoral salt marsh, oasis like vegetation, open Hammada plains, mountains and wadis. This diversity of habitats supports a parallel diversity of flora and fauna. Studies dealing specifically with the mangal in the Red Sea have been conducted principally in Sinai (Por and Dor, 1975; Dor and Por, 1977; Por et al, 1977; Dor and Levy, 1984, Por, 1984), and have considered several aspects of mangal ecology and productivity. Mangal surveys have also been undertaken in other parts of the Red sea, such as Egypt (Zahran, 1965; Kassas and Zahran, 1967, Zahran, 1977), Yemen (Draz, 1956; Ormond , 1980) and Saudi Arabia (Vesey Fitz Gerald, 1957, Zahran, 1974, 1980; EESAL, 1984; Price et al, 1987). The mangal of the Red Sea represents a composite habitat containing both hard and soft substrates, and is inhabited by fauna typical of each (Price et al, 1987). The area exhibits high esthetic and diagnostic features such as mangroves in Wadi Gemal, and rugged basement mountains in Hammata.
The island of Wadi El-Gemal is an important bird nesting site. Over 500 Sooty Gulls Larus hemprichi nest on the open sandy plains. The largest reported concentration of Sooty Falcons Falco concolor in the Red Sea nests in the mangroves. Ospreys Pandion haliaetus nest on the shoreline and in the mangroves (Barrat, 1982; Baha El-Din and Saleh, 1983). The study area is inhabited by local pastorals belonging to the Ababda Tribe, who practice their traditional life style in harmony with the environment. (Baha El-Din, 1998). The area has several archeological sites, placed along historic trade routes linking the Red Sea with the Nile Valley. Mining is a wide spread activity, and there are several old gold and emerald mines there.
The availability of an environmental information systems (EIS) as a geodatabase is one of the main guarantees for the generation of a new kind of planning for the natural resources conservation and presentation of biodiversity. The development of an (EIS) is undoubtedly necessary to obtain a plan which agrees with the environmental dimension and with a productive and accurate environmental management.
The contents of an EIS typically include a wide range of data that may be referred spatially in two or three dimensions, and temporally. In practice the uses of environmental information systems range from automated cartography to support of policy formulation and management. They serve to underpin routine operations such as making inventories and monitoring change, and also support policy reviews and the overall long-term planning process.
The basic conditions for the creation of an EIS are as follows: spatial information treatment of the earth and objects; storage facilities and space time and data content; performance of operations among the different masses of data; functions suitable for describing the environment; possibility of simulation of environmental processes. GIS is one of the most powerful tools currently used in resource management for the storage, retrieval, and analysis of environmental data referenced by geographic location. A GIS is a computer based system to capture, store, edit, manage and display geographically referenced information. Geographic data include spatial data and descriptive data. Spatial data concern location, shape and relationship among features, while descriptive data concern the characteristics of these features.
>Most of the cost of implementing EIS is attributed to geodatabase development. To ensure the value of this investment, important decisions concerning the various data and data sources must be made prior to the implementation of the EIS. In implementing in EIS system, those data layers most important in addressing the immediate management needs should be given priority. However, emphasis should also be given to identifying data resources that can easily and rapidly integrated into the system, e.g. any existing relevant digital data. Other important data considerations that deal with the georeferencing, spatial resolution, data accuracy, structure and storage are very important and mainly used to implement quality assurance/quality control (QA/QC) procedures of the data stored in the EIS.
For establishing the geodatabase of the present study, topographic map sheets of scale 1:25,000 of the study area were made available. These maps are produced in 1989 by the Egyptian surveying and mapping authorities. The maps were digitized using Arc/Info GIS software produced by Esri, and the final output was transferred to Arc View 2 software, which is a complementing piece of software to Arc/Info, also produced by Esri, and different map layers were produced (Table 1). The digitized topographic maps were considered as the base map layer for the spatial database. Other map layers (e.g. elevation, land cover, infrastructure) were extracted from the topographic maps and added to the EIS.
Table 1. Geodatabase Extracted from Base Maps, Showing Data Layers and Their Description
| Layer | Class | Attribute | Value | ID | Description | Color |
| Coastal line + infrast. | Lines | Coast line | 5 | 1 | Coast line | White |
| Road type | 14 | 2 | Paved | Red | ||
| 2 | 3 | Unpaved | Red | |||
| Built-up areas | Polygons | Buildings
Land Sea |
50 | 4 | Settlements | Red |
| 1 | 5 | Transp. Back. | White | |||
| 1 | 6 | Transp. Back. | White | |||
| Narrow wadis | Lines | streams | 8 | 4 | Streams | Blue |
| Wide wadis | Polygons | Wadis
Sabkhas Land Sea |
4 | 2 | Wide streams | Blue |
| 20 | 3 | Wetlands | Blue | |||
| 1 | 5 | Transp. back. | White | |||
| 1 | 6 | Transp. Back. | White | |||
| Vegetation points | Points | Vegetation types | 15 | 21 | Bush | Green |
| 95 | 20 | Trees | Green | |||
| 51 | 22 | Grass | Green | |||
| Other defined points | Points | Various | 12 | 4 | Wells | Blue |
| 36 | 5 | Dry wells | Blue | |||
| 17 | 12 | Separate buildings | White | |||
| 44 | 11 | Springs | Blue | |||
| 69 | 6 | Gov. buildings | White | |||
| 73 | 13 | Ruined buildings | White | |||
| 25 | 7 | Schools | White | |||
| 29 | 8 | Mosques | White | |||
| 45 | 10 | Police stations | White | |||
| 5 | 14 | Mines | White | |||
| 57 | 9 | Radio antenna | White | |||
| 9 | 15 | Historical monuments | White | |||
| 17 | 2 | Trigonometric station | White | |||
| 17 | 3 | Horizontal contours | White | |||
| 17 | 1 | Bench marks | White | |||
| Islands | Polygons | Land
Sea Islands |
1 | 4 | Land | White |
| 1 | 5 | Sea | White | |||
| 1 | 1 | Islands | white |
<>This activity was carried out in the following two steps:
Step 1. establishment of a database information system which involved:
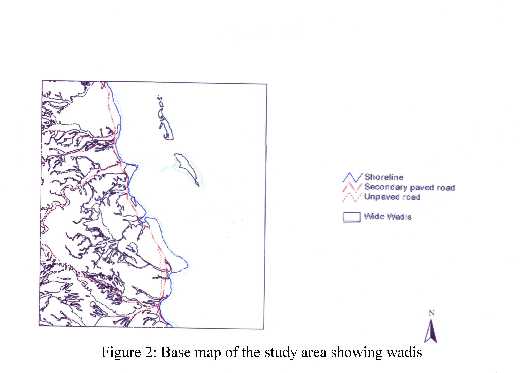
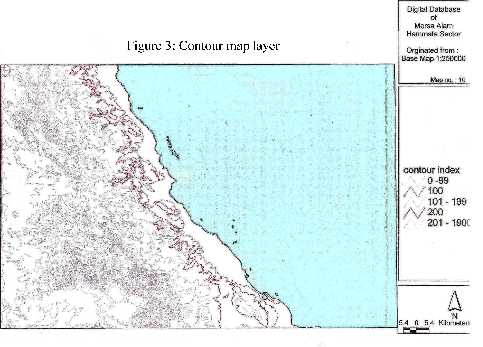
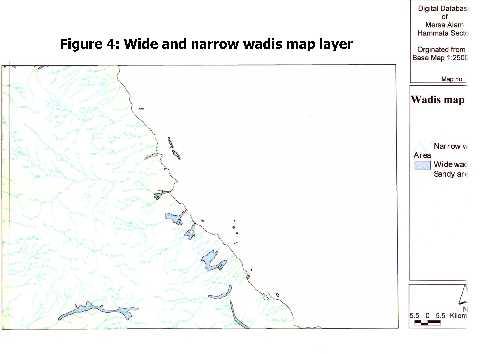
Figures 2,3,4,and 5 show samples of the base map, contours,wide and narrow wadis, and overlay of these layers.
 and 5
and 5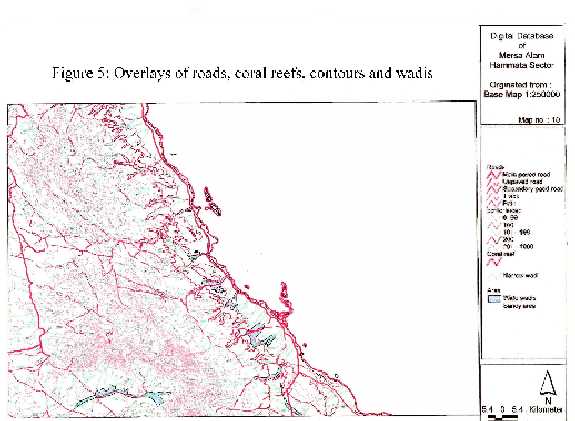
Field observations of the area under study, was a part of the observations for one of the national Egyptian projects for the development of the entire red sea coast and marine environment. These observations involved several disciplines carried out by a team of experts in different specialization. The main concern of the present work is to demonstrate these field observations for Mersa Alam/Hammata sectors ( one of the project�s sector) which is the study are of the present work and how they were incorporated in the geodatabase to provide a synoptic view on the natural resources of the area, and to pinpoint biodiversity hotspots. Based on these geodatabase suitability of the area for development were assessed, delineating areas that could be proposed for protection, and other areas for restricted development activities. The data of field observation were extracted from the scientific report of the Egyptian Red Sea Coastal and Marine Resources Management project (GEF World bank 1997) , and represented spatially on maps by the author. Overlay analysis was conducted to asses the suitability of the area for developmental activities based on field observations of different environmental aspects.
Field surveys were carried out through intensive field visits to the study area, where 15 representative sites where selected for data collection. Surveys of vegetation, terrestrial and marine fauna and observations on bird sites were the main aspects of the field work in the 15 visited sites.
Vegetation data were collected form the 15 representative
sites, where in each site, habitats were defined, and described, vegetation
types were identified and their cover measured. These data were analysed
statistically by applying clustering analysis, that classified the vegetation
data into eight vegetation groups. Each group was named according to the
dominant species in this group. These groups are indicated in Table 2.
Table 3 shows the species richness (biodiversity index) of terrestrial
plants in the main types of habitats identified, species richness is expressed
here as the number of recorded species per habitat. While Table 4 shows
the number of recorded species of different economic uses in the area under
study. From this table, it is evident that more than 63% of the economic
uses or more than 44% of the total number of species are used for medicinal
purposes. The next most important economic use is grazing (GEF/World Bank
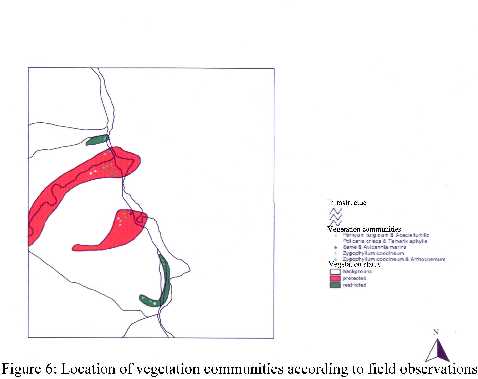
1997). The locations of the vegetation groups are presented in Figure 6(/p>.
In this figure, areas that include almost all the vegetation groups are assumed to represent a hot spots and thus are proposed for complete protection (red color) to conserve the plant species in this hot spot. Other areas that include only few of these vegetation groups are proposed for restricted developmental activities (green color). Other areas that represent the background (white) can support any type of activity.
Table 2 Geodatabase of Field Work Marsa Ala-Hamata sector.
|
|
|
|
|
|
|
|
| Vegetation diversity (terrestrial) | Polygons | Protection status | 11 | 3 | Restricted | Green |
| 12 | 2 | Protected | Red | |||
| 10 | 1 | Back. Land | Transp. | |||
| Ecological analysis of vegetation | Points | Vegetation communities | 31 | Veg. I | Balanites aegyptiaca | G |
| 32 | Veg. II | Salvadora Persica | ||||
| 33 | Veg,.III | Panicum turgidum & Acacia tortilis | R | |||
| 34 | Veg. IV | Policaria crspa & Tamarix aphylla | E | |||
| 35 | Veg. V | Zygophyllum coccineum | E | |||
| 36 | Veg. VI | Zygophyllum coccineum & Arthrocnemum macrostachym | N | |||
| 37 | Veg. VII | Same as previous & Avicennia marina | ||||
| 38 | Veg. VIII | Avicennia marina | ||||
| Marine analysis | Polygons | Protection status | 11 | 3 | Restricted | Green |
| 12 | 2 | Protected | Red | |||
| 13 | 4 | Less important | Blue | |||
| Vegetation value area | 14 | XX | Mangrove | Green | ||
| 15 | VA | Fishing area | White | |||
| Terrestrial distribution of vertebrates | Polygons | Protection status | 11 | 3 | Restricted | Green |
| 12 | 2 | Protected | Red | |||
| 13 | 4 | Less important | Blue | |||
| 10 | 1 | Transparent | White | |||
| Ecological analysis of vertebrates | Polygons | Distribution of vertebrate communities | 51 | B I | Unknown | B |
| 52 | B II | Key habitat | L | |||
| 53 | B III | Ibex range | U | |||
| 54 | B IV | Key nesting sites | E | |||
| 10 | Land | Transp. Back. |
| Habitat |
|
|
|
| Sand flats |
|
|
|
| Sand hummocks |
|
|
|
| Sand dunes |
|
|
|
| Mangroves |
|
|
|
| Wadis |
|
|
|
| Economic uses |
|
||
|
|
|
|
|
| Grazing |
|
|
|
| Fuel |
|
|
|
| Medicinal |
|
|
|
| Food material |
|
|
|
| Traditional industries |
|
|
|
| Others |
|
|
|
Similarly, marine and terrestrial distribution of vertebrates were extracted from the scientific report by GEF World Bank, 1997, and incorporated by the author in a geodatabase to provide an overview of the biodiversity of the area under study and to assess sensitivity analysis to human interventions.
Based on this sensitivity analysis, the study area was classified to high sensitive areas that represent hot spots of biodiversity, and thus proposed for complete protection. Medium sensitivity areas, were also identified that is restricted to controlled activities and could be sustainably developed. Other areas represent low sensitivity areas (background) that can support more intensified activities (Table 2).
The data presented in Table 5 shows the species richness of marine faunal groups in the main habitats, and their taxonomic diversity is presented in Table 6. In general, the coral reef habitat exhibited the highest species richness in the surveyed sites. Bird taxonomic diversity is presented in Table 7 in different habitats identified. This table shows that thirty five species were recorded in different habitats of Mersa Alam-Hammata sector. Mangrove habitat was by fat the richest in bird species as compared to other habitats.
Human settlements habitats was the poorest one in bird
species richness. The data in the above tables were presented spatially
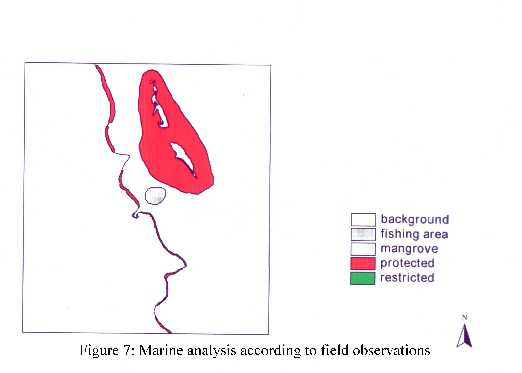
in Figure 7 that shows from the marine point of view, the areas that are
proposed for complete protection (red color) as they contain the coral
reefs and their shelves on the sea shore, and island boundary. Other areas
that are proposed for restricted activities are shown in green.
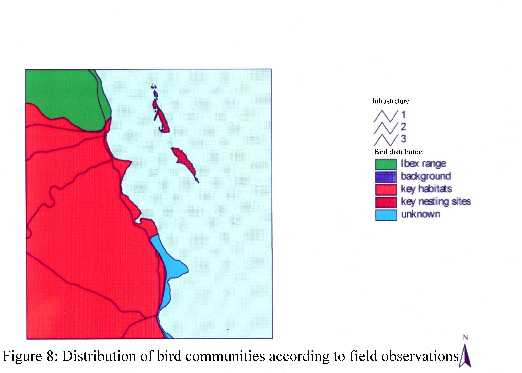
Figure 8 shows the distribution of bird� s communities according to field observation. The areas in red are proposed from complete protection, in green for restricted activities. Other areas are less important and can support development activities.
The above maps presented in Figures 6 for vegetation,Figure 7 for marine fauna and Figure 8 for birds where overlaid spatially to produce the suitability map presented in Figure 9 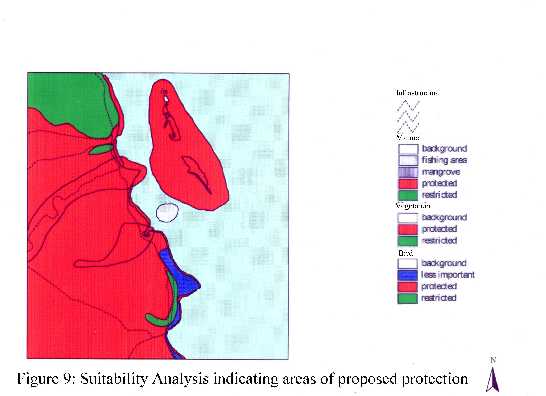
All the areas in red are considered as biodiversity hotspots, and thus proposed from conservation actions that could be supported by law and included in the biodiversity plan of action for the implementation of the biodiversity convention.
Table 5. Species richness of marine faunal groups in the main habitats
| Group |
|
||||
|
|
|
|
|
|
|
| Corals |
|
|
|
|
|
| Crustacea |
|
|
|
|
|
| Mollusca |
|
|
|
|
|
| Echinoderms |
|
|
|
|
|
| Fishes |
|
|
|
|
|
| Total |
|
|
|
|
|
Table 6. Taxonomic diversity of marine faunal groups
| Group |
|
|
|
|
|
| Corals |
|
|
|
|
|
| Crustacea |
|
|
|
|
|
| Mollusca |
|
|
|
|
|
| Echinoderms |
|
|
|
|
|
| Fish |
|
|
|
|
|
Table 7. Taxonomic Diversity of bird species
| Species |
|
|||||||
|
|
|
|
|
|
|
|
|
|
| Total number of species |
|
|
|
|
|
|
|
|
| Total number of genera |
|
|
|
|
|
|
|
|
| Total number of families |
|
|
|
|
|
|
|
|
| Species/genera |
|
|
|
|
|
|
|
|
| Species/families |
|
|
|
|
|
|
|
|
(Os = Open Sea; Ma = Mangrove; Sb = Sandy Beach; Mf =
Mud flat; wa = Wadis; Mo = Mountains; Hs = Human settlements).
There is no direct answer to the environmental problems we currently face. People need to live, eat and to improve their quality of lives, and this is consequently affecting our valuable non renewable and renewable resources. Too often, lack of information and discontinuity in spatial data leads to practices that use resources that can�t be sustained for future generations. There is an increasing demand on applications that use information technology to natural resource management and fill in gaps in our knowledge about environment, particularly, from the biodiversity point of view. Geodatabases are increasingly used to establish Environmental Information Systems (EIS). The EIS produced represent a powerful tool for decision-making processes and consequently sound environmental management specially for coastal regions. These regions are characterized with their favored climates and access to sea, have historically supported higher levels of human activities than more inland regions. In the study an attempt was made to establish an EIS for one of the important sectors of the red sea from the biodiversity point of view. This region exhibit relatively rich biodiversity, and is an important bird area. Unless this region is managed sustainably, irreversible environmental effects might happen that leads to loss of biodiversity.
The geodatabases produced in this study both from the base maps and from field surveys, were used to demonstrate the richness of the area in terms of flora and fauna. Tables 3, 4 for vegetation composition and their uses, and tables 5 and 6 for richness of marine fauna, and table 7 for bird species, all indicates the richness of flora/fauna in every habitat identified.
Taking into account the advantages gained by using GIS as a base for establishing an EIS, where spatial data and attribute data are linked together and easily overlaid, the EIS was used as a vehicle containing base maps, attribute of field observation and spatial representations. The overlay analysis that was applied allowed integrating all the data together which provided an overview of the area characteristic with regard to the physical and biological aspects. Accordingly biodiversity hotspots were located and delineated spatially. These spots are proposed for conservation actions to take place and suitabilities of other areas to support human activities. More detailed investigations of these areas of biodiversity spots are needed to plan an appropriate zonation scheme of different levels of protection.
In conclusion it has a high conservation efforts because of the large integrated ecosystem complex of Wadi El-Gemal, the mangroves and the adjacent El Gemal island, offering an unspoiled, highly diverse but closely associated group of habitats. This area is important for water and flood control, terrestrial biodiversity in the wadi area, fishery nursery values and bird habitats in the mangroves as well as the abundance of coral and marine communities associated with the island. There is also considerable potential for ecotourism development and establishment of bird watching areas.
|
|
|
|
|
|
|
|
|
|
|
|
|
|
|
|
|
|
|
|
|
|
|
|
|
|
|
|
|
|
|
|
|
|