Figure # 1: 3D Information Management Schema

GIS Visión País
(VIPA):
An Information System for
decision making in Exploration
Esri User Conference, San Diego, July
2001
Classification according to processing degreePRODUCTSRaw DataQualityA. SourceProcessed data
B. LayersA. SourceInterpreted data
B. LayersA. Source
B. Layers
Technical Specifications
Metadata
Thematic MapsFINAL CONSIDERATIONS
Quality data maps
Spatial analysis products
Annex # 1: WELL SELECTION PROCESS
Annex # 2: DATA VALIDATION MATRIX EXAMPLES
Annex # 3: EXAMPLES OF GIS VIPA LAYERS
Annex: # 4: EXAMPLE OF A SPATIAL ANALYSIS PRODUCT
REFERENCES
GIS VIPA: An Information
System for decision making in Exploration
Taylhardat, Violeta; Hernández,
Gustavo
Visión País,
PDVSA Exploration, June 2001
Esri User Conference, San
Diego, July 2001
Abstract
An information management tool
for Hydrocarbon Exploration Planning has been considered a fundamental
element in Petroleos de Venezuela S.A.
VIsión PAís,
a technical group of PDVSA Exploration, is responsible for the identification
and characterization of new hydrocarbon opportunities nationwide.
Validation of data in terms
of disciplines and reliability is necessary before loading the information.
The entire process is carried
out centered upon a GIS containing geological, geophysical, geochemical,
petrophysical, production and environmental data. It is capable of rendering
a three dimensional view of exploration targets, oriented towards the support
of risk and economic evaluation for recognized opportunities, linked to
installed interpretation facilities. The main objective is to establish
exploration strategies and profit from the synergy with neighboring countries.
Products, including Spatial
Analysis for specific needs, are based on the fact that the area covers
more than 1 million square kilometers, meaning that the scale of all maps
must have a range from 1: 500.000 to 1: 2.000.000.
Introduction
An effective information management
during the Exploration Planning Cycle is considered a fundamental element
for the success in the subsequent stages of oil discovering and exploitation
processes.
During the last 8 decades,
the Venezuelan oil industry has always been characterized for the acquisition
and maintenance of large volumes of information amongst its assets. However,
its dispersion and the lack of specialized tools for the analysis have
made difficult, in some cases, the conception of the Exploration Plan in
the long and short term.
Also, the technical data obtained
during the information acquisition stage, once it has been safeguarded,
processed and analyzed under a global perspective, might help in obtaining
additional information in order to improve plans and strategies for the
oil exploration and exploitation.
Visión País (VIPA),
one of the main functions of the Exploration Unit of Petroleos de Venezuela
s.a. (PDVSA), is carrying out the gathering, validation and processing
of selected geological, geophysical, economical, environmental and production
information of the Corporation. The goal is to integrate it in a System
that allows its visualization and analysis to obtain, as the result of
spatial analyses, the identification of those areas qualified as "best
exploration opportunities", under a technical and business perspective.
Additionally, VIPA must engage in the preparation of the documental base
required to facilitate the prioritization of
the potentially prospective areas, during the exploration planning stage.
The VIPA Geographic Information
System has been conceived with the vision of supporting the Exploration
Process in its whole extension, to canalize the efforts and aims towards
an opportune delivery of information and a proper alignment during the
Preparation of the Plans and Strategies of the Corporation Exploration
Business Unit.
Background
There have been some intents
of GIS implementation in PDVSA. Until
now, we have achieved good results handling cartographic, environmental
and cultural information, but not as far as geosciences data is concerned,
i.e., geology, geophysics, petrophysics, geochemistry, sedimentology and
bioestratigraphy.
The goal to integrate geoscientific
information, jointly geo-referenced with cartographic information and satellite
images in the same system as well as permitting its global visualization
for countrywide analysis has been a challenge in PDVSA during the last
ten years. This has been an arduous task despite of disposing of sophisticated
technology.
It has not been sufficient,
because GIS technology development has been partially divorced from Geosciences
tools development. One of the main handicaps has been the 3D information
management, taking into account that rocks, geologic time, crude characterization,
etc., exist for the same Cartesian point but may vary with depth.
Another important feature is
that, even for the same Cartesian point, some characteristics can vary
in time, for example the oil production, and this has to be considered
and included in the Database for the posterior analysis.
Methodology
In the following lines, the
procedure to incorporate the geoscientific information into the system
is described in a general way.
The GIS implementation began
structuring the data, information and processes of each discipline. The
data validation and processing tasks that every specialist carry out was
studied in detail, beginning with the data gathering until the final delivery,
according to technical and administrative specifications from users or
Corporate Data Base Managers. The established processes define the data
that must be gathered and provided. It is very important to define how
they have to be loaded in the layers: alone or jointly with other data
in the same layer. The level of complexity of the information must be the
lowest possible.
This applies for every category
of data, even if it is raw or provided by interpreters. In this case, a
layer is created for every type of data, which constitutes basic information
for the spatial analysis.
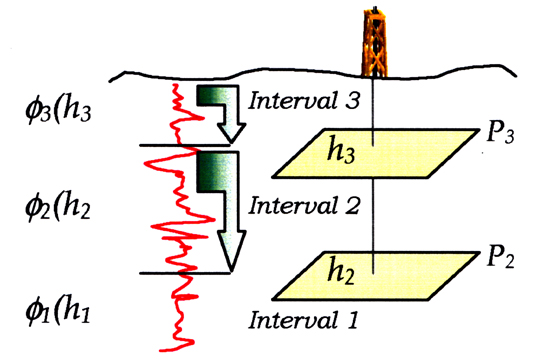
It must be noted that with
the GIS standard software used in the Corporation, 3D-information management
has a significant degree of difficulty. Nevertheless, this is compensated
by the analysis capability that can be achieved. Those geo-related attributes
generated by specialized applications can be referred to planes at different
depth values. In Figure # 1, the average porosity f2
of
Interval 2 is referred to plane P2 associated to depth h2.
Figure # 1: 3D Information Management Schema
Data
Data, in terms of the Cartography
French Committee is: "fact, phenomenon or notion that can be represented
in a conventional way appropriated to the communication, interpretation
or processing.5" From this point
of view, "data is transformed to information while it is pertinent for
the user".
Data or information required
for the oil exploration comes from different disciplines and for every
one of them, there generally exist, many types, formats, mediums and quality
levels. Often, this data in its original version can not be used by specialists
in the formats and media in which it is originally acquired. For that reason,
it must be previously processed to be suitable or appropriate.
|
|
|
|
|
|
|
| Well (id) | Raw | Text | Well id, in which the sampled was taken | ||
| Well spatial location (N,E; ?, ?) | Raw | Point | Coordinates of the well | ||
| Log type | Raw | Text | Log name according to the standard nomenclature | ||
| Top | Raw | Point | Top depth in feet | ||
| Base | Raw | Point | Base depth in feet | ||
| Curves | Raw | Line | |||
| Well logs | Processed | Point, Line | |||
| Petrophysics | Deviation Log | Raw | Point, Line | Record of the well drilling trajectory | |
| Technical Report Reference | Raw | Text | Reference of the technical report in which the samples were analyzed | ||
| Reservoir Average Oil Saturation | Interpreted | Polygon | Oil Saturation average calculated for reservoir (So). Units: % | ||
| Reservoir Average Resistivity | Interpreted | Polygon | Average resistivity for specific reservoir. Units: ohms-m | ||
| Reservoir Average Porosity | Interpreted | Polygon | Average porosity calculated or measured in cores and logs for reservoir, Units: % | ||
| Reservoir Average Permeability | Interpreted | Polygon | Average permeability, calculated or measured in cores. Units: darcys or milidarcys | ||
| Reservoir Thickness | Interpreted | Polygon | Net
oil sand thickness or net oil limestone thickness resulted by petrophysical
evaluation.
Units: feet or meters |
Table # 1: Examples of petrophysics data, classified according to processing degree
Raw DataA. Source
The largest part of data contained in the VIPA GIS, comes from the Corporate Database. The original data pass through a data quality validation process, and loaded afterwards in the VIPA’s Database. Each specialist validates its own discipline data by a validation matrix according to previously established parameters for each discipline. Once this is accomplished, the data is transferred to the GIS environment.
B. Layers
Only the previously validated and geo-referenced data is the one to be loaded in the GIS as a layer. The separation of the information in layers permits a better visualization and analysis of all the information to obtain maps and other required products for the exploration studies.
Annex # 3: EXAMPLES OF GIS VIPA LAYERS, shows some of the layers created for the VIPA’s Geographic Information System, as well as a brief description of the contents. It must be noticed that each layer has in the System its own metadata (see Metadata). This table must be used only as reference and it must not be taken as a definitive chart representing all the information of the GIS.
The raw data of the VIPA GIS can be augmented (adding new data) while geological and geophysical interpretations along the country are being performed. But we try not to modify the original data in order to preserve it as the basis of the original interpretation and monitor changes through time.
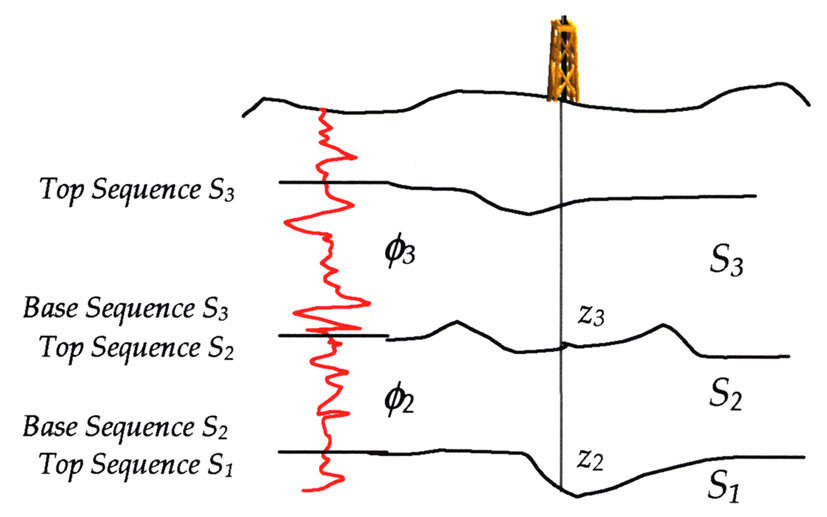
Figure # 2: Sequence information representation for products
Final considerations
This work has lead us to perceive
relevant aspects for implementing a GIS in order to plan a phase very important
for hydrocarbon exploration as the analysis of data and information for
decision-making in hydrocarbon exploration processes.
Obviously, to create a GIS
is always an arduous task. Especially if it deals with a wide variety of
data, coming from different disciplines, indulging a diversity of clients,
following specific organizational norms, procedures and products that must
guarantee additional expectations in terms of exploration opportunities.
A useful recommendation that
can be withdrawn from this work is to establish a technique to allow an
appropriate separation of system elements. This can help to define many
of the features of the system as for example which data we can manage,
the process of upgrading, etc.
Likewise, establishing clear
and logical processes from the beginning eases the task of "clarifying
the natural path" for each data and any alteration or modification that
may occur during manipulation. This gives double reward, because it is
not only a question of establishing a process for people to illustrate
how a system works. We also will be able to detect any alteration or detour
during the process that might affect the system and, evidently, the final
results.
Another very important feature
that we can stand out from this GIS is the data validation technique. Before
loading into the DBMS, any data must be previously validated for specialists
who, definitely, takes the final decision about this issue giving the eventual
interpreter or user of the information, the needed confidence for carrying
out his or her job. At this point, one of the main considerations is to
establish the loading process and its responsible team. This is because,
even though we mentioned that, the data validation must be done by the
geo-related specialist, but the process of loading and its regular actualization
must be done by the group in charge of administrate the GIS data and this
task can never be delegated.
We are sure that many of these
premises will be improved through time. However, this is something that
was considered during the launch that it is sometimes better to take risks
than not try it at all.
Our final propose of having
an effective information management system that will be used for the Exploration
Planning Cycle will be reached in not to much time, adding great value
to the Corporation.
Acknowledgments:
The realization of this paper
has been possible due to the initiative of Corporation for motivating and
permitting the documentation and publication the daily work, especially
that referred to new technologies applications.
The excellent interdisciplinary
teamwork of Visión País (VIPA) has been the fundamental key
to accomplish this work, not only because of the provided knowledge for
the realization of it, but the interest and advises given during the design
and specifications establishment. All the team feels the challenge that
this project means for the whole Corporation.Finally, the interaction among
the members of the GIS group has given the final touch, especially with
concerns to integration of cartography base and geosciences attributes,
which is one of the strategic issues of this project.
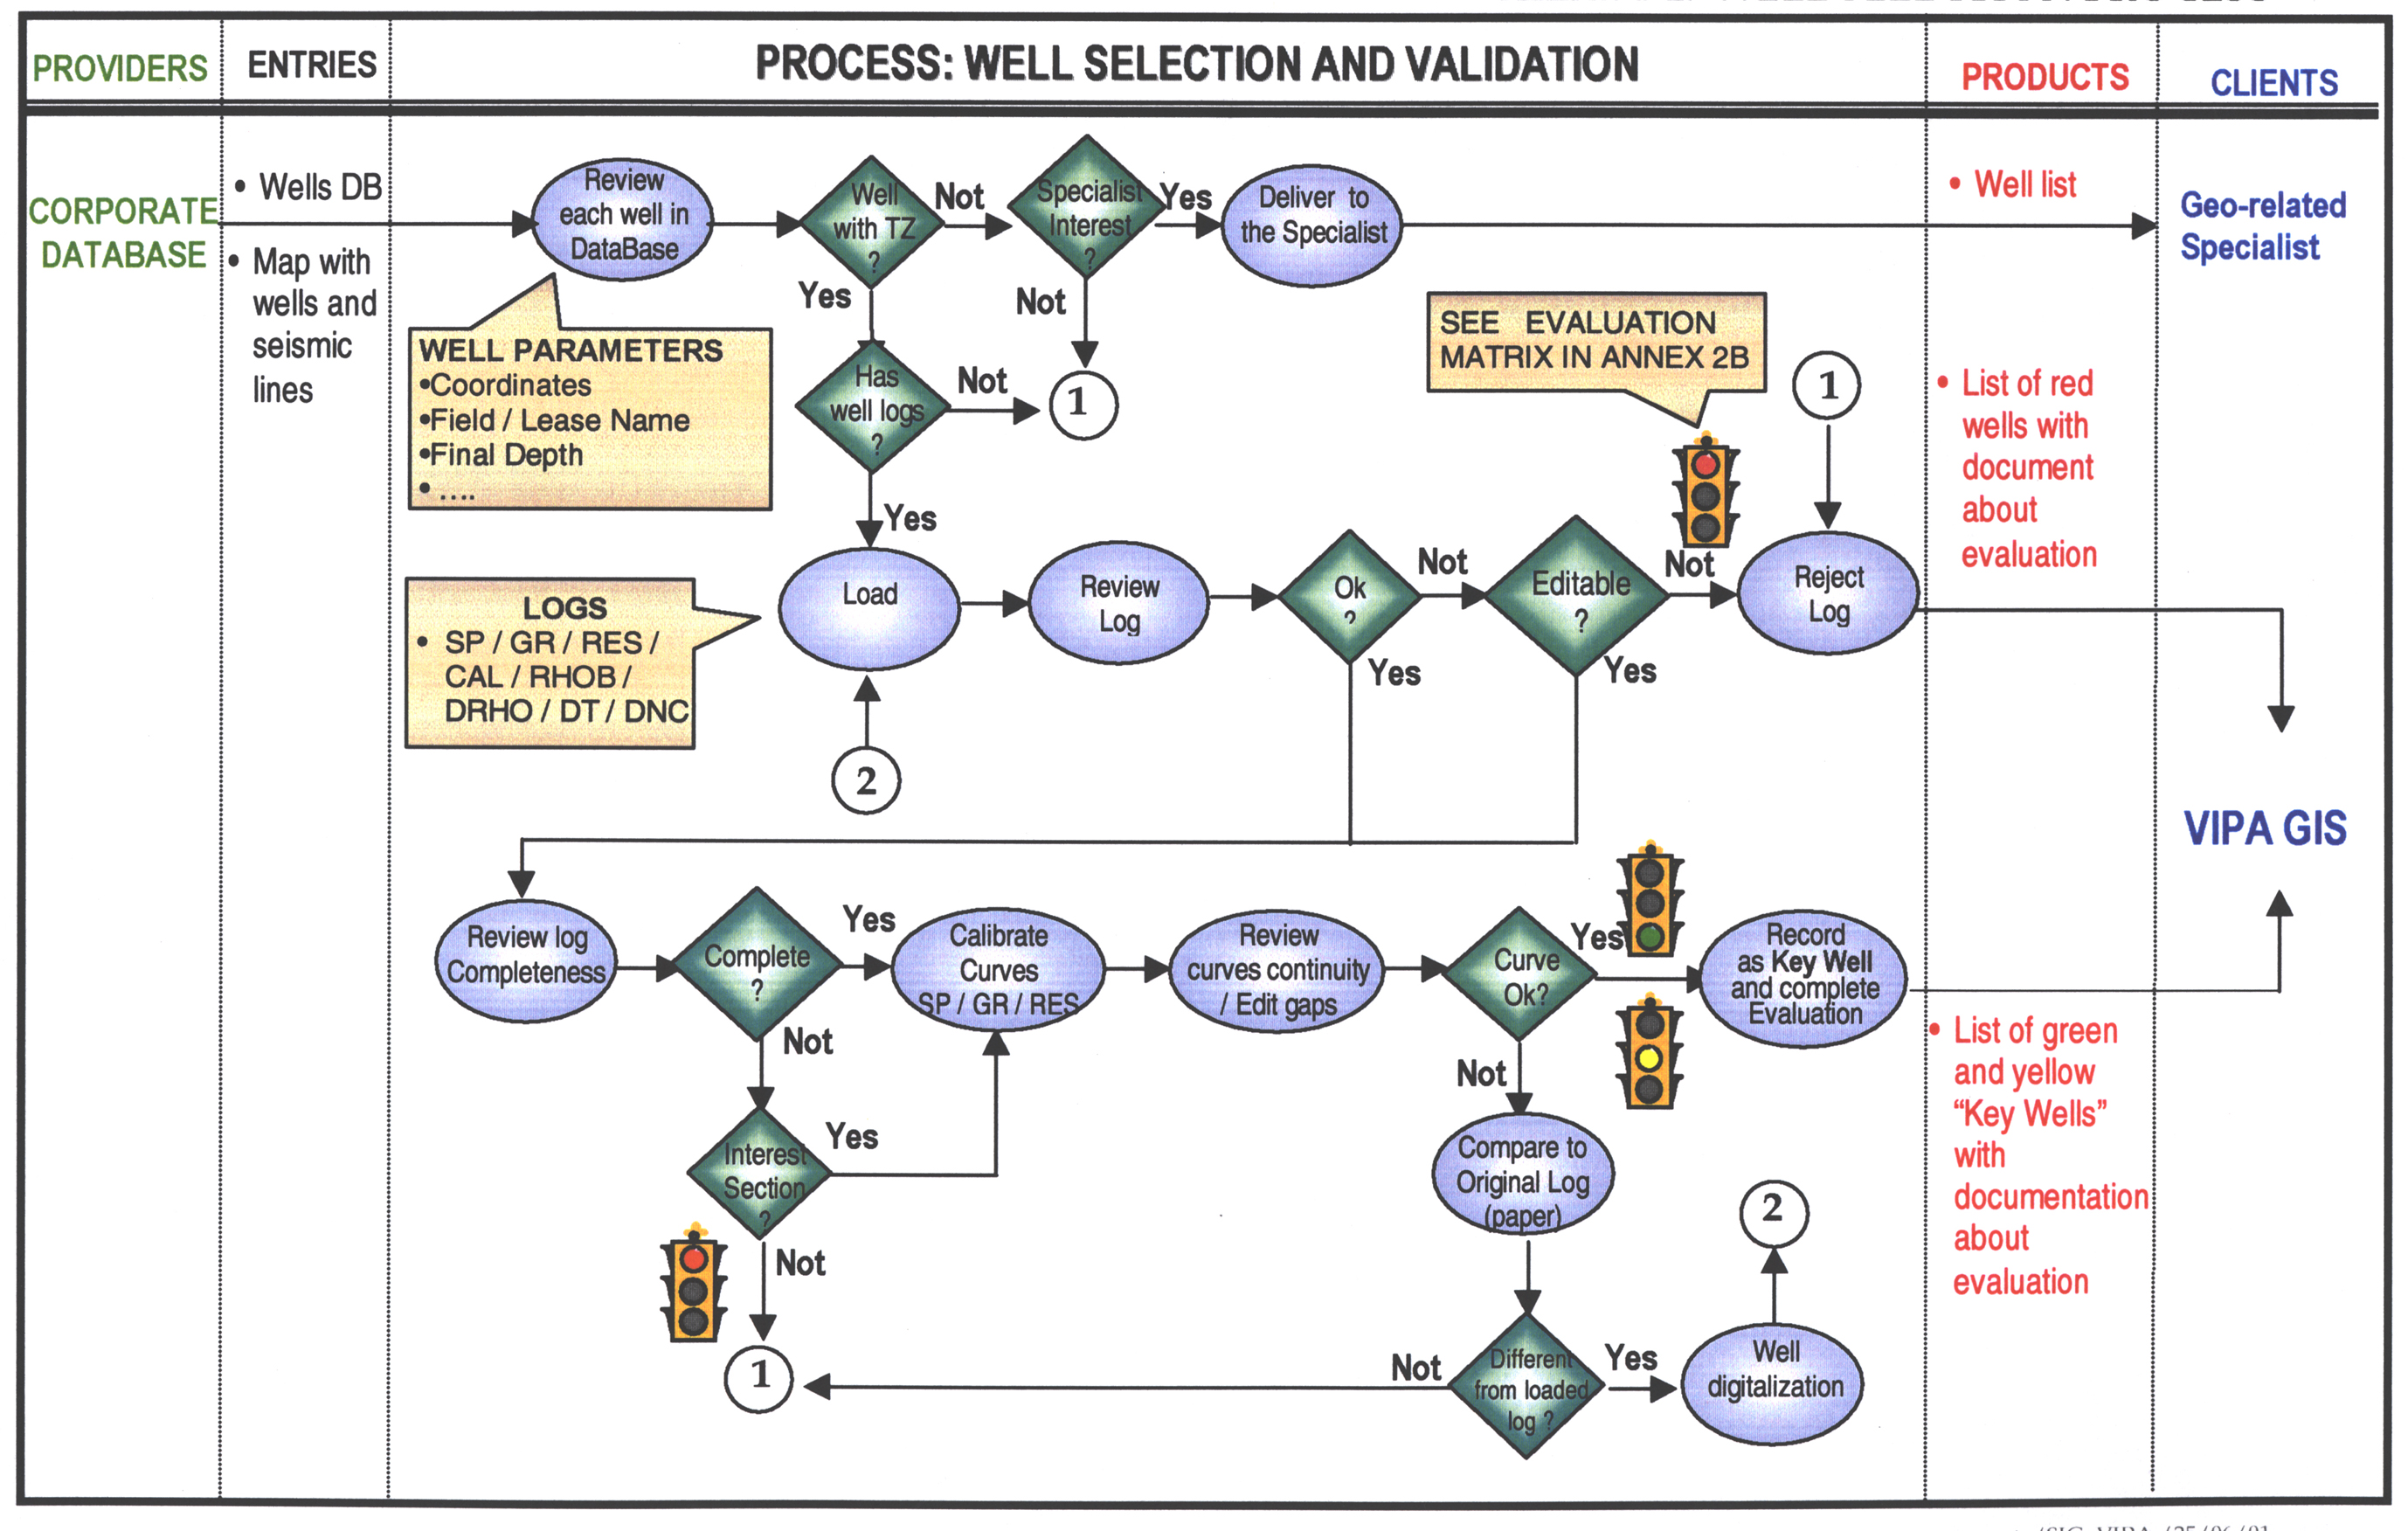
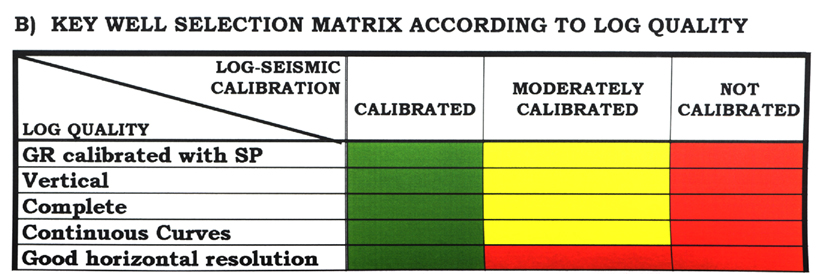
Annex # 1: WELL SELECTION
AND VALIDATION PROCESS
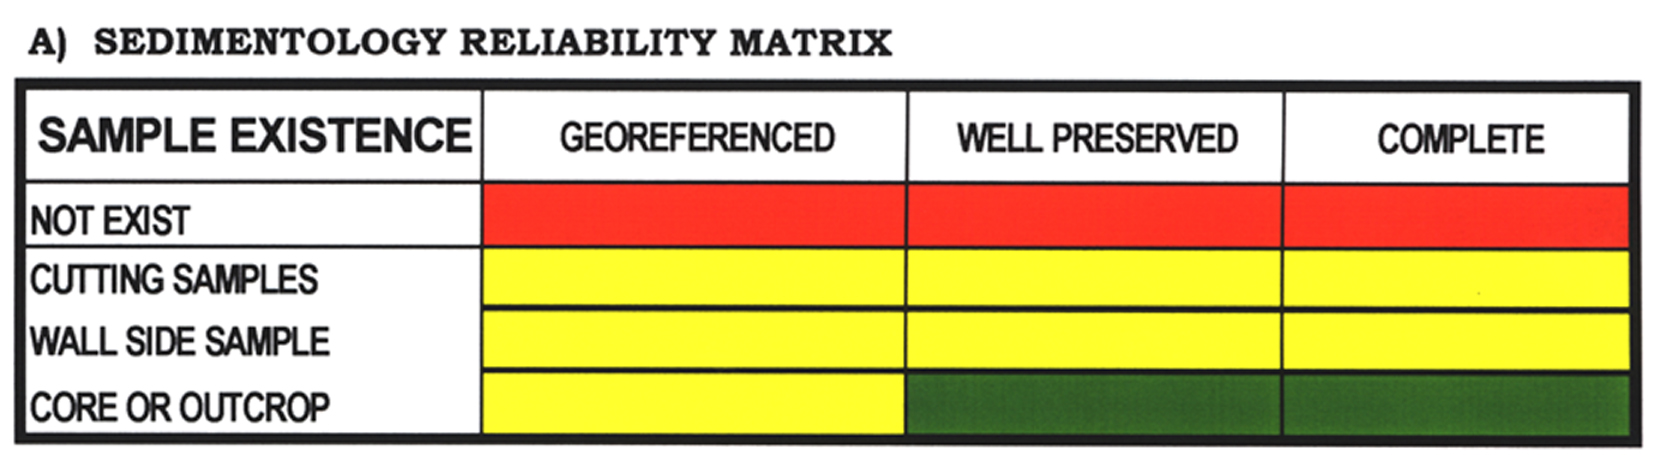
Annex # 2: DATA VALIDATION MATRIX EXAMPLES
Annex # 3: EXAMPLES
OF GIS VIPA LAYERS
|
|
|
|
|
| 1 to 5 | Wells | VIPA
Key Wells (with TD)
Well with sequence tops Wells with core information Wells with geochemistry data Wells with bioestratigraphy data |
VIPA
Integration
VIPA Visualization |
| 6 to 8 | Geochemistry | COT
values (grid)
Madurity Values (grid) Pollution values (grid) |
VIPA
Integration
VIPA Visualization |
| 9 to 12 | Geology | Sequence
Tops
Sequence Bases Sedimentary Environments Faults |
VIPA
Integration
VIPA Visualization |
| 13 to 15 | Geophysics | 2D
Survey Lines
3D Survey Polygons Transects |
VIPA
Integration
VIPA Visualization |
| 16 to 18 | Production | Leases
Wells with "x" production Wells with API Crude "X" |
PDVSA Production Department |
| 19 to 26 | Cartography | Country
boundaries
State boundaries County boundaries Main rivers Main roads Topography Bathymetry City names |
Environment Minister |
| 27 to 28 | Remote Sensing | Radar
Images
Landsat Images |
Exploration Technical Services |
| 29 to 43 | Areas under special regimes | ABBP, ZPL, ZAA, RF, MN, ZPCH, ACPT, RCPE, RFS, RB, RH, ZPL, PN, ARDI, RESFS | Environment Minister |
Annex # 4: EXAMPLE
OF A SPATIAL ANALYSIS
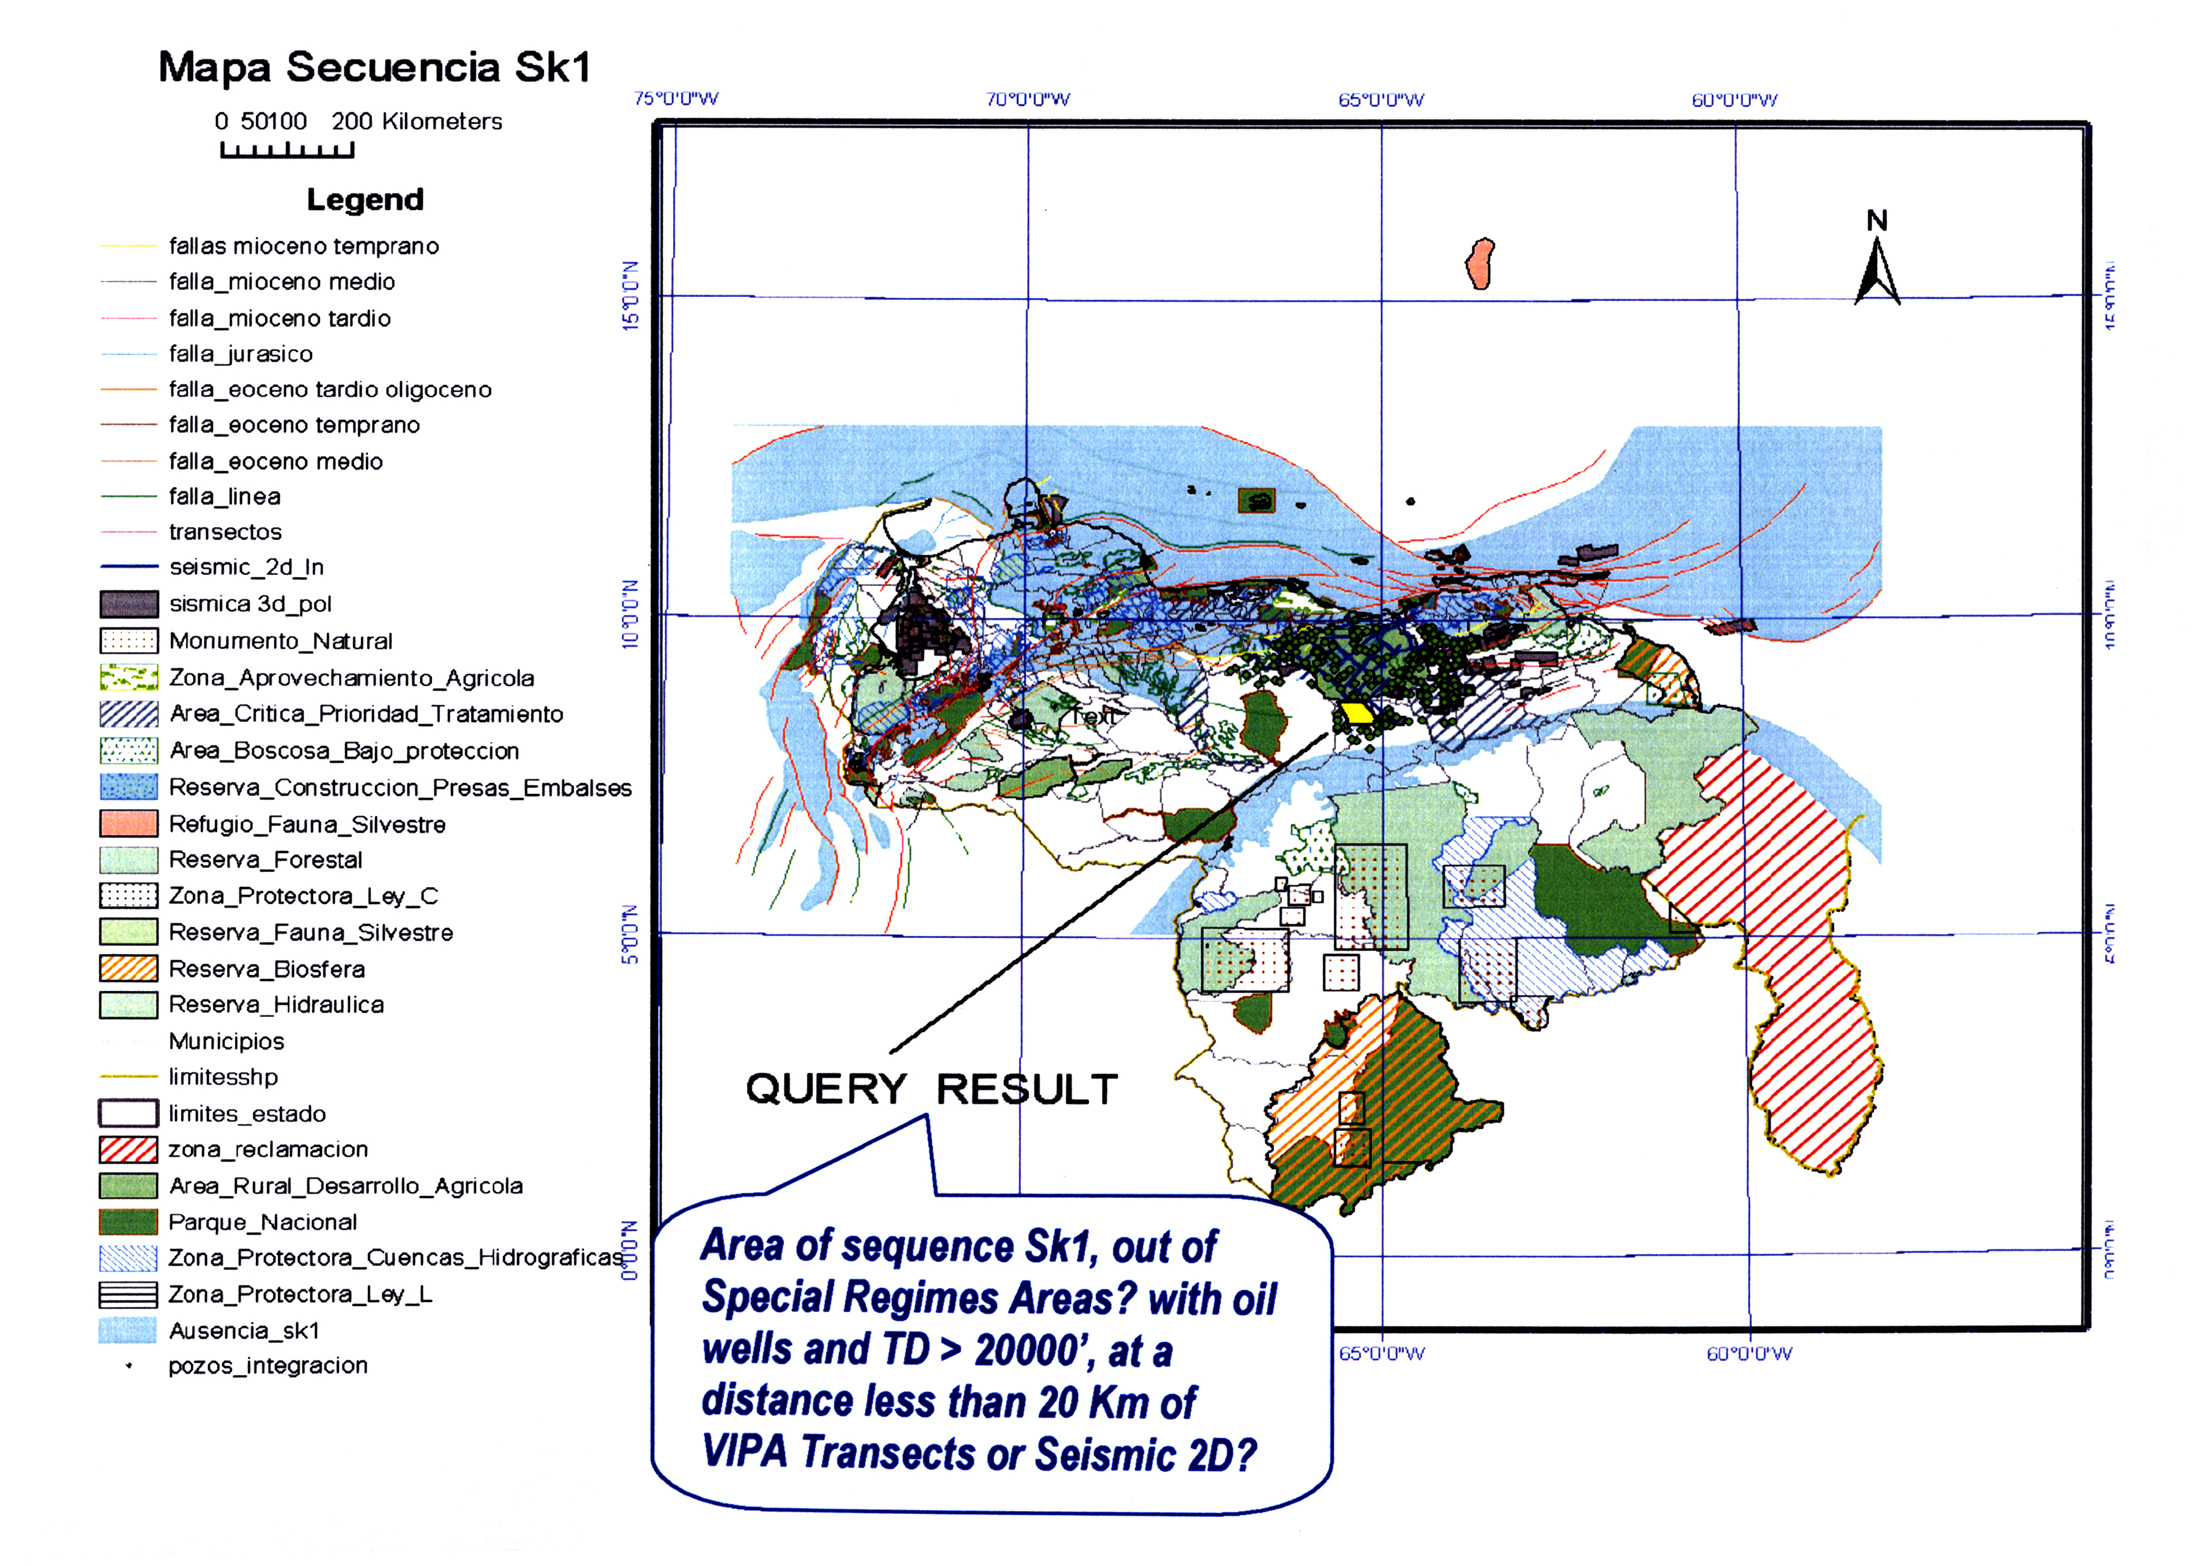
References
1. Chevallier, Jean Jacques;
Systèmes d’information à référence spatial.
Notes de cours; 1994.
2. Detreköi, Äkos;
Data Quality in GIS Environment; Budapest.
3. Lilliu, Antonello et al;
GIS Enabled Data Quality in Large Areas. AAPG, June 2001.
4. Mitchell, Andy; The Esri
Guide to GIS Analysis, Volume 1; 1999.
5. Pornon, Henri; Les SIG,
Mise en śuvre et applications.
Author Information:
| Name: | Violeta Taylhardat |
| Title: | Geodesic
Engineer, Zulia University, Venezuela
Geodesic Sciences GIS MSc, Laval University, Canada. |
| Company: | Petroleos
de Venezuela (PDVSA) s, a.
Exploration Unit; Visión País (VIPA) Department. |
| Address: | Edif.
PDVSA E, P & M; Av. La Estancia, Urbanización Chuao. Z. P. 1061
Apdo. 829, Caracas, Venezuela |
| Telephone: | 58 - 11 - 0212 – 9084368 |
| Fax: | 58 - 11 - 0212 – 9082053 |
| e-mail address: | taylhardatv@pdvsa.com
vtaylhardat@cantv.net |
BACK TO CONTENTS