By
Jay McCurley
Texas Department of Transportation
And
Jianling Li, Ph.D.
School of Urban and Public Affairs
The University of Texas at Arlington
For
The Twenty-First Annual Esri International User Conference
San Diego, CA
July 2001
This paper describes the use of GIS to develop a tool to manage storm water systems for the Texas Department of Transportation in Dallas and Collin counties. TxDOT is required to implement programs that monitor the quality of storm waters discharged into the U.S. water system. A large amount of data has been generated from these programs. There is an urgent need to develop a system for managing and analyzing these data. This project demonstrates that GIS is a solution for such needs. It allows storm water managers to visualize the spatial patterns and analyze the trends. The project provides lessons for similar implementations elsewhere.
Under the National Pollution Discharge Elimination System (NPDES) of the Clean Water Act, operators of large Municipal Separate Storm Sewer Systems (MS4) are required to obtain a permit to discharge storm water from the system into Waters of the U.S. The Dallas District of Texas Department of Transportation (TxDOT) is required to obtain permits covering the portion of its system in the cities of Garland, Dallas, Irving, Plano, and Mesquite. While numeric limits are not placed on the discharges, the operator is required to implement various programs referred to as Best Management Practices (BMP). These best management practices include Dry Weather Field Screening, Wet Weather Field Screening, Wet Weather Monitoring, Floatables Monitoring, and Public Education.
In complying with the NPDES MS4 permit requirements, the Dallas District of TxDOT is implementing the Dry Weather Field Screening and Wet Weather Monitoring programs. For these programs, the locations of the outfalls and monitoring stations are identified and the physical description information (including photos and sketches) of the sites is collected. In addition, waters flowing out from the outfalls are sampled and examined. Such inspections are repeated periodically. So far the District has identified approximately 800 outfalls or discharge points in the permit area. As a result, a large amount of data is generated from these programs. Hence, it is necessary to develop a system for the management and analysis of these data. The objective of this project was to develop a system to manage this data and easily access, view and analysis the information, using data from the Dry Weather Field Screening and Wet Weather Monitoring programs.
In the following sections, we will first discuss the programs that were included in this project. Next, we describe the data sources and data collection process. The following section outlines the application of GIS in developing the Storm Water Data Management System, and the final section summarizes lessons learned from this project and implications.
The Dry Weather Field Screening program is to detect illicit discharges and dumping. Under this program, the outfalls are checked during dry periods to see if there is any water discharging from them. Since the drainage system is designed to convey storm water, any flow during dry weather is suspected to be an illicit discharge. In 1995-1996, the outfalls were located using a Global positioning System receiver and checked to see if there was any water discharging from them. If a discharge was detected, a sample was collected and analyzed in the field for indications that pollutants were in the water. The results of the screening were recorded on field data sheets including a photo of the outfall, GPS coordinates, presence of a flow, and the results of any sampling done. In most cases no flow was detected. A few outfalls were discharging groundwater from underground springs and in a very few cases, illicit discharges were detected. When illicit discharges were found, the information was referred to the local city enforcement personnel to correct.
This Dry Weather Field Screening program is a continuing process. The permit requires that all outfalls be re-screened over the five years of the permit. To accomplish this requirement, the Department re-screens approximately 20% of the outfalls every year. Re-screening was first done in 1998, again in 1999 and 2000.
In addition to the Dry Weather Screening, the Department also operates two Wet Weather Sampling Stations. These sites collect samples from storm events. The samples are then sent to a laboratory for analysis. Currently these sites collect two samples per year provided there is adequate rainfall in a particular season.
Other requirements of the permit are public education, floatable monitoring and wet weather field screening. These areas may be added to the Management System as it evolves.
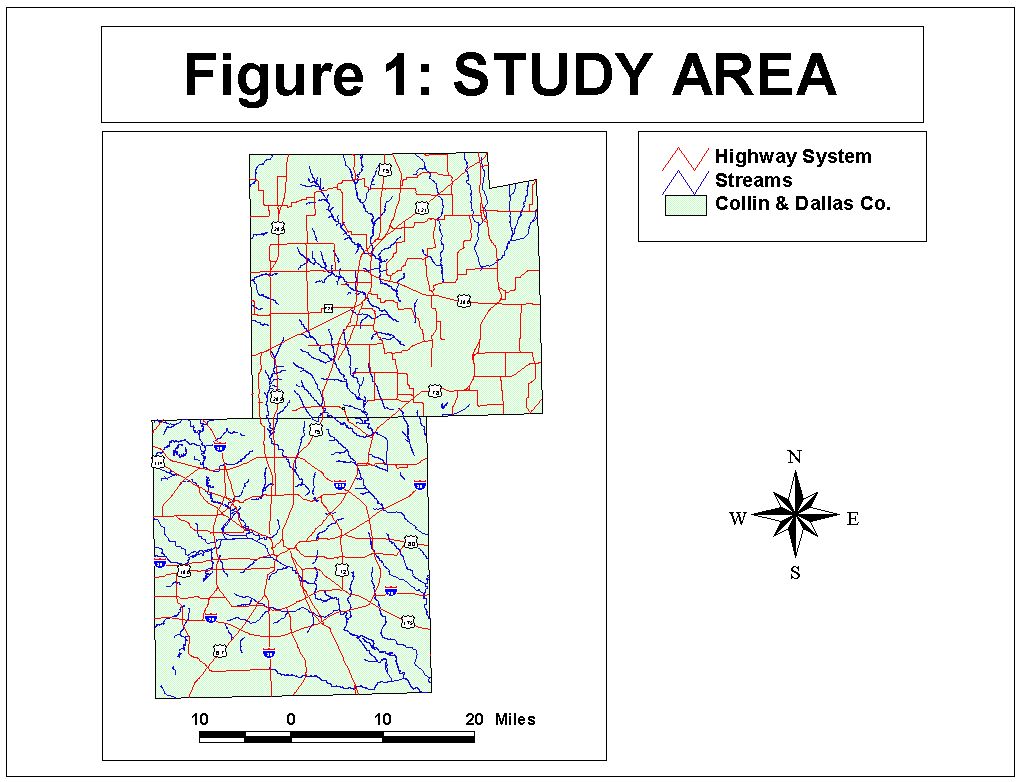
Several digital maps are needed for this project. These spatial data include a county boundary map consisted seven counties within the Dallas District: Navarro, Ellis, Collin, Denton, Dallas, Kaufman and Rockwall; a stream map; a roadway map; a watershed map; and maps showing the locations of outfalls and wet weather sampling stations. In addition to spatial geographic data, all information obtained from the operation of the Dry Weather Screening and Wet Weather Monitoring programs was also collected and linked to the maps. The data sources and collection process are described below.
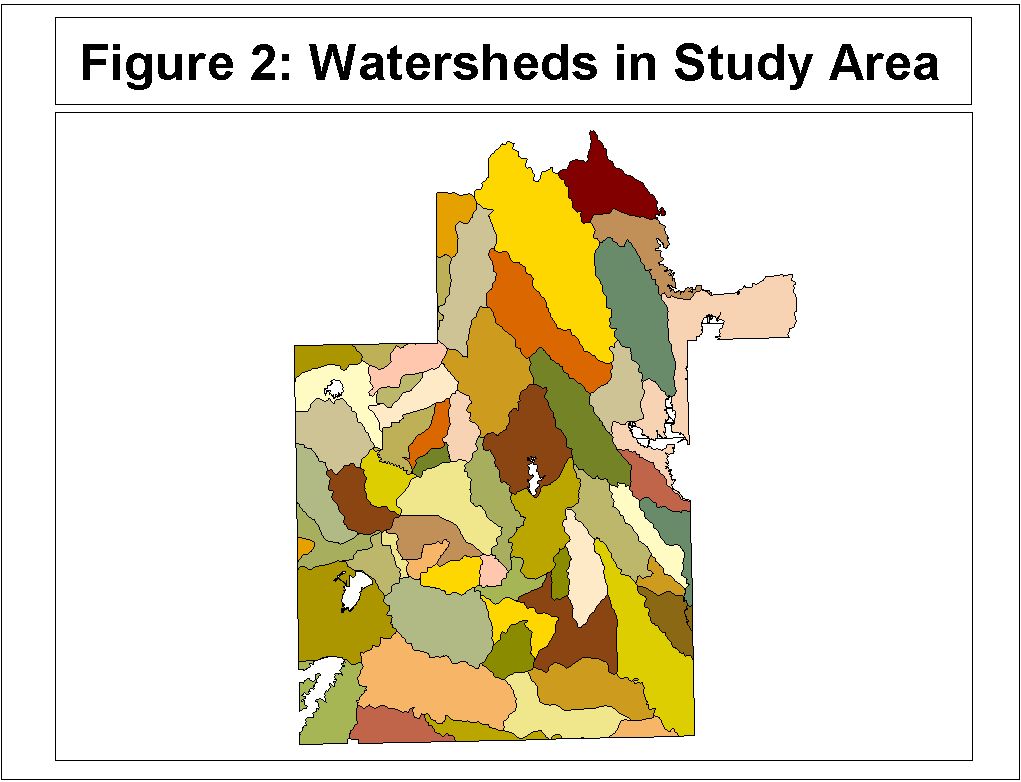
Each creek or stream has an area that it drains. This is called a watershed. The watershed that drains the roadway is important because segments of several roadways may drain to one watershed. In the future, the pollutant loads from the roadway impacting a particular watershed may be of interest.
The North Central Texas Council of Governments (NCTCOG) maintains GIS files on its website. The files for the watersheds were downloaded from the site as an .E00 file and imported using Import 71. The shape files were then projected from the NAD 83 to the TSMS projection. Since only the Counties of Dallas and Collin were required the Watershed theme was clipped to display a watershed theme that covered the area of interest. The Watershed theme is shown in Figure 2.
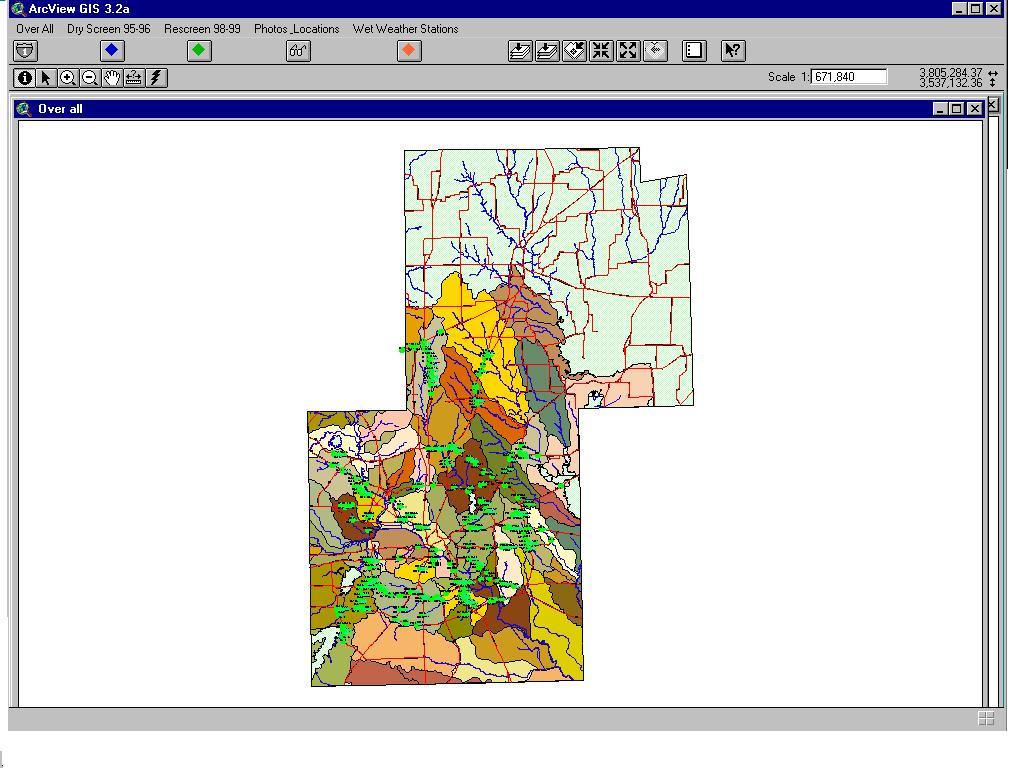
During the original Dry Weather Field Screening, the location of each outfall was recorded using an inexpensive Global Positioning Satellite Receiver (GPS). The positions were recorded as Degrees, Minutes and Seconds on the field data sheets associated with the Screening. The data from these sheets was transferred to an Excel file. The location data was saved as a separate file. Using commands in Excel, each Latitude and Longitude was converted to Decimal Degrees. After this file was saved as a dBase file, it was brought into ArcView as an Event Theme. The theme was converted to a shape file and projected into the TSMS coordinate system.
This data was projected onto the base map visually analyzed for errors. Many location errors were found. Using a more expensive GPS unit with data logging capabilities could reduce the errors. This would prevent errors in the recording of location data as well as errors due to manual data entry. The errors discovered were corrected in the database and projected again. The locations of the outfalls are shown in Figure 3.
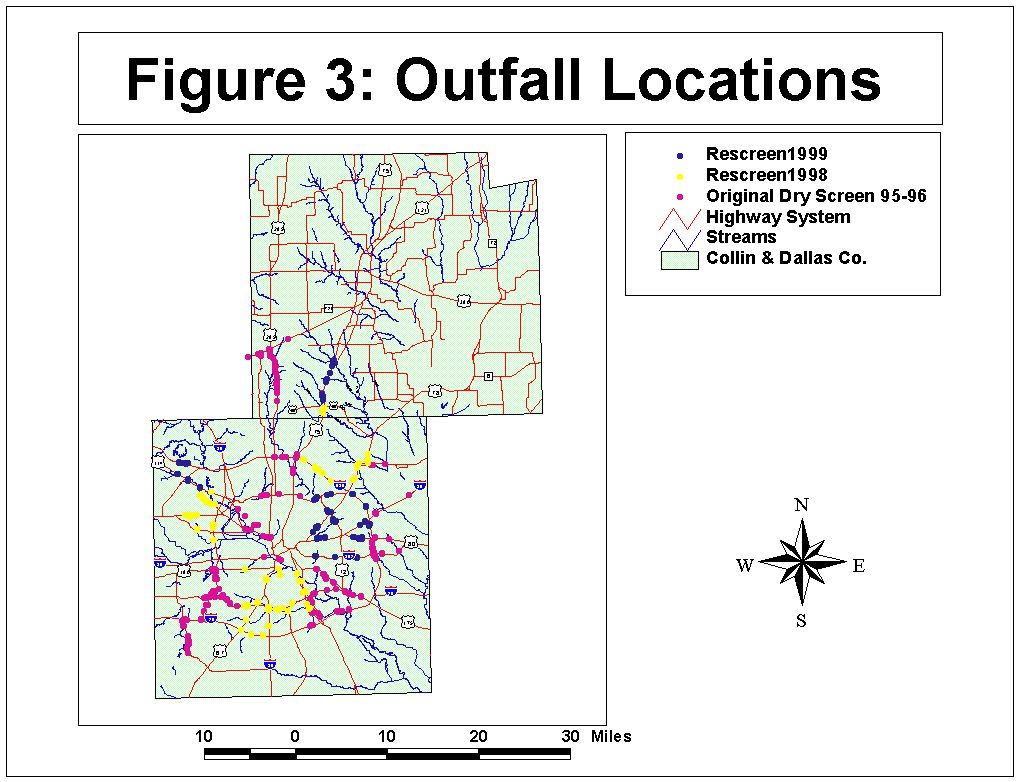
For easy access of data from the Dry Weather Field screening and re-screening, themes for the original field screening, the 1998 re-screening, and the 1999 re-screening were created. This was accomplished by joining the dBase files of field data collected with the outfall location theme, selecting features with screening data for each screening year, and converting the selected features and associated attributes to a shape file respectively. Each file was then projected into the TSMS coordinate system.
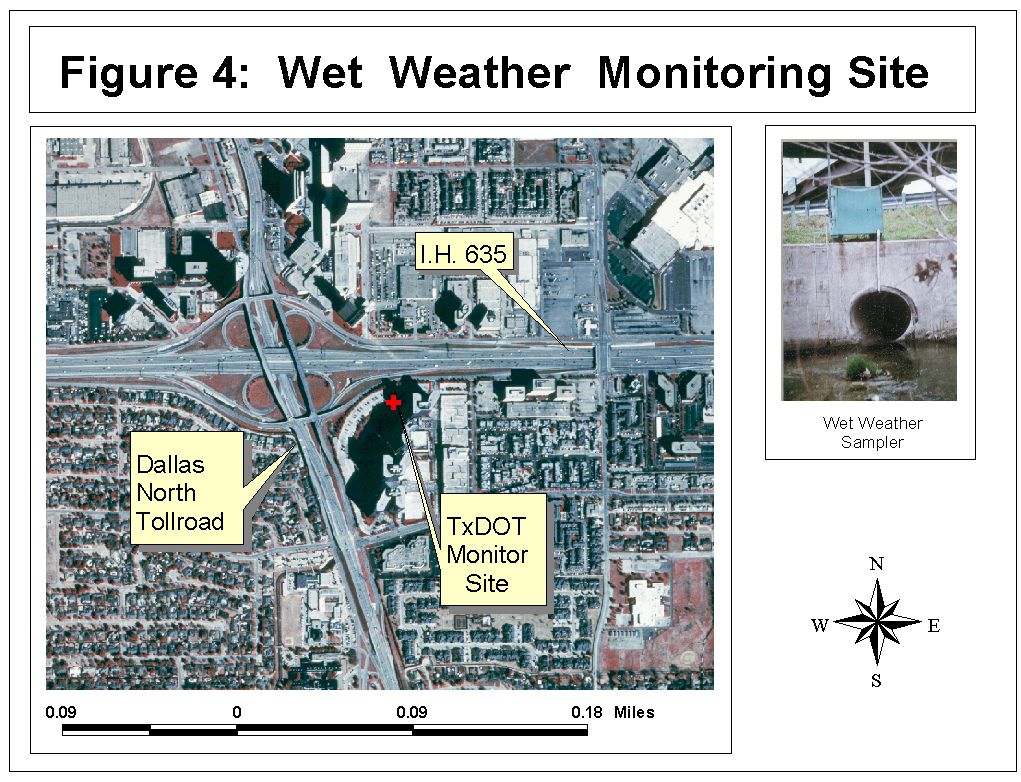
As part of the Departments permit requirements, TxDOT-Dallas operates two Wet Weather Monitoring sites. These sampling stations collect water samples from rain events. The analytical results from the sampling are saved in a dBase file. To display the information, a Wet Weather Monitoring theme was created and the dBase file with the sampling data was linked to the monitoring station points. In addition, the aerial photos of the sites were found at the Texas Natural Resources Information System website TNRIS.state.tx.us/digital data/doq_2.5M. The southwest Duncanville quad map was selected for the Mountain Creek site and the Southwest Addison map was selected for the Bachman site. Both files were downloaded as tiff files and added to the project as a theme in a view. The zoom function was used to size the view to the area of the stations. The location of one monitoring station and aerial photo were displayed in the following view.
After collecting all the spatial and attribute data, a GIS system for managing storm water quality data was developed. This was accomplished by the following tasks.
Because the area around the Roadways drain water to the outfalls, the Right-of -Way is important in storm water issues. The width of the right of way varies for individual locations. For this project, a buffer of 75 feet on either side was created. To facilitate viewing, the buffer was made a separate theme called Roadway Buffer or Right of way.
A photo is taken of each outfall during the dry weather field screening. It might be useful to access these photos from the GIS System. The existing photos were scanned as .BMP files and named with the entry number associated with them. The photo files then were linked to the outfalls using the HOTLINK function in ArcView. In the future, re-screening will incorporate digital photographs, which will simplify the process of linking them to the project.
Photos and sampling data of the two Wet Weather Monitoring sites were organized into two new projects. The projects were linked to the sites on the site map in the GIS system in the same manner as hotlinking the photos to the outfall locations. The table for the two points was opened and edited by adding a field for the name of the site and a hot link to the project for each station. When the Hotlink tool is clicked on each of these two sites, a new project is opened. In these new projects, the user can view a photo of the site, aerial photos of each site, and a table of the results of the samples collected at the site.
The next step was to create a graphical user interface (GUI) that allows a person unfamiliar with Arcview to access the views in the Storm Water Quality Data Management System. It is desirable to develop such a user interface while at the same time protecting the data from inadvertent changes caused by the user. For this project, five views were selected for display. They are:
To create this GUI, scripts were written, compiled and run using the programming language Avenue. All menus except the help menu were removed. This will prevent the user from unintentionally altering the set-up or the data of the Management System. Next, custom buttons were added to display the various views available to the user. All other buttons were removed. To customize buttons, the titles for the buttons were typed in to provide the user with the actions that each new button will produce. A separator was used to space buttons. The name of each view was used to help the user select the view he/she is interested in.
The next step in customizing the display is the modification of the Toolbar. In this case, we would like the user to be able to use many of the Toolbar Features to examine the view so only a few of the Tools were removed to prevent altering the Management System.
The final step in customizing the System is to modify the Project Menu and buttons. The process is the same as the process for modifying the view menu and icons. In this case we wish to provide the user with a button to select to start the Management System Display. Once again unneeded menus were deleted and a title was typed in for the button. The Data Management System is shown in Figure 5.
Compliance with the permit conditions of NPDES creates a huge amount of data. New data is added every year. The data collected has many forms such as sample results, field data, and photographs. By using a geographic information system, the vast quantity of data can be brought together. This facilitates viewing, sorting, and analyzing the data. The user has access to all the data without resorting to finding various computer files and field data sheets. The data can be analyzed in several ways. For example, the user might want information on the dry weather field screening for only major outfalls such as those width diameters greater than 36". The user can query the tables to view this information. While this could be done in a database file, the GIS gives a spatial dimension to the data that allows the user to see where the outfalls are located. If these outfalls require further inspection, those activities can be planned efficiently.
The spatial dimension also allows the user to see where the outfalls discharge and what watershed may be impacted from highway runoff. The user can view location data and photographs of each outfall. He/she can access the data from not only the original screening, but also re-screening for 1998, 1999, and any subsequent years. The user can plan for future dry weather screening also. There are many other tasks that can be accomplished with the Data query functions as well.
By creating a customized graphical user interface with proper titles, an easy to use Storm Water Quality Management System has been developed. The user can select from various views that are of interest. The zoom and pan features of Arcview have been retained, so the user can move around in the views to see certain areas in more detail. In addition, the user can use the identify tool to access the Dry Weather Screening data collected during the original screening in 1995-1996 as well as the re-screening data from 1998 and 1999. Under the position and photos view, the user can access the Latitude and Longitude of the outfalls using the identify button. Also, by using the Hotlink tool, Photos of the outfalls can be viewed. The Wet Weather Monitoring view has been added. This view shows the locations of the two Wet Weather Monitoring stations operated by TxDOT-Dallas. The locations of the two sites are hotlinked to two new projects. When the Hotlink tool is clicked on each of these two sites, a new project is opened. In these new projects, the user can view a photo of the site, aerial photos of each site, and a table of the results of the samples collected at the site.
With the custom GUI data from the Storm Water Quality Management system can be accessed and viewed by some one only casually familiar with GIS. The GUI also protects the System from inadvertent changing of the data or views by removing the menus and buttons that could cause problems.
A number of lessons have been learned from the process of developing the Storm Water Data Management System. The first lesson learned was to use a common projection. In this project, TSMS was used because it was the projection of the base map. As data from different sources was added, each file had to be re-projected to TSMS. Re-projecting files is very time consuming and can be a source of errors. By using a common projection the files can be added with out re-projection in many cases.
The next lesson involved the selection and use of the Global Positioning System receiver. The Dry Weather Field Screening data was collected using an inexpensive receiver. While the accuracy seemed adequate for the project, many errors were introduced by recording the positions on the field data sheets and then entering them into the computer database. It was hoped that these errors could be corrected during the re-screening efforts, but unfortunately few of the errors were corrected and even more were introduced. To minimize this problem a more sophisticated receiver should be used. A receiver with data logging capabilities will allow the user to input all the information on an "electronic' field data sheet. This information can be downloaded directly to the computer and eliminate many of the data entry errors both in the field and in the office.
The final lesson was to use a digital camera for recording photos of the outfalls. By using this type of camera, the need to scan photos is eliminated thus saving a great deal of time.
A geographical information system is an excellent tool for managing the large amount of data generated by compliance with the requirements of NPDES MS4 regulations. The system, when coupled with a graphical user interface, allows the user to access, view and analyze the results from programs such as the Dry Weather Field screen and re-screening, as well as Wet Weather Monitoring. The System can be expanded to meet the future needs of users. Not only can results of sampling and re-screening be added, but new programs can be added to the system as well. Sites of spills, dumping and historic contamination could be added, as well as future research projects could be added as new themes or views. Another area that can be developed in the future is the production of reports for submission to regulatory agencies such as EPA or the Texas Natural Resource Conservation Commission. The GIS is a powerful tool and can be used in many ways. As the System is used, it will grow and be modified to suit the needs of many users.
Jay McCurley
Texas Department of Transportation
P.O.Box 133067
Dallas, TX 75313-3067
Tel. (214) 320-6207
Fax. (214) 320-4476
Email: jmccurl@dot.state.tx.us
Jianling Li, Ph.D.
Assistant Professor
School of Urban & Public Affairs
The University of Texas at Arlington
P. O. Box 19588
Arlington, TX 76019
Tel. (817) 272-3367
Fax. (817) 272-5008
Email: jjli@uta.edu