Putting
Puzzles Together When the Pieces Don’t Fit: Data Integration
Authors:
Chris Curlis, U.S. Bureau of Reclamation
Jeff Milliken, U.S. Bureau of Reclamation
Barbara Simpson, U.S. Bureau of Reclamation
David T. Hansen, U.S. Bureau of Reclamation
______________________________________________________________________________________________________________
Abstract: The U.S. Bureau of Reclamation and the U.S. Fish and
Wildlife Service are developing a land cover database to detect change
in the Central Valley of California. The main objective is to identify
and monitor change in habitats. An initial base line layer was created
using 1993 data This paper will detail the challenges of integrating
data from six pre-existing sources. The project also integrates some
of the unique capabilities of Arc/Info, ArcView, ERDAS Imagine and IPW
software to produce a seamless base layer which can be joined with similar
change detection programs being undertaken by other agencies for California.
______________________________________________________________________________________________________________
I. Introduction
The Central Valley of California is a critical tract of land that impacts
the economy of the United States and much of the world. The predominance
of agriculture in the Central Valley and the redistribution of water within
it to a state population of over 30 million has made it a landscape of
constant change. While the Central Valley is important to the economy
and well being of people, it is also a critical habitat to countless plant
and animal species. Despite all the aforementioned change there have
been few coordinated widespread efforts to monitor the nature and extent
of change and how it affects wildlife habitats.
The U.S. Bureau of Reclamation (USBR) and the U.S. Fish and Wildlife
Service (USFWS) in cooperation with other interested parties are developing
data and processes to monitor habitat change on a regular basis to develop
a land cover database to detect change in the Central Valley. This
project is known as the Central Valley Habitat Monitoring (CVHM) program.
The baseline year of 1993 was chosen due to the availability of land
use / land cover data coupled with requirements associated with water contract
renewals. The data for the study area came from six pre-existing sources
with varying characteristics and extents. This paper will detail
the challenges of integrating data to produce a seamless base layer which
can be joined with similar change monitoring programs already being undertaken
by other state and federal agencies for the areas of California surrounding
the Central Valley.
II. Project Area
The CVHM project area comprises approximately 31 million acres including
the entire Central Valley of California and surrounding lands. (figure1)
The boundary was determined from USBR federal irrigation districts and
USFWS areas of interest.
Figure1. CVHM Project Boundary
III. Data
The data sets used to develop an approximate representation of the
1993 base layer map include:
Ducks Unlimited / California Department of Fish and Game (DU/CDF&G)
This widely used data set was developed from multi-date 1993 Landsat TM
imagery. It is generally based on 2 1/2 acre minimum mapping unit polygons
which were derived from various original source data as well as an unsupervised
pixel classification of the TM data.
California Department of Water Resources Land Use (DWRLU)
The DWRLU database is on a county basis. Counties are not mapped on an
annual basis. Where available data was utilized for the years 1989-1995,
though the majority of counties used were within ± 2 years of the
1993 base year.
California Department of Conservation Farmland Mapping data (FMMP)
This database represents ground conditions for 1994 and also does not cover
the entire study area. This database primarily identifies agricultural
and urban areas.
California Department of Forestry Hardwoods Mapping (HDWD)
This database was developed in the early 1990's and covers only a portion
of the study area along the edges of the Central Valley floor.
Gap Analysis (GAP) This database has data for virtually
the entire project area though it does represent ground conditions that
are pre 1993. It uses the Wildlife Habitat Relationships (WHR) classification
system.
U.S.Geological Survey National Land Cover Database (NLCD)
This large region based land cover classification is derived from early
1990's TM imagery and several ancillary data sets.
U.S. Forest Service Vegetation Mapping (USFS) This database
has 2 ½ acre mmu polygons which are labeled in the CALVEG vegetation
classification. The polygons are derived from Landsat TM data using
some of the same techniques described in this paper.
The first six data sets above were integrated and compared to develop
the 1993 CVHM base map, however in portions of the study where the USFS
database existed for the proper time frame it was crosswalked and incorporated
directly into the CVHM base map.
Figure 2 shows the classification system and areal extent of the six
data sources.
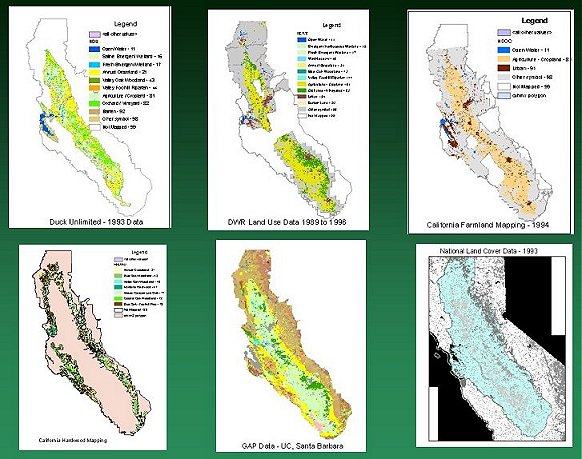
Figure 2. Areal Extent and Classification Legends of the Six
Data Sets to be Integrated
IV. Methodology
Classification System
A critical starting point for the integration of the six data sets
was the development of crosswalks which would convert every class in all
data sets to a common set of classes to be used across all areas. This
involved frequent review and revision based on the needs of all intended
users of the final 1993 base map. The process crosswalked six separate
classification legends into broad WHR categories. These categories
are under review and being modified in accordance with recommended standards
coming from state and national guidelines. See Hansen, et. al., 2001
for specifics on the classification systems and crosswalksused in the CVHM.
Data Conversion
The six existing data sets were crosswalked to the CVHM classification
through the use of AMLs in Arc/Info for the vector based polygon data as
well as a recoding program in Erdas Imagine for raster based data such
as the NLCD. All the crosswalked ARC coverages were next converted to raster
GRID data and then imported into Erdas Imagine .img files.
Image Segmentation
Overview - A unique aspect in this integration of the six non-conforming
data sources is the use of image segmentation algorithms (Woodcock and
Harward, 1992) to create spectral based polygons. It is often very difficult
to compare and contrast multiple sources of land cover data covering the
same area of interest. This is due to differences in classification systems,
minimum mapping unit size, and methods used for creating polygon boundaries.
Image segmentation offers a method for creating polygons from any digital
image based solely on spectral similarity. The resulting polygons carry
no label except a unique polygon ID. Land cover (or other) labels can be
given to each polygon based on any other ancillary data source (e.g. other
digital landcover layers, pixel-level spectral classification, etc.).
In the case of this project, after crosswalking all source data to the
common CVHM classification system, grids were made for each source layer
and “overlaid” with the spectral polygons. Histograms representing the
distribution of classes for each source layer within each spectral polygon
can then be generated. Based on this distribution, a single label can be
assigned to the spectral polygon for each source layer. The result is a
database containing a land cover label representative of each source layer
for each spectral polygon (figure 4). This allows for a more direct comparison
of databases regardless of differing minimum mapping units and mapping
methods.
Determining proper parameters for the image segmentation algorithm is
critical to getting acceptable results. Parameters may vary as a function
of the type and resolution of the source imagery as well as other considerations
such as the level of detail in the classification system being used.
Parameters and source imagery – Image segmentation is an iterative
algorithm which aggregates digital image pixels into contiguous groups
of spectrally similar pixels (regions). Image segmentation algorithms for
the CVHM project were developed by the Boston University Center of Remote
Sensing and function within the Image Processing Workbench (IPW) public
domain software (Frew, 1990). The algorithm produces a single raster layer
whose pixels each carry a unique number identifying which region they belong
too. ARC programs “imagegrid” and “gridpoly” can be used to convert the
raster region coverage into an ARC polygon coverage. Region boundaries
tend to conform to real boundaries in the landscape, much like polygons
derived from traditional aerial photo interpretation. Depending on the
type and resolution of the source imagery, minimum region size specified,
and spectral thresholds, regions may also represent much more subtle changes
in the landscape than what is typically delineated using more traditional
methods. However, these are often aggregated to coarser polygons as a function
of the classification system and nature of the source data being used for
labeling the regions. The user can define both spectral and spatial thresholds
to control the size and nature of regions, as well as merging parameters
for pixels during the multi-pass process.
Landsat 5 Thematic Mapper (TM) imagery from 1993 was used for
this project. A 2 ½ acre minimum mapping unit (mmu) was used with
the segmentation algorithm. This mmu is also consistent with other statewide
mapping efforts. The computational constraints created with this mmu necessitated
the use of 58 processing areas for image segmentation. Landsat TM imagery
was subset for each processing area. TM bands 3, 4, and a texture band
derived from band 4 were used for the segmentation process. This combination
of bands (3,4, texture of 4) have proven effective in vegetation
mapping efforts such as the USFS vegetation mapping program in Region 5,
California (Miller, et. al., 1994). Figure 3 displays segmentation polygons
generated from the Landsat TM data. Figures 4-8 show the polygons from
several of the pre-existing data sets for the same area as Figure 3.
Differences are apparent in the polygon labels and extent.
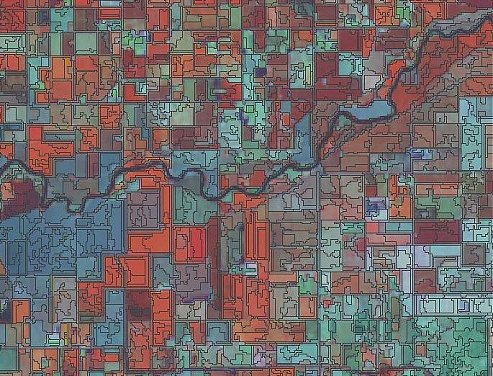
Figure3. Image segmentation polygons overlaying Landsat TM imagery
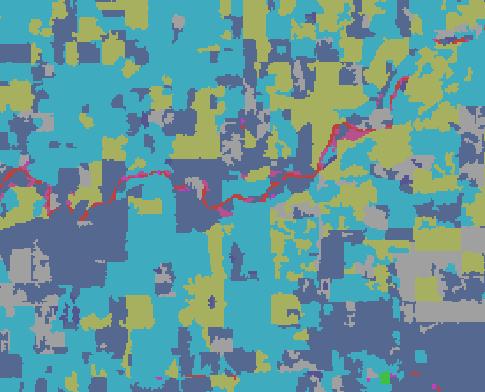
Figure 4. DU polygons within area shown in Figure 3.
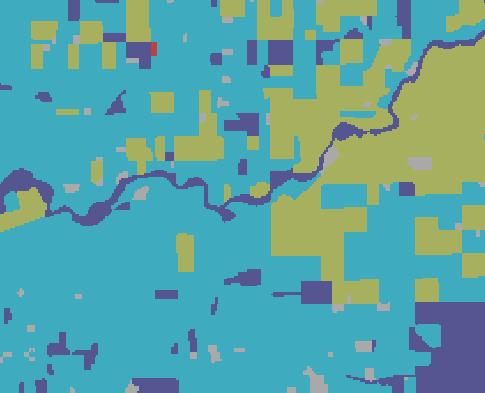
Figure 5. DWR polygons within area shown in Figure 3.
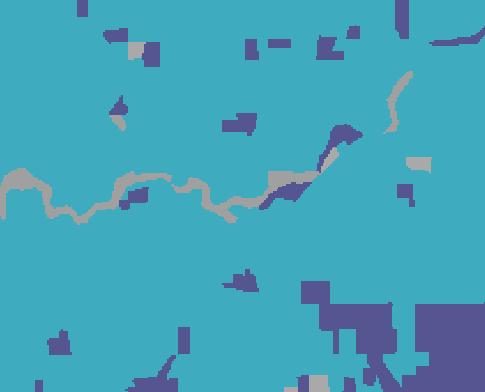
Figure 6. DOC polygons within area shown in Figure 3.
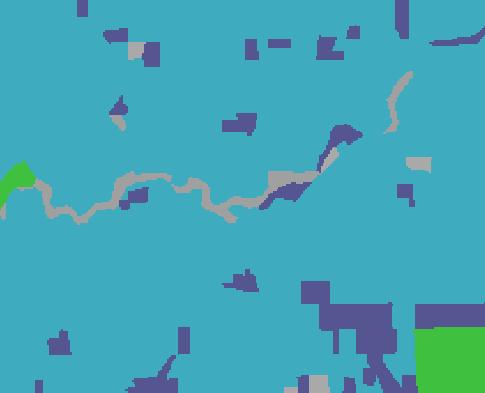
Figure 7. GAP polygons within area shown in Figure 3.
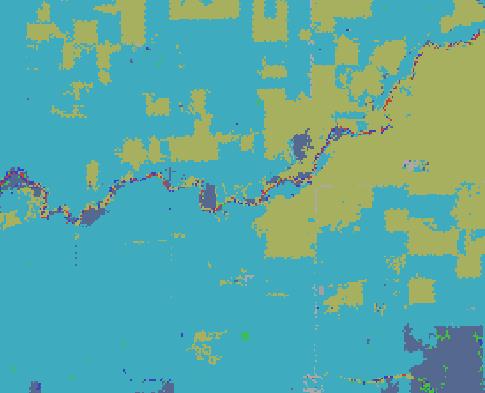
Figure 8. NLCD pixel based polygons within area shown in Figure
3.
Attributing polygons
After generating 2 1/2 acre mmu spectral polygons for each processing
area, polygons were attributed based on raster grids of the six pre-existing
data sets. The "Zonal Attributes" function is used in Erdas Imagine to
examine all pixel values which underlie each spectral polygon and,
based on a plurality rule, create a new Arc coverage item and populate
this item with the label for each polygon. This process is completed
for all the 58 processing areas and also completed for each of the six
data sets. The resulting database contains six new items representing each
of the six data sets. Each item is populated with its corresponding
land use / land cover label. Figure 9 shows part of a data table:
each record represents a single polygon that has been assigned land cover
/ land use labels based on this process.
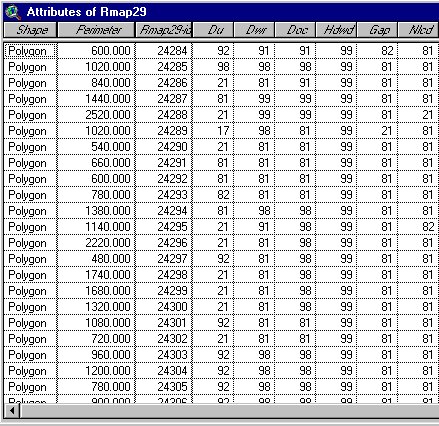
Figure 9. New attributes created for plurality of each of six data
sets.
Du = Ducks Unlimited
Dwr = Department of Water Resources Land Use
Doc = Department of Conservation Farmland Mapping
Hdwd = CDF Hardwoods Mapping
Gap = Gap Analysis
Nlcd = USGS National Land Cover Database
Rmap29-id = Polygon ID
Developing Labels
Evaluation and development of rules to create final labels The
evaluation of the newly attributed coverages allows for the development
of rules which are used to to decide which of the six data sets will be
used to determine the final label for each spectral polygon in the CVHM
base map. Many cases of systematic misclassification were detected
through this method. For example, the DU data clearly confused many fallow
agricultural fields with the barren classification (figure 10). A
set of rules were developed to correct this deficiency and use the other
data sets correctly identify the polygons with this particular combination
of labels. A new item for the final CVHM label was added to the database
and attributed based on a combination of labels represented in the six
source data sets. (See Hansen, et. al., 2001 for a discussion of the labeling
rules) All the processing polygons and with them the spectral polygons
are mosaiked together into a complete project wide coverage. At the
time of this writing the project wide coverage is undergoing final development.
Once completed it will serve as a base map for change detection studies
in the Central Valley and undergo refinements in an ongoing monitoring
program.
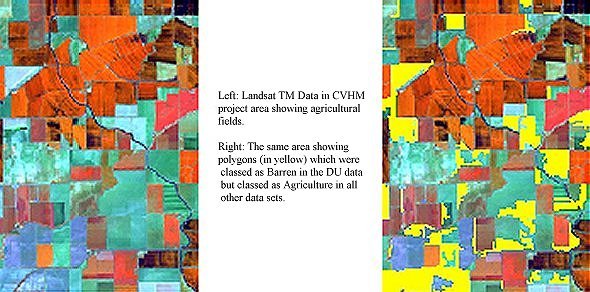
Figure 10. Systematic misclassification detected through CVHM
attribute analysis.
V. Summary
In order to create a seamless 1993 database of land use / land cover
for the the CVHM project area a technique had to be developed which would
integrate all the non-conforming data available and put it into a common
format. Image segmentation has proven to be the critical tool which
accomodates this task, enabling the comparison of multiple data sets in
common geographical areas. This allows for improved mapping efforts.
As work is progressing toward standardizing geographic data, the development
of innovative techniques to integrate data will be a key element
in achieving this goal.
References
Frew, J.E. 1990. The Image Processing Workbench, PhD Dissertation, University
of California, Santa Barbara p. 303.
Hansen, David T., B. Simpson, C. Curlis and J. Milllken, Legend Development
for a Land Cover / Habitat Classification Project for the Central Valley
of California, Twenty First Annual Esri International User Conference,
San Diego, CA., July, 2001
Miller, Susan C., H. Eng, M. Byrne, J. Milliken and M. Rosenberg, Northeastern
California Vegetation Mapping: A Joint Agency Effort, Fifth Forest Service
Remote Sensing Applications Conference, Portland, OR., April, 1994
Woodcock, C.E., and J. Harward, 1992. "Nested-Heirarchical Scene Models
and Image Segmentation". International Journal of Remote Sensing,
13(16):3167-3187.
For more information on the Central Valley Habitat Monitoring Program
please refer to the following papers in these proceedings:
Framework Land Cover Monitoring of California's Central Valley - Primary
Author: Barbara D. Simpson
Legend Development for a Land Cover / Habitat Classification Project
for the Central Valley of California - Primary Author: David T. Hansen
Acknowledgements
My thanks to the CVHM project team: Elena Robisch and Bart Prose,
U.S. fish and Wildlife Service
Jeff Milliken, Barbara Simpson and Dave Hansen, U.S. Bureau
of Reclamation
Contacts:
Chris Curlis, U.S. Bureau of Reclamation
Jeff Milliken, U.S. Bureau of Reclamation
Barbara Simpson, U.S. Bureau of Reclamation
David T. Hansen, U.S. Bureau of Reclamation
MPGIS
U.S. Bureau of Reclamation
Mid Pacific Region
2800 Cottage Way
Sacramento, CA. USA 95825-1898
Phone: (916) 978-5030
Fax: (916) 978-5055
Email: ccurlis@mp.usbr.gov