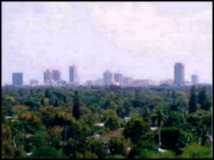
Mapping Tree Canopy in Broward County, Florida
By Victoria Morrow, Jill Young, and Dr. Charles Roberts
July 2001
Abstract:
Tree canopy is essential to environmental and economic health, providing additional
cooling, reducing energy needs, increasing property values, improving air/water
quality, reducing the cost of storm water control, and contributing to a more
beautiful, friendlier, and livable community. Broward County Government recognizes
the importance of gathering accurate information on the health and diversity of
the community's urban forest. Despite having the expertise and the tools to
acquire a total tree canopy, hardware/software issues and other unexpected
hurdles made this endeavor problematic, yet in the end successful. This paper
addresses the methodology used to create Broward County's tree canopy layer.
The Importance of Tree Canopy
Tree canopy is essential to environmental and economic health, providing additional
cooling, reducing energy needs, increasing property values, improving air/water
quality, reducing the cost of storm water control, and contributing to a more
beautiful, friendlier, and livable community. "The benefits represent hefty dollar
amounts, many millions to big cities even after the costs of tree management,
which average less than 1 percent of municipal budgets. Psychological benefits, too,
are worth plenty. People simply feel better and kinder around trees. Trees bring
birdsong. They provide privacy and a sense of protection. Hospital patients exposed
to trees heal faster, feeling less pain," (Plotnik, 2000).
 The Broward County Board of Commissioners
established the Broward Urban Forest Initiative in
1999 to stem the loss of tree canopy from
Broward's urban landscape. One aspect of that
initiative was to map and monitor the percentage of
tree canopy county-wide. With that as a base line,
urban foresters would be able to evaluate the
present extent of tree canopy and monitor changes
over time to ensure these goals were achieved.
The Broward County Board of Commissioners
established the Broward Urban Forest Initiative in
1999 to stem the loss of tree canopy from
Broward's urban landscape. One aspect of that
initiative was to map and monitor the percentage of
tree canopy county-wide. With that as a base line,
urban foresters would be able to evaluate the
present extent of tree canopy and monitor changes
over time to ensure these goals were achieved.
Florida has the widest variety of tree species of any other state in the continental
United States. Of the approximately 625 trees native to north America, at least
275 are found within the confines of Florida. Add to this an extensive list of
introduced and naturalized species and Florida's tree flora becomes expansive
indeed.
Three factors mostly define the nature of southern Florida's biodiversity: The
recent origin of freshwater and terrestrial ecosystems; peninsula geography and
habitat diversity; and subtropical wet/dry climate and productivity. Located along
the southeastern perimeter of the North American continent and surrounded by
vast expanses of ocean water, the state is strategically positioned to share in the
flora of both the temperate and the tropical climate zones. Florida's subtropical
location spanning 40 degrees - 42 degrees north latitude supports around half of
its plant species which are of temperate origin, an extension of the flora of the
Southeast coastal plain. The other half are members of the Caribbean tropical
flora and reach their northernmost limit in South Florida. Water resources for
this area are primarily available from rainfall and surface and groundwater storage
systems such as shallow surface aquifers. The area between Boynton Beach and
Miami receives the highest amount of rainfall in the State (163 cm or 63 in).
Broward County is situated on the southeast coast of Florida between Miami-Dade
and Palm Beach Counties. It has a total land area of 1,197 square miles; the western
787 square miles encompass the Conservation Area and the eastern 410 square
miles include 30 municipalities and 23 miles of beachfront. Broward County is the
second largest county in Florida with an estimated 1999 population of 1.5 million.
Although the county is highly urbanized, many species of native flora continue to
exist in the remnant patches of native vegetative communities. Ecological
communities found in Broward County include beach dune, coastal strand, maritime
and tropical hardwood hammocks, scrub, pine flatwoods, mangrove swamps, coastal
saltmarsh, freshwater marsh, and wet prairie (Meyers and Ewel 1990, Science
Subgroup 1996).
Potential Uses
Potential uses of a tree canopy coverage are numerous. It can be used to measure
tree canopy over time and to determine where new trees should be planted. Tree
shade and evaporation of water from the leaves (up to hundreds of gallons daily
from a mature tree) cool hot city air and surfaces. Shade from trees can cut heat
some 20 degrees, reducing energy costs. It can be used to monitor tree loss due to
diseases such as the citrus canker that has devastated south Florida's citrus trees
or to natural disasters like hurricanes or earthquakes. It can even be used to
establish a debris management estimation model for hurricane preparedness and
recovery. (Close to 40 million cubic yards of debris would be generated by a
category 4 hurricane in Broward County, according to a preliminary estimate done
for Broward County's Emergency Management Division.) Trees help cleanse the air,
intercepting airborne particles and absorbing such pollutants as carbon monoxide,
sulfur dioxide, and nitrogen dioxide. Trees stabilize soil, conserve rainwater, and
reduce water runoff and sediment deposit after storms. Trees muffle urban noise
almost as effectively as stone walls.
There has been shown a direct correlation between tree canopy and urban violence.
A study by W.C. Sullivan and F.E. Kuo demonstrated that trees influenced attitude
in a Chicago public housing project. "Residents of a building surrounded by trees
experienced less aggression and violence in their homes than residents of a twin
building without trees. They also got along better with their neighbors," (Plotnik,
2000). A tree canopy coverage also gives communities tools to measure
success/failure of tree initiatives and a perceptual tool to decide how they want
their communities to look and feel. Additionally it provides a means of measuring
environmental health of a community (because of the correlation between ecology
and tree canopy) as well as a way of identifying possible greenway linkages between
urban forests.
Ideally a complete tree inventory would be beneficial to planning a green
environment, but logistically that's not feasible. The manpower and cost required
to undertake such a task would be prohibitive, particularly in a local government
setting. GIS and remote sensing techniques offered a more cost-effective way of
generating the information. As with any technological solution, there are
limitations, but overall, extracting tree canopy from digital aerial photographs is a
viable alternative.
Initial Stages
During the inception of the project, the County reorganized and two large
departments, Strategic Planning & Growth Management and Natural Resource
Protection were merged into the Department of Planning and Environmental
Protection (DPEP). The Tree Canopy Project was seen as a way to integrate the
Department's multiple GIS staff into a department-wide resource sharing venture.
While it was a good idea on paper, in reality, it didn't work. Staff was too busy with
their own divisions' projects to devote any serious time to learning to classify
trees. Therefore, it was determined that the Tree Canopy Project would be done
primarily by the Planning Services Division GIS staff, a contingent of two, because
they were the only staff with any expertise in digital image processing and remote
sensing principles.
 The imagery used for this project were
taken in January 1996, prior to the
inception of this project. They were color
infrared scanned photographs with no
georeferencing and no fiducial marks on the
photography. Although new photography
was flown in January 2000, it was decided
that the 1996 imagery would be mapped
and classified as a baseline for tree canopy
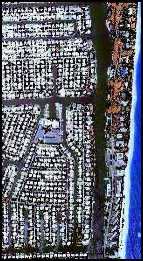
in Broward County. Figure 2
The imagery used for this project were
taken in January 1996, prior to the
inception of this project. They were color
infrared scanned photographs with no
georeferencing and no fiducial marks on the
photography. Although new photography
was flown in January 2000, it was decided
that the 1996 imagery would be mapped
and classified as a baseline for tree canopy
in Broward County. Figure 2
Initially the first iteration was to be done using the most recent photography, but
due to delays by the vendor (the 2000 photos were not delivered until August
2000), it was decided to move ahead with classifying the 1996 images. First step
was to generate fiduciary marks on the photos, then to georeference the photos
using 1997 black and white orthorectified aerial photographs. This was done in
PCI's OrthoEngine by an intern initially and later completed by staff. This
software was chosen particularly because of its ability to generate 'tie points'
between images, a way of generating additional control points "on the fly."
Essentially we used image-to-image rectification, based on 1997 black and white
aerial photos which were georeferenced.
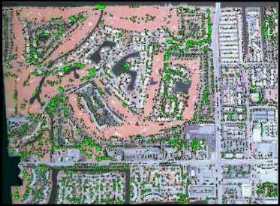
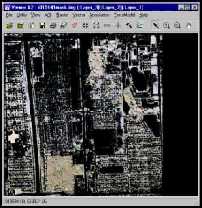
One of the first questions addressed by staff was, 'Would it be better to digitize
the tree canopy or use digital image processing techniques to generate the canopy
coverage?' To determine the scope of time and work involved, a test area of a
one-mile section was generated. One staff member was assigned to digitize the
pilot area while other staff worked out the methodology to perform image
processing. It took one staff member approximately 4 weeks to digitize the tree
polygons in a one-mile section. (See Figure 2.)
Once the methodology was established, it took 4 hours to create a coverage for
the same area using the digital image processing techniques. Considering this
process needed to be repeated 440 times, the image processing methodology was
by far more practical.
Early on it was apparent that existing hardware and software would have to be
updated in order to complete the project. The image processing software, ERDAS
Imagine 8.4 required NT as an operating platform. As it happened, plans had
already been made to upgrade workstations from UNIX to NT throughout the
department and to upgrade existing software to the latest versions, which required
NT to run; this project merely sped up the replacement process. This also provided
us with more processing power and storage capacity than was available on our
existing UNIX Alpha workstations. However, we still had the problem of our
classification processes exceeding the limits of the software.
 It was initially suggested that one way to cut down on the
scope of the work was to mosaic the photos together and then
one classification be run over the entire image. There were
several problems with this: First, the mosaicked images were
well over 16 gigabytes and well beyond the capabilities of the
software to process. Secondly, the differences in color even
across individual photographs made a single classification
impossible. Thus, an answer to both these issues was to clip
the photos to smaller areas for processing and classification. Since the final
coverages were to be kept in Arc/Info's Map Librarian, which tiled the information
by one-mile sections, it made sense to clip the images to that size.
It was initially suggested that one way to cut down on the
scope of the work was to mosaic the photos together and then
one classification be run over the entire image. There were
several problems with this: First, the mosaicked images were
well over 16 gigabytes and well beyond the capabilities of the
software to process. Secondly, the differences in color even
across individual photographs made a single classification
impossible. Thus, an answer to both these issues was to clip
the photos to smaller areas for processing and classification. Since the final
coverages were to be kept in Arc/Info's Map Librarian, which tiled the information
by one-mile sections, it made sense to clip the images to that size.
Reducing the size of the images also worked well with our plan to keep the
coverages county-wide in Arc/Info Map Librarian. Other large coverages such as
future land use and existing land use were stored by section, township, and range,
so it made sense to store the tree canopy as another layer in that library. We
clipped the images by section to process them. This method also helped to
fine-tune the classifications because the color differences in the photographs
were less of a hindrance in the smaller images.
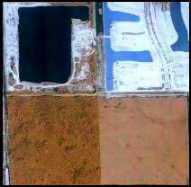
 One of the initial questions was what
constitutes a tree. There is no generally
accepted and botanically precise definition
of the constellation of characters that
constitutes a tree. This is not to say that
definitions have never been advanced nor
general rule of thumb adopted.
One of the initial questions was what
constitutes a tree. There is no generally
accepted and botanically precise definition
of the constellation of characters that
constitutes a tree. This is not to say that
definitions have never been advanced nor
general rule of thumb adopted.
Figure 4
It is the distinction between what constitutes a shrub and what constitutes a tree
that is at the heart of this definitional dilemma.
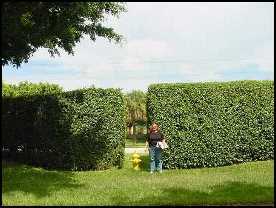
To compound this, in South Florida, many of the hedge species are actually tree
species which have been planted and trimmed as hedges. These hedges have the
same spectral characteristics as the full blown trees. Therefore the computer
classifies them as trees. The only indication of them being a hedge is their
geometric shape: long and linear, which the computer cannot detect. One species in
particular, Ficus sp., was favored by developers because of its thick lush speedy
growth. These hedges block traffic noise and provide privacy screens from
adjacent developments. In some cases these hedges exceed 12 feet in height. (See
Figure 4.) Height would not be a good identifier because it is nearly impossible to
tell height with any reliability on an aerial photograph using digital image analysis
techniques unless ancillary information such LIDAR (Light Detection and Ranging)
or photogrammatry is used. For this project, it was determined to use an area
greater than 4.5 square feet, using LIDAR to refine the coverages as it becomes
available. In this way single shrubs and small grassy patches would be eliminated
from the coverage.
Special care was taken to gather multiple training fields for golf courses. In
particular, training fields were taken of greens, roughs, fairways, and shrubbery, in
addition to the trees. While this improved classification results, these areas still
required additional editing work to eliminate grass polygons. This was also true of
highly irrigated and fertilized lawns, prevalent in the more exclusive developments.
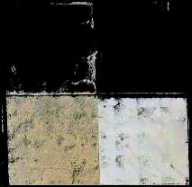
Color differences, reflected in the original color infrared image and in the
Normalized Difference Vegetation. Index (NDVI) masked image, are thought to be
scanner effects. Color differences were rampant in the photography, even across
the same image. At first it was thought that the color differences were merely
random effects, but after the Normalized Difference Vegetation Index (NDVI)
was performed, these differences were easily recognizable as regularly occurring
phenomena. Such a pattern in the colors of the images were determined to be
scanning effects caused by the scanner used to create the digital version of the
photographs.
Figures 5 & 6
File sizes were a continuing problem throughout the project life cycle, beginning
with the size of the images and continuing with the resultant Arc/Info coverages.
Once the coverages were inserted into Librarian and managed by section, township
and range, it was assumed that extraction of information and analysis of
information would be easier. To a certain extent, this was true, but even the
extraction of tree canopy by city has been problematic. A single request to extract
tree canopy by the city boundaries of Fort Lauderdale (33.5 square miles) took 25
hours on an NT server with dual 1 gigahertz processors and 1 gigabyte of RAM. The
resultant coverage was 1.16 gigabytes in size.
Methodology
The original raw data was delivered as color infrared TIFF files. Because it was
saved in the color infrared format, this meant that the infrared band was located
in band position 1, while the red was in band 2 position and the green was in band 3
position. The ERDAS software, in generating the NDVI, needed the infrared band
in band 3 position. This meant that as we were clipping the imagery, we also had to
reorder the sequence of the bands.
Even with the clipping of the images to one-mile sections, the files were still large,
with many different classes that would have to have Figure 7. Brightness values
used to separate vegetation from non-vegetation in the Normalized Difference
Vegetation Index show the breakpoint.training fields to use in the classification. By
reducing the three band image to a single 256 scale band image, the NDVI allowed
us to separate out vegetation from non-vegetation classes. (See Figure 7.) It even
allowed us to remove some of the grass classes from consideration in the
classification process.
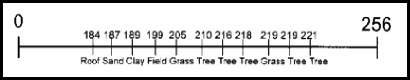
Figure 7
 The image resulting from the NDVI mask overlaid on
the original 3-band image was used to take training
fields. The normalized difference vegetation index
(NDVI) is a standard image ratioing technique that
has been around and in use since 1974, when it was
developed for use with the Landsat Multispectral
Scanner (Rouse et al., 1974).
The image resulting from the NDVI mask overlaid on
the original 3-band image was used to take training
fields. The normalized difference vegetation index
(NDVI) is a standard image ratioing technique that
has been around and in use since 1974, when it was
developed for use with the Landsat Multispectral
Scanner (Rouse et al., 1974).
Figure 8
The end result is an image where all vegetation, which has high reflectance in the
infrared relative to red, is one side of the data set, and all non-vegetation is on the
other side.
This produces a known boundary for pixels whose reflection is uninfluenced by
vegetation. Then it is possible to perform a piecewise stretch, and recode every
non-vegetation pixel to 0 and every vegetation pixel to 1, which allows the ratio
image to be used as a mask, combined with the original raw data to mask out every
non-vegetation pixel in the county. The resulting image contains only vegetation
reflectance information (Rouse, et al., 1974). In ERDAS, this function essentially
takes the Infrared Band - Red Band divided by the Infrared Band + Red Band.
Once the breakpoint between vegetation and non-vegetation was determined, all
non-vegetation classes were recoded to zero and the NDVI was then used as a
mask on the original image so that only vegetation classes would be classified. (See
Figure 8.)
 Training fields were taken on trees and non-tree classes
(grass, hedges, algae-laden water, etc.). A supervised maximum
likelihood classification was used because we wanted
everything in the image, excluding zeros, to be classified.
Once the classification was acceptable, these classes were
recoded to 1 and 0, ones being trees and 0 being anything that
was non-tree. The recoded image was then converted from
raster to vector with one of the attribute fields identified as
grid_code, which represented the tree or non-tree
classification.
Training fields were taken on trees and non-tree classes
(grass, hedges, algae-laden water, etc.). A supervised maximum
likelihood classification was used because we wanted
everything in the image, excluding zeros, to be classified.
Once the classification was acceptable, these classes were
recoded to 1 and 0, ones being trees and 0 being anything that
was non-tree. The recoded image was then converted from
raster to vector with one of the attribute fields identified as
grid_code, which represented the tree or non-tree
classification.
In order to have a coverage which for the most part only
delineated trees, the coverages were brought into ArcView,
selecting only the tree polygons and putting them into a new
shapefile. (See Figure 9.)
Figure 9
This effectively reduced the size of the coverage when we converted it back into
an Arc/Info coverage and clipped it by section. The second clipping was necessary
because in clipping the image, which results in a square or rectangular shape, extra
pixels outside the section boundaries were retained. Clipping the coverage a second
time eliminated the extra pixels and allowed the coverages to be placed in the Map
Librarian grid. The major reason for using ArcView at this stage is that it allowed
us to quickly edit and query the data; the process in Arc/Info took hours for a
simple query opposed to mere minutes in ArcView.
Initial calculations show that Broward County has a tree canopy of approximately
13 percent, which falls short of the recommendation by the American Forests
which stresses that a 40 percent tree canopy is essential to sustain the ecological,
environmental and social health of a community. (American Forest, 2001) Individual
cities have canopy percentages as high as 45 percent (Lazy Lake) and as low as 11.5
percent (Hallandale Beach).
Lessons Learned
An issue to be wary of in considering such a project is the imagery itself. The
person in charge of purchasing the imagery should be well-versed in remote sensing
techniques and imagery types and limitations. With the cost of imagery dropping
drastically as more and more vendors offer this service, it can be difficult to keep
abreast of which imagery is best for a particular project. As resolution gets
smaller and smaller, enabling researchers to measure things like the canopy of a
single tree, file sizes get bigger and bigger. Storage and retrieval become
significant factors in managing the database once it is generated.
Knowing when and how the imagery was generated and what processes were done on
it prior to delivery can save a lot of headaches later on. Metadata on the imagery
should be kept just as would be done on GIS coverages. This is particularly
important if plans include time series or change detection studies, because in order
for comparisons to be valid, measurements and methodology need to be consistent.
The time of year that the imagery is flown can be significant in regard to cloud
cover or whether trees are in leaf-on or leaf-off mode. The classifications should
be done as soon as possible after the delivery of the imagery. Even in the span of
one year, significant change can occur on the ground that will affect
ground-truthing and subsequent accuracy assessments.
As mentioned earlier, sufficient staff and resources need to be allocated to a
project such as this. Hardware and software need to be sufficient to handle
processing and storage demands and ideally should be in place in advance of the
production schedule. Staff needs to be well-versed in remote sensing principles and
techniques, as well as GIS. Mere training on the software packages is not
sufficient. Documentation of processes and procedures is vital in the event of
staff turn-over during the life of the project. Additionally, upper management
support of the project is imperative in providing staff and resources.
Perhaps the most significant lesson we learned in creating the Tree Canopy
Coverage is that in the future we should hire outside consultants to do the work.
Attempting to complete such a large scale project using our limited staff resources
while continuing to keep up with regular work, proved to be unrealistic and moved
the project beyond its initial time line considerably. Hiring a consultant would
alleviate the drain on staff time. Even so, one of the significant benefits from
doing the first phase of this project in-house is that now staff has the skill and
expertise to prepare technical requirements for the project and monitor progress
and quality of deliverables.
Special thanks to Sean McSweeney, Jennifer Zumbado, Reann Soodeen, Robert
Humple, Terri Cruz, David Johns and Norman Casey for their support and
assistance in this project.
References
American Forests, Retrieved May 25, 2001, http://www.americanforests.org/tr ees_cities_sprawl.
Broward County Government, Planning Services Division, Retrieved January 06, 2001,
http://www.co.broward.fl.us//cni02002.ht m.
Myers, R.L., and J.J. Ewel, Ecosystems of Florida --An Essential Florida Reference, University
of Central Florida Press, Orlando.1990.
Nelson, Gill, "The Trees of Florida: A Reference and Field Guide," Pineapple Press, Inc., 1994,
xi.
Plotnik, Arthur, "The Urban Tree Book: An Uncommon Filed Guide For City and Town", Three
Rivers Press, NY, 2000, 7-8.
Rouse, J. W., R.H. Haas, J.A.Schell, and D.W. Deering, 1974, "Monitoring Vegetation Systems
in the Great Plains with ERTS," Proceedings, Third Earth Resource Technology Satellite-1
Symposium, Greenbelt-NASA SP-351, 3010-317.
"The South Florida Ecosystem", 2-10, Retrieved May 20, 2001,
http://southeast.fws.gov/vbpdfs/ts.pdf
Southwest Florida Regional Planning Council Strategic Regional Policy Plan, Fort Myers,
Florida,1995.
Authors
Victoria Morrow, Senior Planner-GIS
Broward County Government
Department of Planning and Environmental Protection
Planning Services Division
115 S. Andrews Avenue, Room 329K
Fort Lauderdale, Florida 33301
Telephone: (954) 357-6618
Fax Number: 357-8655
E-mail Address: vmorrow@broward.org
Jill Young, Associate Planner-GIS
Broward County Government
Department of Planning and Environmental Protection
Development Management Division
115 S. Andrews Avenue, Room A240
Fort Lauderdale, Florida 33301
Telephone: (954) 357-6625
Fax Number: 357-6521
E-mail Address: jiyoung@broward.org
Dr. Charles Robert, Professor of Geography
Florida Atlantic University
E-mail Address: crobert@fau.edu