Analyzing Sonic Boom Footprints of Military Jets
Author
Andy S. Rogers, Senior Analyst, AOT, Inc.
Testing and training exercises involving supersonic U.S.military
aircraft can produce sonic booms. By using ArcView and PCBoom3, the
U.S. Air Force's sonic boom modeling tool, the effects of sonic booms
in a particular environment can be studied. We have currently partially
integrated PCBoom into ArcView, with a view to full integration of sonic
boom modeling into a GIS to follow. The current implementation allows
users to ingest either actual flight data or design flights. Using real
flight data helps review past supersonic impacts. Creating model flights
allows the user to predict future impacts, and determine how they may be
reduced. Using this modeling capability, coupled with ground reference
data, we are performing a parametric study that will be the basis for an
interactive flight planning tool.
Analyzing Sonic Boom Footprints of Military Jets with GIS
Background
Sonic booms generated by high-performance aircraft are a source of noise for communities near supersonic flight corridors and the Navy and Air Force are often required to expend money and manpower to deal with damage claims. The purpose of this study is to facilitate understanding of sonic boom phenomena and the development of possible alternative flight patterns to reduce sonic boom impacts to a community near a military installation where supersonic jets are flown. This must be done without jeopardizing pilot safety or constraining research, development, testing and evaluation (RDT&E) or training exercises.
To respond proactively to these issues, the Navy has decided to undertake various measures to help understand and predict the effects of its supersonic operations. The goals of this parametric study project are to show how changes in various flight parameters, weather parameters and geographic parameters affect the impacts of supersonic operations. The results of this study should be useful in flight planning to reduce sonic boom impacts.
The general method is to use PCBoom to calculate sonic boom footprints for model flights that are based on actual operations at Naval Air Station Patuxent River (NAS PAX). These model flights have been altered by varying the altitudes, flight path angles (FPA), weather conditions and other parameters listed below. Each model footprint is then converted to a GIS format and displayed in ArcView to make visual comparisons possible.
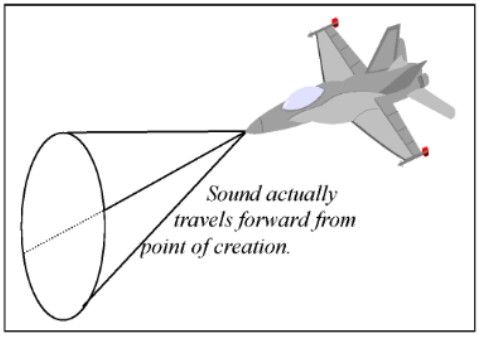
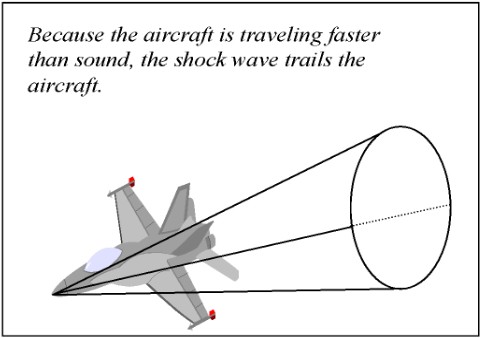
1.1 Sonic Booms: A Brief Primer
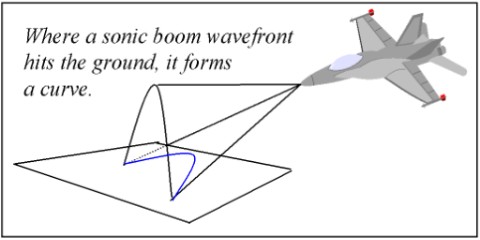
All objects moving through the air create pressure waves as the air in front of them is compressed. Sonic booms are generated when an aircraft moves faster than the speed of sound and begins to outrun its own bow pressure wave. This creates a shock wave that spreads forward from the point of its creation (Figure 1). Because the aircraft that created the shock wave is moving faster than the speed of sound in air, the wave will appear, to trail the aircraft (Figure 2). The cone formed by waves trailing the aircraft is called the Mach cone. The boom is formed where there are major pressure points, which generally correspond to the front and tail sections of an aircraft. The boom generally has two spikes with a drop in pressure between them forming an N-wave (Figure 3). For military aircraft of the size of an F/A-18 E/F, the time between these two peaks is about 1/10 of a second, too short for the ear to detect. However, for the Space Shuttles, which are 122 feet long, the two spikes are about ˝ second apart and are heard as two distinct booms. Under other circumstances a "u" shaped wave is formed (Figure 3).
The sonic boom heard on the ground is only one portion of a circular shockwave (Figure 4). This type of boom is referred to as a "carpet boom". It spreads broadly across the surface beneath the aircraft. In general, the carpet will be one mile wide for every thousand feet of altitude of the aircraft. Therefore, a carpet boom generated at 50,000 feet above ground level will be approximately 50 miles wide. It is important to remember that, as shown in Figure 4, the boom always strikes the ground forward of the point at which it is created.
The strength of the sonic boom is affected by various factors
including the size and weight of the aircraft, speed, altitude,
angle of attack, and atmospheric effects. Maneuvers also affect
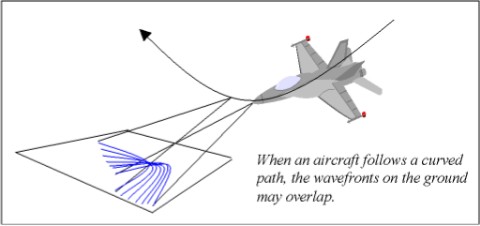
the strength of a boom. Any change in the aircraft's velocity
can either focus or diffuse the boom. This includes acceleration,
deceleration, changing flight path angle (FPA), or heading.
In general, lifting the nose of the aircraft will diffuse a boom,
dropping the nose will focus it. Acceleration will focus the boom,
deceleration will weaken it. Any change in horizontal direction will
focus the boom along a track to the outside of the flight path. A
focused boom (Figure 5) occurs when two or more wavefronts, originating
at different times from the aircraft, coincide exactly.
Sonic booms are simply a rapid change in air pressure, and booms
normally heard are about the same change in air pressure as experienced
in traveling a few floors in an elevator. Modern supersonic aircraft
in normal operating conditions generate peak overpressures varying
from less than one pound to about 10 pounds per square foot for a
carpet boom. Focused booms may have peak overpressures two to five
times as large. Areas of focused booms are typically very small areas
when compared to the area exposed to the rest of the sonic boom.
Sonic booms are measured in pounds per square foot of overpressure
(psf). Overpressure is the increase over normal atmospheric pressure
(2,116 psf). One pound of overpressure would not be expected to produce
damage to structures. Sonic booms may cause minor damage such as
shattered glass but structurally sound buildings should not suffer
damages from overpressures less than 16 psf. Sonic boom exposure to
communities typically does not exceed two psf. Some public reaction
could be expected between 1.5 and 2 pounds. Rare minor damage may occur
with 2 to 5 pounds overpressure. The strongest sonic boom ever recorded
was 144 pounds per square foot and it did not cause injury to the
researchers who were exposed. The boom was produced by an F-4 flying
just above the speed of sound, at an altitude of 100 feet.
Sonic boom energy is concentrated in the 0.1 to 100 Hz frequency range
and duration typically are about 500 milliseconds, varying on the size
of the aircraft.
1.2 An Introduction to PCBoom
PCBoom is a single-event sonic boom prediction tool designed to meet the
sonic boom prediction needs of the USAF. This model uses full ray tracing
propagation theory and includes the effects of aircraft maneuvers,
non-standard atmospheric profiles, and winds. Calculations include
focused superbooms when they occur. Input parameters are flexible to
allow general supersonic maneuvers. The program accepts user-defined F
functions, and has F functions built in for current USAF aircraft. The
model predicts the location and waveforms of sonic booms on the ground.
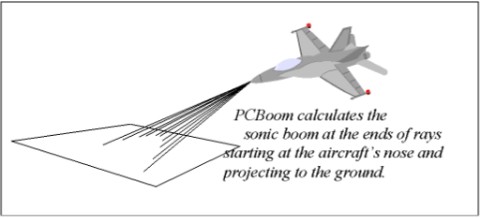
PCBoom actually calculates the sonic boom along rays, thereby generating a
set of points on the ground where the rays intersect the ground surface.
The points are organized by time step (when a given wave originates at
the aircraft) and angular distance around the ray cone. We have bypassed
PCBoom's display module and directly display the points the model
calculates using a GIS package (Figure 6) rather than using the contour
lines produced by PCBoom. PCBoom assumes homogeneity in both horizontal
dimensions for both the atmosphere and the ground surface. We have begun
to test it in the Chesapeake Bay area, and it has been tested over land
before.
1.2.1 Models in PCBoom
PCBoom3 requires several inputs to calculate a sonic boom model. These
include an aircraft model, a maneuver, an atmospheric model, and ground
surface height.
1.2.2 Aircraft Models
PCBoom comes pre-loaded with several aircraft models. Among these are
an F-14, an F/A-18 C, and generic models designated as "fixed-wing
fighter", "large fighter", and various others. Because the
F/A-18 E/F is not included in the listed models we used (REF Downing, pers.comm,
2/16) the "fixed wing fighter" choice under "user defined"
on the aircraft menu, and entered the values for length and weight of the
aircraft. This model was also recommended for the F-15, F16 and JSF.
1.2.3 Maneuver Modeling.
PCBoom does not provide the means of creating maneuver models. They
were created using Excel spreadsheets and fitted to PCBoom input
specifications using a separate program packaged with PCBoom (traj2trj).
Maneuvers in this project are designed based on desired g-force in the
turns, maximum allowable g-forces in acceleration, deceleration and
turns, rate of g onset, and other requirements of the flight. For
instance, weapons separation flights are designed to be performed at
45-degree and 60-degree flight path angles (FPA) . The FPA is the
angular separation between the flight path and the horizontal and is
negative when the aircraft is diving.
1.2.3.1 Creating Maneuver Models
Maneuver models were created using Excel spreadsheets. Model inputs
include aircraft type, maximum Mach, minimum Mach, the time for
acceleration and deceleration, starting position (x,y,z), heading, upper
and lower altitude bounds and maximum rates of change of FPA and heading. The data form also provides checks on the g-forces and other factors as required. A flight model can be fitted to actual requirements by defining the total g from acceleration and maneuvering, and adjusting the left-hand parameters until the g's have the desired values.
1.2.3.2 Atmospheric Modeling
PCBoom has its own interface for entering atmospheric models. However,
this requires individually typing every value. Atmospheric models in
this work were created using an Excel spreadsheet in which the
atmospheric data could be cut and pasted. Due to the stringent input
requirements of PCBoom, any error in the format of this file, including
extraneous spaces and other unidentifiable errors can cause PCBoom to
fail with unintelligible errors. Worse still, certain errors allow
PCBoom to appear to operate correctly while producing data that is
seriously in error. This happens most noticeably when there is no wind
in the profile, but PCBoom produces footprints that are skewed as though
there is a wind. To eliminate these errors, the atmospheric models had
to be slightly hand-edited.
1.3 ArcView Adaptations
The technological task here is to integrate a variety of spatial and
non-spatial data, in different formats, and the means for creating them
into a relatively simple-to-use package. This work so far has been developmental in that it demonstrates the possibility of good integration and incorporates some integration. To make the system work, we used ArcView 3.2's GUI as the integration tool. This was done by adding buttons that initiate Excel spreadsheets and the PCBoom program. The native interfaces for these programs were used to enter data into them. Eventually, this will be mostly automated so that the data flows from one program to another without the user having to use all the interfaces.
PCBoom puts its data out in contour lines. However, there are issues
with these lines, besides the fact that they cross, they must be
converted into another mapping program's format and then to shapefiles
before they can be imported into ArcView. This causes a loss of data and
a lot of work. We altered PCBoom to write out the points it calculates
for the ends of the rays with latitude, longitude and several key
attributes. The data can be directly imported into ArcView using tables
and then made into an "event theme". The flight tracks are also generated
as a series of points with latitude and longitude and other attributes,
which can similarly be imported into ArcView.
1.4 Parameters
To perform this study, it is necessary to identify the parameters that
affect the intensity, placement or dispersion of the sonic boom. These
parameters are broken up into three general categories - flight
characteristics, atmospheric characteristics and geographic
characteristics. These are discussed in the following sections.
2 Flight Characteristics
Flight characteristics are determined by the test or training exercise
being flown, existing laws, controlled airspaces and standard operating
procedures (SOP). Therefore, to a certain degree, these elements are
inflexible. However, it is essential to this study that all flight
parameters be tested over a wide range of values to determine what
impact, if any, changes in the flight parameters have on the sonic boom
footprint. Flight characteristics include flight path angle (FPA), Mach,
Angle of Attack (AOA), thrust, g, altitude, and aircraft type, which
affects aircraft parameters such as length, thrust, weight and other
characteristics. Supersonic aircraft fly under varying conditions of
Mach, altitude, and g's pulled in a turn. Some of these characteristics,
along with different aircraft types are examined in this section.
2.1 Aircraft Type
The principal supersonic aircraft examined here is the F/A-18 E/F. The
T-38 and F-14 are also examined briefly. The aircraft type has a
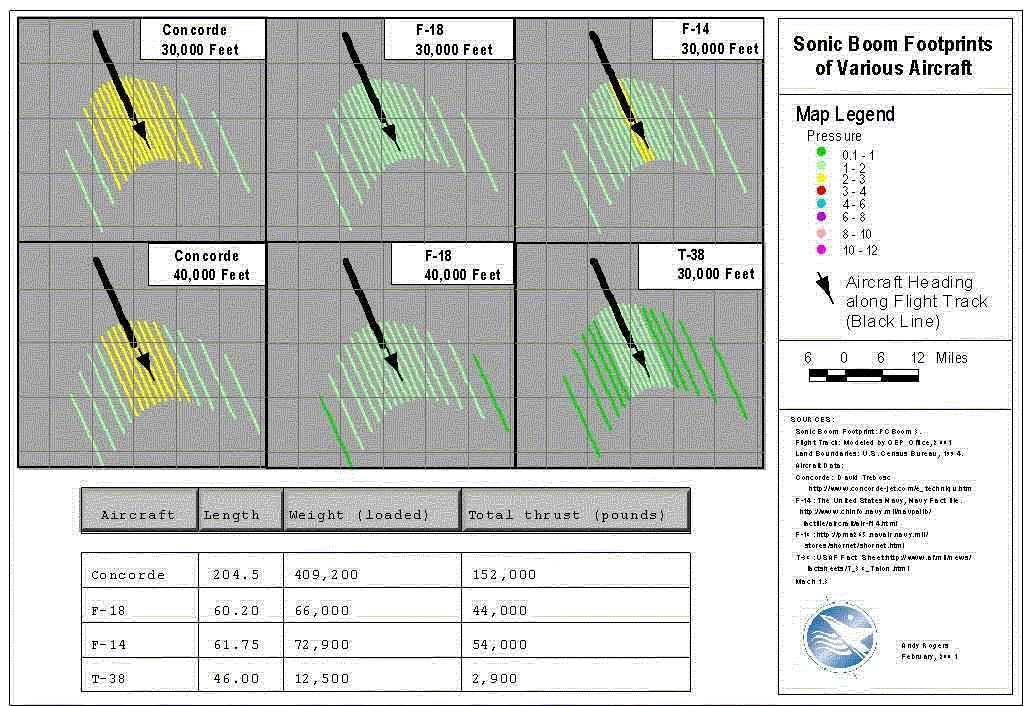
significant impact on the sonic boom. Size is a major factor, as can
be seen in the tables in Figure 7. The Concorde, included here just
for reference, makes a huge boom at 30,000 feet compared to any aircraft
used at NAS PAX. At 40,000 feet, it is still louder than the small
military jets. The T-38, on the other hand, makes a barely noticeable
boom, not exceeding one psf even directly under the flight path.
2.2 Mach Number
Mach is the speed of sound in a given medium. Maximum Mach is used as a
parameter, because both the Mach and the acceleration required to
achieve a given Mach number effect the sonic boom. The effect of Mach
number on the footprint is subtler). Neither aircraft at 1.1 Mach is
predicted to make an audible boom. At Mach 1.2 or above the F/A-18 E/F
produces a boom of approximately two psf. The strength of this boom does
not increase, as was expected. However, the width of the carpet expands,
achieving a level of 1-2 psf up to 8 miles off the flight track. The
T-38 boom footprints are similar, although because the aircraft is
smaller, the boom is weaker.
2.3 Altitude
Regulations stipulate that all supersonic flights in the CTR occur at
or above 30,000 feet except when the test specifications require a lower
altitude. This occurs primarily when supersonic weapons separation
testing is occurring.
The sonic boom strength is closely related to the altitude (Figure 9).
The shock wave dissipates according to the inverse-square law, which
explains the general shape of the graph (Figure 14).
2.4 Acceleration
There is no accompanying graph to show the impacts of linear acceleration.
However, the Mach number graph) was done at constant speed (just a slice
in time of a total flight) while the altitude graph (Figure 9) shows the
entire supersonic portion of the flight, including the acceleration and
deceleration phase. By comparing these two sets of graphs, it can be seen
that level acceleration causes a focussing of the boom at the back edge
of the boom. At 10,000 feet AGL the F/A-18 E/F's boom reaches 10-12 psf.
There is a portion of the flight in which the psf level is constant along
the flight track. When the aircraft decelerates, the boom weakens and
dissipates until it is just a single point at the leading edge (Figure 9).
2.5 Weapons Separations
FPA is calculated as: arcsin(DAltitude/DDist) where DAltitude is the
change in altitude and DDist is the total distance traveled in space.
Weapons separations are complex maneuvers done in two patterns for
testing purposes. In one, the aircraft delivers the weapon while at an
FPA of 60 degrees, in the other, the weapon is delivered in a 45-degree
dive. For 45-degree FPA, the pilot typically rolls in at about 35,000
feet and 0.97 Mach. He will roll inverted, pull 3 g's for approximately 3
seconds to get to -45 FPA and then right the aircraft again. He should
reach the target release speed at approximately 30,000 feet and hold that
speed until the release point at approximately 18,000 feet. He then slows
and pulls out. The expected tolerances on this are about +- ten knots on
the airspeed, +- 0.02 Mach, + 0.1 g, - 0.2 g, +- 5 degrees on the FPA, +
1,000 feet for the release altitude, +-2 degrees for the heading. The
flights are modeled primarily as variable FPA flights in this section.
Because changing the FPA requires changes in other variables as well,
the altitude of achieving maximum Mach was held constant and the pull
out altitude was held constant. This required changes in the starting
altitude and changes to the rate of change of FPA to achieve the minimum
altitude. Starting altitudes ranged from 37,5000 to 42,000 feet. The
flight path used is an actual test flight performed on 11/1/2000, which
was digitally smoothed and straightened. The standard procedure is to
recover back to subsonic speed by pulling g's in a change of FPA from
descending to ascending.
Changes in the flight path angle have a complex impact on the sonic
boom footprint because they necessarily involve changes in the altitude
of the maneuvers. However, as the FPA increases, the forward throw
decreases ( Figure 10). This shifts the impact by shifting the whole
footprint back along the flight track. The steeper angle also reduces
the spread. Changes in the recovery portion of the flight are quite
distinct between the 45-degree dive and the 60-degree dive. For the
45-degree FPA, there is no difference between the three footprints.
For the 60 degree FPA, there is a huge difference, but only if the
aircraft stays in the dive until it has become subsonic. However, in
this particular scenario, it puts the aircraft down to 5,000 feet AGL.
3 Atmospheric Characteristics
3.1 Background
Atmospheric temperature and wind profiles affect the way sound is transmitted through the atmosphere. Strong temperature gradients and inversion layers contribute to the scattering of sonic booms and wind can move and alter the shape of the footprint. The angle between the wind and aircraft flight path will also affect the shape and location of the footprint. All of these factors change seasonally.
The temperature of the atmosphere changes with altitude. In a standard atmosphere the temperature decreases with increasing altitude within the altitudes of interest to this study. Occasionally, there are temperature inversions, where the temperature increases with increasing altitude. To understand the changes in the sonic boom footprints it is necessary to understand what happens to a sound wave as it moves through the air. The speed of sound is temperature dependent. A sound wave is refracted as it passes through various temperature regimes. Sound travels more slowly in the cooler atmosphere and the sound speed drops as the sound passes through an inversion layer.
Wind also has a major effect on the sound. The wind essentially moves the sound with it as it moves the air. Atmospheric wind profiles for this area show that the wind in this area tends to be from the west, and is virtually never from the east.
3.2 Maneuvers with Atmospheric Effects
The only maneuvers modeled in this section are straight, level flights. The variables are the atmosphere and the angular separation between the prevailing wind and the aircraft's heading.
3.3 Atmospheric Temperature Profiles
The footprints in Figure 11 are arranged so that the altitude and strength of the inversion layer increase from top to bottom and the temperature at the ground increases from upper left to lower right. These are real atmospheric profiles, so the progression is not perfect. Close examination of the atmospheric profiles is necessary to understand the effects seen here. However, the footprints are noticeably larger at the top where the inversions are strongest. One thing is clear from the footprints, different atmospheric conditions cause large changes in the sonic boom footprint.
3.4 Aircraft - Wind Angle Interactions
The interaction of the aircraft's motion and the wind speed also affects the sonic boom footprint (Figure 12). The progression of the nine footprints shows that the wind foreshortens the footprint when the aircraft is headed directly into the wind. As the aircraft heading - wind angle decreases from 180 to 0, the back edge of the footprint is displaced toward the aircraft and the leading edge is displaced downwind. This lengthens the footprint in both directions. The focussing along the back edge of the footprint is stronger when the aircraft has a tail wind. Due to the spreading caused by the wind, the rest of the boom footprint loses intensity when the aircraft is flying in the same direction as the wind blowing.
4 Geographic Characteristics
Ultimately, understanding how all these factors affect the sonic boom is only of interest when it can be used to determine how sonic booms will affect the population in the range area. With the understanding of the other factors listed above, the key geographic aspects of a flight are the location and heading of the flight.
4.1.1 Functional Check Flights
Functional Check Flights (FCF's) shown here are derived from actual FCF's flown in the CTR. The data available for these flights comprises start and end positions in three dimensions and maximum Mach, so a number assumptions were necessary. It is assumed that the reported starting and ending locations were given when the aircraft accelerated from subsonic to transonic (i.e., reached Mach 1) or decelerated from transonic to subsonic. Appropriate time for acceleration was allowed to achieve the maximum Mach. For the F/A-18 E/F approximately 0.2 g maximum acceleration was used; for the T-38 a maximum acceleration of 0.1 g was assumed.
Error! Reference source not found. are actual flights. The two panels beneath each actual flight represent possible alterations that could have been made to reduce sonic boom impacts on the ground. The sonic booms from the two F/A-18 flights Error! Reference source not found.) are affected by rotating the flight path with respect to the wind and by changing the altitudes. Raising the altitudes seems to have the effect mainly of spreading the boom. Changing the aircraft heading and flight location does impact where the boom lands. However, for the T-38, when the altitude is raised, or when the aircraft is turned straight into the wind, the boom disappears altogether.
5 Conclusion
It has been the commonly accepted wisdom that T-38's flying above 30,000 feet do not make an audible sonic boom on the ground. The models shown here demonstrate that that is not always true. These results also show which parameters can be altered to minimize sonic boom impacts and which parameters are of little value.
Acknowledgments:
Efforts have been made to include input from a variety of stakeholders such as range safety, NAS Patuxent River Meteorology and Oceanography (METOC) Detachment, Naval STRIKE Aircraft Test Squadron (Strike), and the U.S. Naval Test Pilot School (TPS). By including their input we have captured the types of operations done at NAS PAX to use as the basis for flight models.