Patti Akers, MA; Alan Smith, MPH, PhD (C); Clint Garrison, MA; Leslie Upledger Ray, MA, MPPA; Patricia Murrin, RN, MPH
This presentation will look at the correlation between location and severe self-inflicted injury and death due to suicide in San Diego County. This will be a practical overview of integrating health data with GIS technology. Data will be abstracted from the San Diego County Trauma Registry and Medical Examiner's Data. Maps will include rates of severe injury and death by San Diego County communities by mechanism of injury: gunshot, stabbing, jumps and other traumatic self-inflicted injuries. This presentation will also include general demographic characteristics of the population. The purpose of this study is to identify high-risk areas and/or populations.
Nationwide, suicide accounts for 21% of all injury deaths. Suicide claimed the lives of 30,575 Americans in 1998 (11.3 per 100,000 population). Suicide accounts for more deaths than homicide. In 1998, there were 1.7 times as many suicides as homicides (CDC). San Diego’s rate was slightly higher than the national average (11.38).
Eight years of data were abstracted from the San Diego County Trauma Registry and Medical Examiner’s Database and analyzed to determine who was at highest risk of severe injury or death due to violence (fiscal years 91/92 – 98/99). Factors analyzed include type of traumatic suicide and victim demographics. Annual rates were calculated per 100,000 population. Injuries include severe injuries only; victim must have been considered a trauma patient to be included. San Diego County Emergency Medical Services receives a Trauma Registry for every trauma patient admitted to any of the designated trauma center hospitals who meets one or more of the following criteria (MTOS Modified Major Trauma Outcome Study):
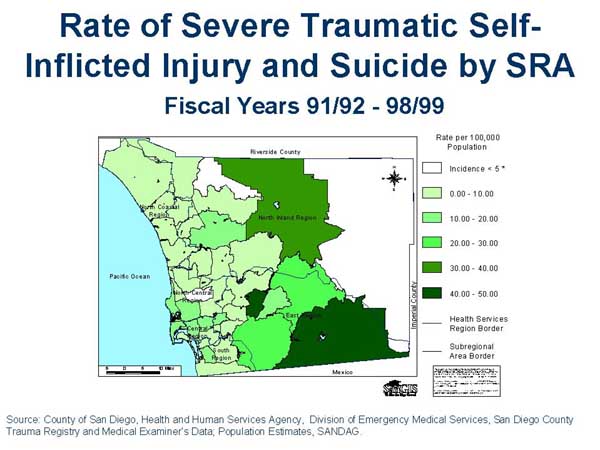
Maps were created for each of the injury types by Subregional Area (SRA, aggregations of census tracts based on community boundaries) to aid determining populations at risk. Population density maps were also created for comparison. The maps were created using ArcView 3.1. These choropleth maps showed rates of severe injury and death for each SRA, a .dbf file was created in which the rate for each area was assigned to the corresponding code. This database file was then incorporated into the ArcView program and linked by SRA to the shapefile (layer) for that SRA using the "join" command. Rates were grouped into categories representing equal value intervals, and the category for each area was plotted with a representative color scheme.
Traumatic self-inflicted injury was defined as self-inflicted injuries and suicides due to cut/pierce wounds, jumps, firearm and other traumatic self-inflicted injuries. Traumatic injuries do not include drowning, poisoning or suffocation. To calculate annualized rates, the population estimates for each of the eight years were added together to create the population. This population was then divided by the number of incidents and multiplied by 100,000 to get the rate per 100,000 per year. This process was done so rates would be comparable to other counties, states and the U.S. as a whole.
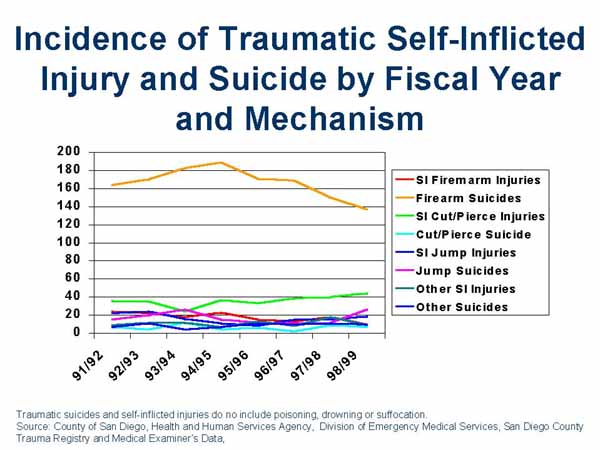
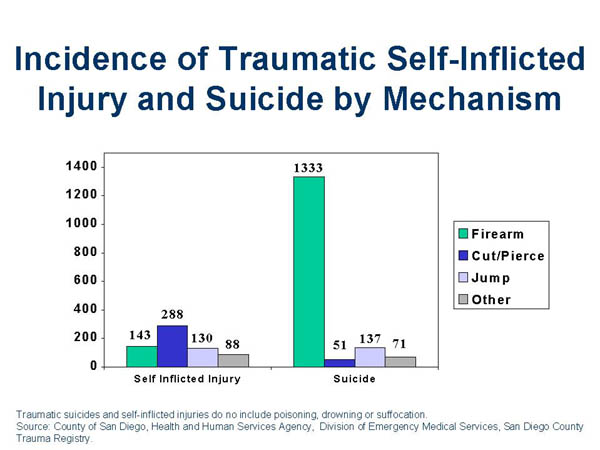
During the past eight years there were 649 severe injuries and 1,592 deaths due to traumatic self-inflicted injuries in San Diego County. Severe injuries declined 10% and deaths due to self-inflicted traumatic injuries declined 7% during the last eight years. The majority of injuries were to males (83%). Firearm suicides were the leading cause of traumatic self-inflicted severe injury and death (1,476), followed by cut/pierce (339), jump (267) and other mechanism (159).
Twenty-three percent of those severely injured or killed were between the ages of 25 and 34. Another 20% were between the ages of 35-44 and 12% were aged 45-54. During the past eight years, the age groups with the highest incidence of severe injury/death were 25-34 year olds, however those with the highest rate were those over the age of 74 (19.85 /100,000 population). While Whites accounted for 62% of the population, they accounted for 75% of self-inflicted injuries and suicides, with a rate of 12.58. While making up 23% of our population Hispanics accounted for only 12% of severe self-inflicted injuries and suicide (5.56/100,000 population).
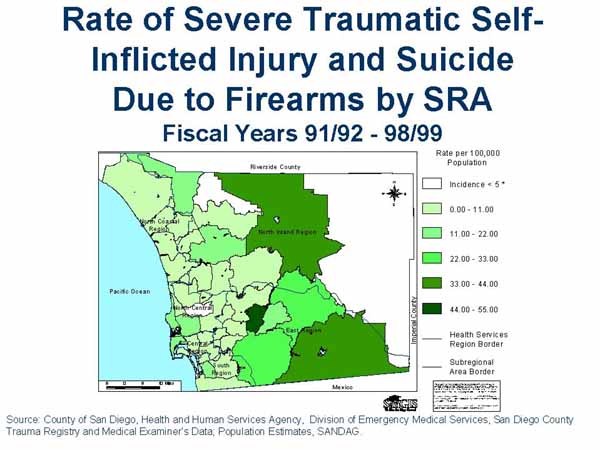
Firearm: The incidence of severe injury and death due to self-inflicted firearms injuries have decreased during the past eight years. The SRAs with the highest rates of self-inflicted injuries and suicide due to firearms were Harbison/Crest, Mt. Empire and Palomar/Julian. These three regions are located in the East County and are some of the more rural areas in San Diego. These rates must be viewed with caution due to low number of incidents.
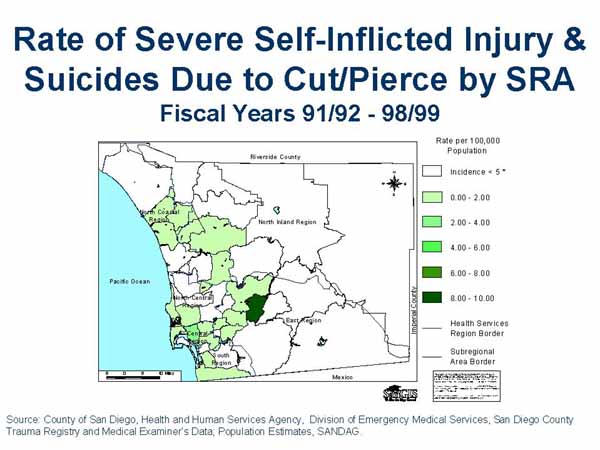
Cut/Pierce: Severe self-inflicted injuries sue to cut/pierce have been increasing over the past eight years but the number of suicides has remained about the same. The SRAs with the highest rates of firearm injuries were Harbison/Crest, Central, and Mid City. It was important to note that while Harbison/Crest had the highest rate it also had a very low population. There were only 7 incidents of self-inflicted injury and suicide during the past eight years compared to 30 in Central and 24 in Mid City SRAs. If this study included only data for the last four years Harbison/Crest would not have had a rate calculated for it due to its low incidence (rates are not calculated for incidence less than five due to instability).
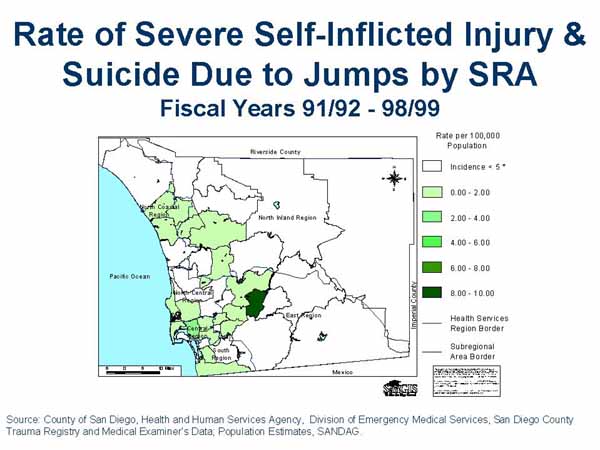
Jump: The incidence of self-inflicted jumps resulting in severe injury and death has increased in the past eight years. Unlike the other mechanisms of self-inflicted injury and suicide this occurs mostly in the more densely populated coastal areas. In particular the Central, Coronado and Coastal SRAs are the most highly effected due to their proximity to the Coronado Bridge.
The number of people severely injured or killed due to self-inflicted injury has declined in the last eight years. By examining the area geographically (at the level of SRA) it is possible to identify areas of greatest risk. Looking at the data over time (eight years) the areas of greatest risk remain the same but the rates do decrease. The areas with the lowest population density have the greatest number of self-inflicted injuries and suicides. This is consistent with current knowledge that geographic isolation is a risk factor in suicide.
We would like to thank the San Diego County Paramedics/EMTs, Prehospital Agencies, Hospitals, Trauma Centers, Medical Examiner’s Office and SANDAG (San Diego Association for Governments) for their data collection efforts and contribution to this research.
The San Diego County Trauma Centers are:
CDC – www.cdc.gov, WISQARS – Web Based Injury Statistics Query and Reporting System.
Patti Akers, Biostatistician, email pakershe@co.san-diego.ca.us
County of San Diego, Health and Human Services Agency, Division of Emergency Medical Services, 6255 Mission Gorge Rd, San Diego, CA 92120, phone: 619.285.6429, fax: 619.285.6531