John Williams
Trimble Navigation Ltd
Abstract: In the news recently there has been much activity on the topic of pest control. Africanized honey bees attacking and causing serious injury to humans, crop damage from wheat midges and weevils, diseases affecting both humans and animals from mosquitoes and ticks; these are merely a few examples that illustrate why pest tracking and control is such an important topic. This paper will provide an overview of the combination of GIS and GPS can be used to monitor the activity and spread of pests. Specific case studies will be used.
Vector control districts around the country are tasked with the problem of pest management. The methodology used to control the spread of pests varies depending on the type of pest, severity of infestation, and in some cases, local regulation and policy regarding use of chemicals. Education is also a significant focus of such agencies, showing the public how to recognize a problem, how to limit the spread by reducing or eliminating potential breeding grounds, and when and how to report problems. Using a combination of education, preventative measures, and control techniques, the vector control agencies fulfill their charter of reducing and, better still, eliminating problems caused by pests. To meet this goal requires careful tracking and monitoring of pest incidents.
GIS is an ideal tool for managing data about the nature, location and spread of pests. Allowing storage of vast amounts of data about the type of pest, including reports on where the pest has been spotted and when, provides capabilities for tracking and predictive analysis. This crucial information allows for timely preventative measures to be deployed. GIS can also be used to track the success of such actions, such as monitoring the results of an aerial spraying program. However, to successfully use GIS in pest control, accurate information about the nature and location of the problem must first be collected.
GPS systems provide an ideal solution for collecting such data, as they allow accurate position information to be collected along with necessary descriptive information. GPS-based data collection systems typically allow a data dictionary, or data structure, to be pre-defined. This ensures that the correct information is collected, in a format that is compatible with the GIS database. Some GPS-based systems also allow upload of existing GIS data. This enables the user to accurately navigate back to treatment areas for monitoring and further analysis. Attribute information can be easily updated in the field, with changes automatically logged, to allow for accurate charting of the results of a treatment or preventative program.
GPS systems that are specifically designed for use in GIS data collection provide extensive functionality for recording and monitoring pest activity. Capturing more than just an accurate position, such systems provide the ability to record and store digitally exactly what is going on in the field.
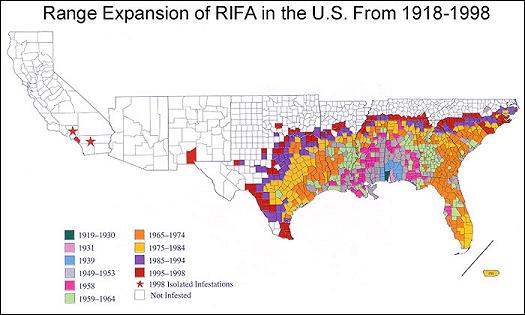
Figure 1: Example of a GIS output showing the spread of Red Imported Fire Ants over time.
With the need to describe exactly the extent of a pest infestation, or document the success of a treatment procedure, digital imagery can provide significant benefits in a GIS database. Pest management professionals have readily adopted GIS technologies to track pest activities, using either paper-based or computer-based systems in the field to collect the necessary information. With the addition of a digital camera to the field toolkit, significant increases in productivity can be realized. Field workers make efficient use of their time at a site: rather than collecting extensive descriptive information, they simply snap pictures providing a clear visual representation of the conditions that exist. Used in conjunction with a GPS system, giving an accurate spatial reference for each picture taken, GIS analysis is significantly more accurate and useful.
Fire ants were accidentally introduced in the United States in the early 1900s. A fire ant sting injects a dose of venom into the victim that causes a burning sensation. A fire ant sting can cause anaphylactic shock, which can result in breathing difficulties, fainting, or even death. These pests are capable of killing newborn animals, including domestic animals and wildlife. In addition, fire ants also cause crop damage, feeding on seedling corn, soybeans and other valuable commodities.
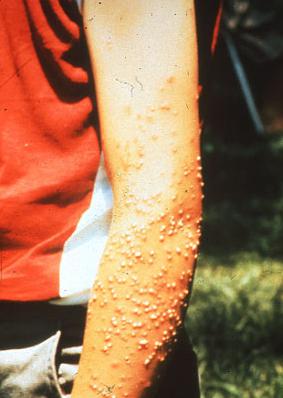
Figure 2: Example of a Red Imported Fire Ant Sting.
First reported in Orange County in 1998, the eradication of fire ants is the sole responsibility of the Orange County Fire Ant Authority (OCFAA), a division of the Orange County Vector Control District. Before purchasing GPS-based systems in 2000, the OCFAA used form-based data collection methods to gather information on fire ant incidents. With 17 dedicated inspectors recording information in the field, the quantity of data to be entered into the GIS database was substantial. The risk of transcription errors, and the delay before data could be used and analyzed in the GIS drove the OCFAA to find a more efficient system. Now with the purchase of a number of Trimble GeoExplorer 3 systems, data is collected digitally from start to finish with a common data structure and with accurate location information recorded automatically. Below is a sample of the data dictionary used in the GPS-based data collection system.
|
Ant Mound: |
|
Site Number |
|
Location Address |
|
Contact Name |
|
Activity Type: Treatment, Survey |
|
Number of Dogs |
|
Other Animals: Cat, Rabbit, Tortoise, Fish, Aardvark, Unknown, None |
|
Sting: Yes, No |
|
Category: Residential, Public, Commercial, Parks, Schools, Golf Course, Natural, Agricultural, Slope, Greenbelt, Other |
|
Habitat: Turf, Planter, Pavement, Structure, Drainage, Exposed Soil, Landscaping, Under Construction |
|
Number of Mounds |
|
Mound Age: No Mound Found, Incipient Colony, Young Colony, Mature Colony, Very Large Colony, Senescent Colony, Mound Eradicated |
|
Field ID: RIFA-Suspect, Southern-Suspect, Harvester, Black Harvester, Argentine, Big-Headed Ant, Other/Non-RIFA |
|
Air Temperature |
|
Soil Temperature |
|
Amdro Amount |
|
Date |
|
Time |
|
Crew Size |
|
Comments |
The field-collected data is output to a county-wide vector control database, where all insect and pest problems are recorded. In addition the data is output to Esri's ArcView GIS for analysis, including monitoring of treatment sites over time and creating maps for public reporting purposes.
Using a combination of GPS field data collection techniques and GIS tools, the OCFAA has improved turnaround time on reporting, and reduced operating costs. Field worker's time is used more productively, as they are able to visit more sites in a day. And accurate position information allows easy relocation of treatment sites for re-inspection and monitoring.
The use of GPS and GIS technologies has had considerable impact on pest management authorities. Allowing information on pest activities to be collected, stored, manipulated and analyzed enables accurate monitoring of pest activities, so appropriate preventative measures can be taken in a timely manner. Financial savings are realized, as spraying and poisoning methods can be used more wisely and efficiently. And public safety issues are addressed as the spread of pests can be more accurately predicted, and controlled.
John Williams
Northwest Region Sales - Mapping & GIS Systems
Trimble Navigation Ltd
3400 188th Street SW, Suite 651
Lynnwood, WA 98037
USA
Phone: (425) 672-8070
Fax: (425) 774-6665
Email: john_williams@trimble.com