ABSTRACT: The following paper describes how GIS was used to help coordinate water quality monitoring efforts in the Salton Sea watershed (California). The project is focused on the assessment of an extensive range of water quality monitoring activities to evaluate the past and current status of data collection, and to determine the potential for future collaboration among the various agencies and organizations involved. The paper explores the integration of the water quality monitoring information and how it can be used to facilitate the 'institutionalization' of the different watershed activities.
KEY TERMS: Water Quality Monitoring, Geographic Information Systems (GIS), Watershed Coordination.
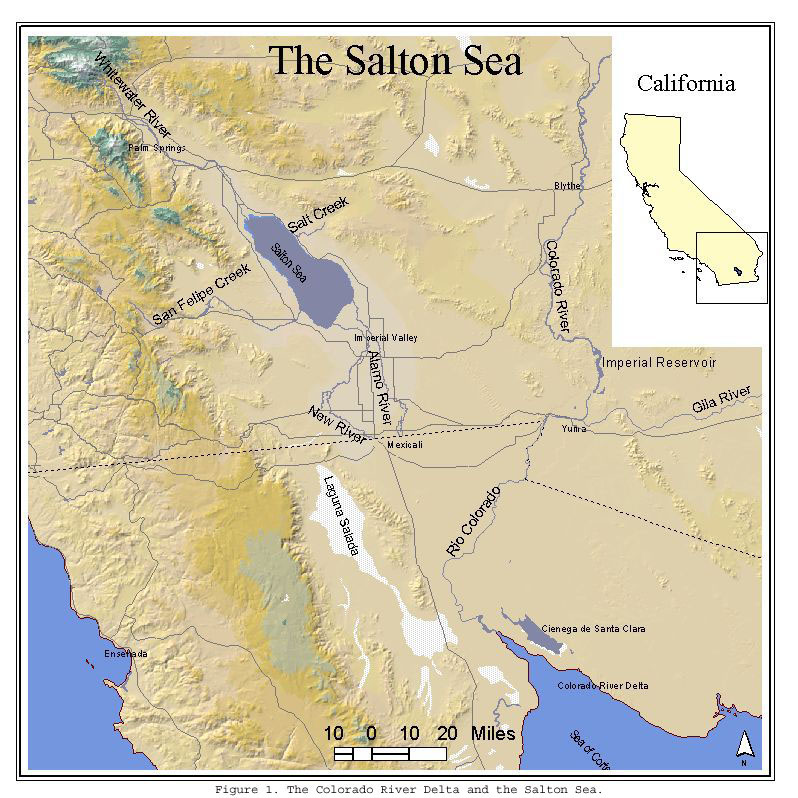
The Redlands Institute is a program at the University of Redlands dedicated to the application of Geographic Information Systems (GIS), remote-sensed imagery, and database and Internet technologies toward environmental problem solving. One of the Institute's current projects is the Salton Sea Database Program (SSDP), a $4.5 million congressionally funded project to facilitate the evaluation of restoration alternatives for the Salton Sea. The latter is California's largest lake, located in a closed basin approximately 35 miles north of the U.S.-Mexico border in one of the most arid regions in North America (Figure 1). The Sea represents a significant stopover for several million birds on the Pacific Flyway ? an international water-bird ecosystem ? and is presently threatened by increasing salinity and hyper-eutrophic conditions.
One of the SSDP's present projects is the support of coordinating water quality monitoring efforts in the Salton Sea watershed to improve the understanding of physical and chemical processes related to water quality and its effects on the Salton Sea ecosystem. While there are and have been a wide variety of water quality monitoring efforts undertaken in the Salton Sea Basin, it is generally recognized that the level of coordination among agencies, institutions and other stakeholders is not as high as it could be, and that significant mutual benefit and synergy might be achieved if it were. In July 2000, members of various agencies and organizations concurred that a good first step towards understanding the situation would be to create an inventory and characterization of existing water quality monitoring efforts, and to assess the opportunities and constraints of better coordination and information sharing. It was also recognized that increased collaboration and sharing of water quality data within the basin could increase the availability and quality of information needed to support scientific exploration.
The SSDP - in collaboration with the Regional Water Quality Control Board (RWQCB), Region 7 - conducted an initial Water Quality Monitoring Inventory as the first step in exploring the potential for collaboration and data sharing within the Salton Basin. This inventory was designed to identify the organizations most active in water quality monitoring in the area, locate and characterize their major programs in a standard form, synthesize the information from the interviews, and review the inventory and synthesis results with the participants in a workshop format. The inventory involved 18 organizations that have conducted, are conducting, or plan to conduct 76 separate water quality monitoring programs or activities within the Basin. Information collected during the inventory was ultimately entered into a database that was utilized to analyze and display information as matrices, summary charts, and maps.
The inventory process included the following general steps:
- Prepare inventory form
- Conduct interviews
- Synthesize interview information
- Conduct review workshop
- Develop plan of action
In a first step, the RWQCB and the SSDP compiled a form to record existing water quality data collection activities within the Salton Sea watershed. As part of this effort, the SSDP explored several national and regional water quality monitoring projects in which certain content and structure standards for data topics have already been identified, representing a basic framework for this type of monitoring inventory. For example, the National Water Quality Monitoring Council (NWQCMC) and the Methods and Data Comparability Board (MDCB) provide a framework for comparing, evaluating, and promoting monitoring approaches that can be implemented in all appropriate water quality monitoring programs nationwide. These established programs offered a valuable insight as to how the water quality monitoring programs within the Salton Sea watershed can be described and classified in a form that can be easily analyzed to identify areas of common need and benefit.
In a second step, SSDP staff began conducting interviews with the different members of agencies and organizations engaged in water quality monitoring activities. An interview checklist was put together to provide a basic framework for discussion, and to allow consistent information assessment across various scientific teams, agencies, and organizations. The interview checklist was composed of several water quality data elements derived and based upon the MDCB core data element suggestions. Information from interviews was compiled to a common form, and provided back to interviewees for review and refinement.
The following basic information needs were addressed in the interviews:
WHO - is/was doing sampling and/or has water quality data?
WHAT - is/was the nature of their sampling/composition of their data sets? WHAT are the findings?
WHEN - are/were the samples taken and what is the longevity of the data set?
WHERE - are/were the samples taken (geographic) and from what substrates?
WHY - are/were the samples taken (purpose)?
HOW - are/were the samples taken (methods, frequency, etc.) and what is the validity of the findings?
Each interview was documented in a narrative write-up that describes the administrative context of each organization, identifies and describes each water quality monitoring program or activity, and articulates the opportunities and constraints to cooperative data sharing, from the perspective of each interviewee. The product developed is a concise visual display of who is doing what, when, where, why, and how. The product is supplemented by written and tabular information as needed to understand common needs and opportunities for future coordination and efficiencies, and to identify opportunities/constraints that would support more collaboration and data sharing (the final report and matrices are downloadable at:
http://cem.uor.edu/pub/huynen/wq/index.htm).
The third step involved evaluation and synthesis of information collected during the interviews. This included the assessment of three major categories, including: 1) Organization; 2) Program; and 3) Data. The synthesis also incorporated the compilation of a "metadata" database in which each monitoring program was described according to various national and international standards. The metadata database was subsequently linked with a GIS database, indicating and displaying the monitoring locations in a visual and geographic manner. The water quality information compiled and displayed in this visual format revealed areas of considerable overlap in monitoring efforts, allowing the participants to grasp the extent of potential for collaboration and data sharing opportunities.
This inventory provides a fundamental basis for discussion and dialogue regarding water quality monitoring coordination in the Salton Sea watershed. As a result, the participants of this study convened in early February 2001 to review the inventory and discuss future steps toward water quality monitoring coordination. Displaying the synthesized information through this graphic approach and demonstrating various data collection scenarios allowed the group to identify and express immediate opportunities and constraints for future collaboration efforts. A number of workshop participants recognized the need to focus on various topics such as: developing standard sampling and analysis methods, geo-referencing data collection activities with state-of-the art technology, identifying key sampling areas and framework data, developing integrated environmental modeling applications, and designing an information infrastructure to support data sharing and cross-agency interaction. The tasks will be addressed in the future by specific working groups that update the 'water quality forum' with respect to the ongoing projects on a periodic basis.
The water quality coordination effort represents an illustrative example of how the SSDP applies the promotion and support of regional information sharing and collaboration. Over the past three years, the SSDP has served as a clearinghouse of information concerning the Salton Sea and its environs. In addition to serving as a data repository and dissemination body, the SSDP has assisted various agencies and stakeholder groups in the effective application of GIS technology and related information technologies through a variety of applications, including requirements analysis, technology research, systems design, spatial analysis, visualization and other activities. The SSDP has also worked with several agencies and stakeholder groups to apply geographic and information science principles and practices to enhance information collection, dissemination, management and application.
For more information visit our website at:
or contact us at:
tel: (909) 335-5268
fax: (909) 307-6952
Environmental Protection Agency. (1997, August 5). Water quality standards; Establishment of numeric criteria for priority toxic pollutants for the State of California; Proposed Rule. 40 CFR Part 131. Federal Register, 62 (150) 42160-42208.
Environmental Systems Research Institute, Inc. (1995, June). Washoe County Regional Water Management Planning Series: Planning System Database Design.
FWQA. (1970). Salton Sea, California. Water quality and ecological management considerations. U.S. Department of the Interior, Federal Water Quality Administration, Pacific Southwest Region.
McGinnis, M. V., Wooley, J. T. (2000, May). Changing California from wastesheds to healthy watersheds: A characterization of California watershed organizations and activitites. Marine Science Institute, University of California, Santa Barbara.
Marshack, J. D. A Compilation of water quality goals. (2000, August). California Environmental Protection Agency, Regional Water Quality Control Board, Central Valley Region. Available online: http://www.swrcb.ca.gov/rwqcb5/wq_goals/index.html
NOS Florida Keys Ecosystem Integration Team, National Ocean Service. 1995, November). Florida Keys Ecosystem Integration Project: Establishing NOS Priorities. Florida.
Rasmussen, D. (1995, September). Toxic substance monitoring program (TSMP): Fresh water bioaccumulation monitoring program: Data base description. State Water Resources Control Board, California Environmental Protection Agency.
State Water Resources Control Board, California Regional Water Quality Control Board, Colorado River Basin Region. (1993). Water quality control plan: Colorado River Basin Region. Indio, Ca.