Introduction
This report documents the progress and results of a project made possible through BATC's Viticulture Internal Research and Development (IRAD) program. The focus of the report is on the use of the Geographic Information System (GIS) package ArcInfoÒ to create a deliverable product.
In October 1999 the Ball Systems Engineering Services (BSES) office in Sacramento flew a Compact Airborne Spectrographic Imager (CASI 2) to collect hyperspectral data of the Hanna Vineyards in Napa, California. The data collected was used to create five single band images. Each image was the result of a different test that displayed plant health, age, or vigor. The five tests used were Normalized Difference Vegetation Index (NDVI), Slope of the Red Edge (SRE), Red Edge Inflection Point (REIP), Greenness Index (GI), and Soil Brightness Index (SBI).
The results from the five tests were imported into the GIS program ArcInfo from Environmental Research Systems Institute (EsriÒ ) Inc. ArcInfoÒ provides a variety of tools to import data and convert it into points, lines, or polygons that have spatial data as well as metadata associated with them. The GIS data developed can then be distributed to customers along with the GIS viewer ArcExplorerÒ also from Esri. ArcExplorer provides an easy to use interface for viewing and interpreting GIS data and can be distributed freely (within the guide lines of the ArcExplorer license).
Methods
• Data Collection
Hanna Vineyards is located in Napa, California and grows a variety of grapes including Chardonnay, Pinot Noir and Cabernet Franc. The vines range in age from 2 to 26 years and are grown on about 72.5 acres of land. The data was collected during the month of October while the sun was at its highest, from around 10:00 am to 2:00 pm.
Hyperspectral imagery was collected using a CASI built by ITRES Research Limited. The CASI is an airborne CCD pushbroom imaging spectrograph that can record up to 288 bands from 400 nm to 1000 nm and a 37.8 degree field of view. For the Hanna data collect, 36 bands were used and four flight lines were required to capture the entire vineyard. The four flight lines were flown with a small amount of overlap between adjacent lines to ensure complete coverage of the vineyard and to facilitate mosaicking later. An Applanix POS Inertial Navigation System (INS) system with an Inertial Measurement Unit (IMU) was used to measure and record accurate roll, pitch, yaw and GPS position and altitude. Ground support included calibration panels and a GER 1500 handheld spectrometer for taking plant spectra. The GER 1500 is manufactured by the Geophysical and Environmental Research Corporation and has 512 channels covering the spectral range from 350 nm to 1050 nm with a 1.5 nm bandwidth per channel. The flight lines collected with the CASI resulted in four image cubes, i.e. four individual 36 band images.
• Post Collection Processing
Images collected using airborne platforms usually need to be geometrically corrected. The motions of the aircraft, roll, pitch, and yaw introduce distortion in the raw image. For each of the four image cubes, the POS generates two files, *.xyz for GPS information and *.atp for aircraft INS data. Ball uses an in-house geometric correction program called GeoCorrTM;. GeoCorrTM; corrects the CASI image cubes using the GPS and INS data files and can also make use of a Digital Elevation Map (DEM) for even greater accuracy. GeoCorrTM; corrects distortions in the image and re-orients the image properly with respect to True North. Figure 1 shows a portion of the image before and after geocorrection. After geocorrection, the road along the right side of the Before image has now been straightened as can be seen along the left side of the After image. The road switches from the right side to the left side of the image because GeoCorrTM has re-oriented the image with respect to True North.
Before After
Figure 1. Geometric Correction
After geocorrection, the four image cubes were mosaicked together using Research System Inc.'s program ENVIÒ (Environment for Visualizing Images). The four images fit together side by side with one of the two center images used as the base image. The two images adjacent to the base image were warped to it using common points found in the overlap. The last image was then warped to the adjacent image that had been previously warped to the base image. ENVI was then used to mosaic the four images together, creating a single 36 band image cube. An RGB geoTIFF image was also created for later use as a GIS background layer.
ENVI was also used to process the final image cube. A routine was written using ENVI's internal progamming language IDL (Interactive Data Language), that performed four analyses: Normalized Difference Vegetation Index (NDVI), Slope of the Red Edge (SRE), Red Edge Inflection Point (REIP), and Greeness Index (GI). NDVI measures the abundance and health of green plants. It uses the high reflectance of vegetation in the NIR region and low values of reflectance in the Red region. Vegetation will have a value between zero and one and high NDVI values connotate healthy vegetation. SRE represents the slope of the Red-NIR absorption line of the plant spectrum. As a plant matures, the SRE increases because of an increase in chlorophyll "a" absorption in the Red bands and increased reflectance in the NIR bands. When a plant passes maturity, this process is reversed and the SRE decreases. Geochemical stress can also cause the SRE to increase. REIP is the wavelength location of the Red-NIR absorption line of a plant spectrum. As a plant matures, this absorption edge shifts to longer wavelengths (red shift). Geochemical or water stress has the reverse effect, causing a shift of the red edge towards shorter wavelengths (blue shift). REIP can indicate plant stress over time. Finally, GI is determined using is a linear transformation of four bands called the Tasseled Cap Transformation. The Tasseled Cap Transformation is designed for agricultural scenes and results in four output bands, greenness, soil brightness, yellowness, and haze. The greenness, or GI, and soil brightness convey ~95% of the information in an agricultural scene. The GI displays abundance and vigor of living vegetation. It shows the contrast between the NIR and visible bands and is related to the amount of green vegetation in the scene.
• GIS/ArcInfo Processing
Analysis of the images in ArcInfo was a multistep process. Each of the five tests were treated similarly, the example described here is for GI.
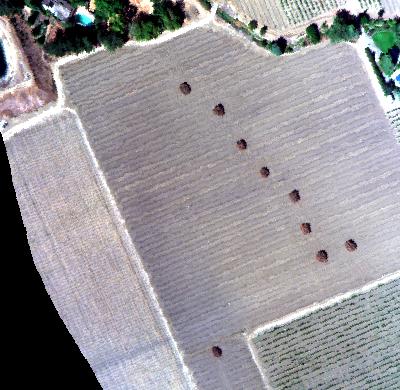
The RGB GeoTIFF image created from the original 36 Band image cube was usually used as a reference for visual placement of vines when examining the single band GI image. Figure 2 shows a close up view for a small section of the background GeoTiff image.
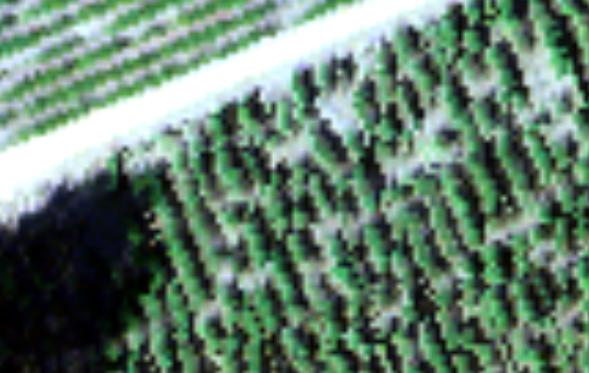
Figure 2. GeoTiff Image
The single band images of the four analyses contained floating point values for each pixel. These values corresponded to the values calculated by the appropriate test (i.e. NDVI, GI, etc.). It was discovered that when ArcInfo imported the images and converted them into Grids, ArcInfo automatically rescaled the pixel values from zero to 255, losing all of the relevant information for each test. ENVI has the ability to export images as ASCII text files, and by making use of this feature, it was possible to import and convert the ASCII files directly into Grids in ArcInfo, preserving the numerical results of each test.
The ASCII file for the GI was imported into ArcInfo and converted into ArcInfo’s internal raster format Grid. With the image displayed as a Grid, it was possible to display each pixel in a color based on its value. For GI, the pixels ranged in values from 1,400 to 10,000 and were displayed using a classified RGB range, with blue representing the healthiest plants, around 9,800. The result contains a large amount of information that may be difficult to interpret or extraneous, such as the dirt which shows up as red, Figure 3.
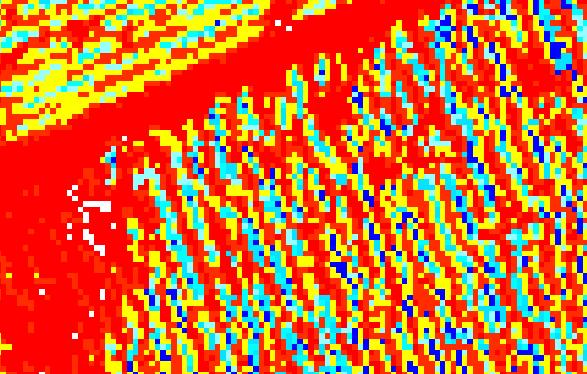
Figure 3. GI Grid
A histogram that displays the distribution of pixel values for the grid image was used to determine what ranges and values were the most meaningful, Figure 4.
Figure 4. Pixel Histogram
Once a range of values was determined, these values were used to convert the grid into a contour, Figure 5. The red lines represent a GI of 1,200 and areas within the red contour are greater then 1,200. Each contour represents the edge of a particular GI value. The contour is useful in delineating areas with different ranges of GI.
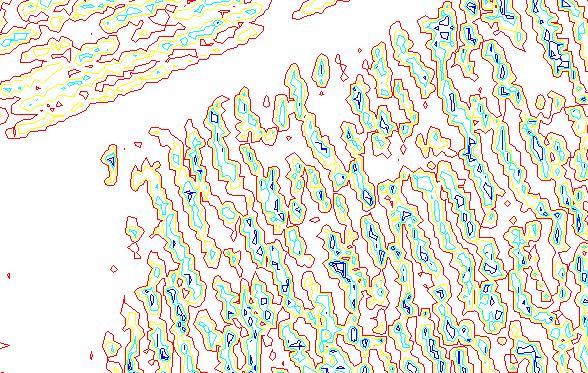
Figure 5. GI Contour
Selected contours were then converted into separate coverages. In Figure 6, the red represents areas with a GI of at least 1,200, green 2,509, and blue shows vines with a GI of at least 3,818. Since each value is a separate coverage, it is possible to display only those GI ranges that are needed. The user can use ArcInfo to identify each coverage shown and locate its exact position within the vineyard.
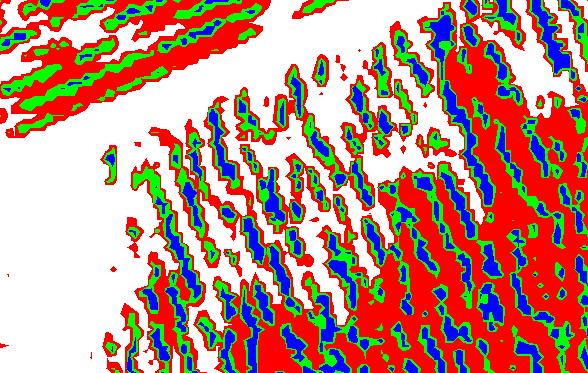
Figure 6. GI Coverages
Figure 7, shows the GeoTIFF combined with the 2,509 and 3,818 GI coverages. This demonstrates ArcInfo’s flexibility for combining data formats to provide an accurate and useful presentation of the final results.
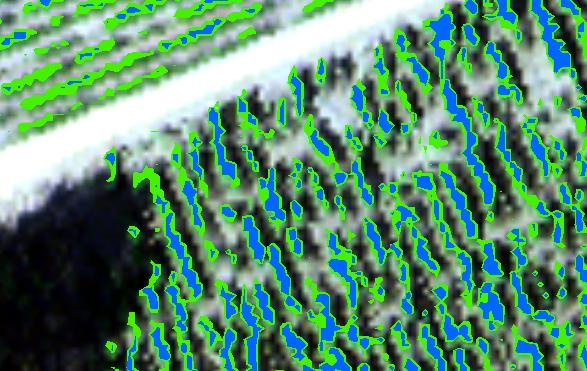
Figure 7. Coverages with GeoTIFF
Results
• Normalized Difference Vegetation Index, Greenness Index and Slope of the Red Edge
The results for NDVI, GI, and SRE were surprisingly similar. All three tests correctly identified the rows of vines and by using ArcInfo it was possible to produce coverages that were meaningful and easy to interpret. All three tests show almost identical coverages for low values (red) and high values (green). NDVI results in Figure 8 do not cover the vines as much as the GI and SRE results. This may have been due to the way NDVI was calculated, but with the results so similar, it is more likely the result of the contour selection. The contour value selected for the lowest value of NDVI contour may have been just inside the edge of the border between the vine and soil, resulting in a slightly smaller coverage polygon.
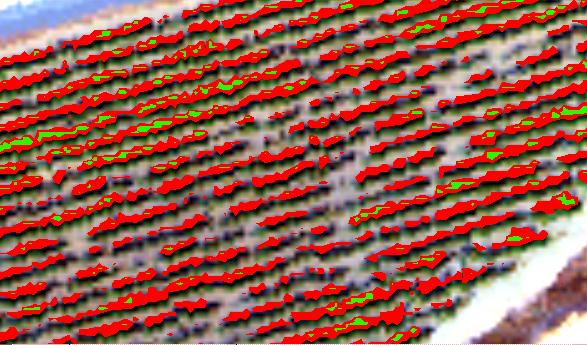
Figure 8. NDVI
Both the GI in Figure 9 and SRE in Figure 10 show areas where the lower values, in red, actually touch. This results in coverage polygons merging together and vine row definitions becoming nondescript. This problem is difficult to solve because it would require selecting a higher value for the contour selection, which may result in some healthy vines not being identified. The merging of polygon coverages would also occur anytime the vines were a closed canopy. It just happens that the Hanna Vineyards trim their vines in discrete rows.
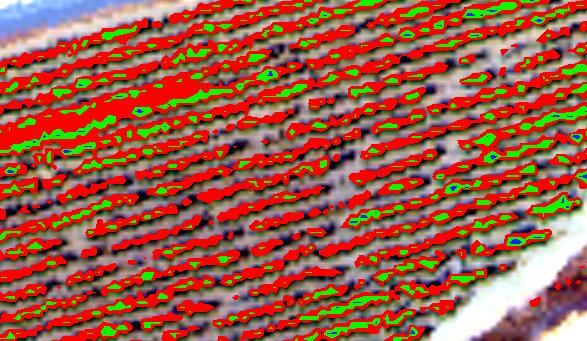
Figure 9. GI
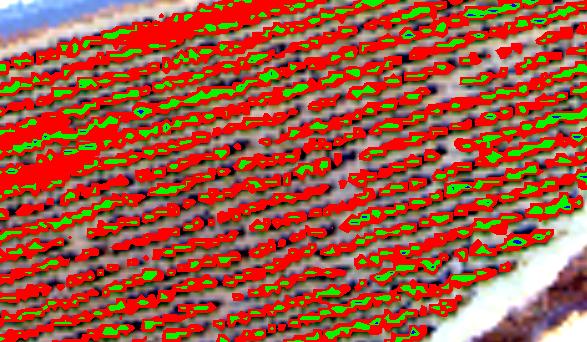
Figure 10. SRE
• Soil Brightness Index
The SBI is related to the GI and both are calculated at the same time. SBI is a soil index, and GI is a vegetation index for an agricultural field. Figure 11 shows a SBI of 5,000; it clearly designates the areas of soil between the vines but does not identify the large areas of soil. Selecting a higher value of SBI only resulted in adjacent polygons merging together, covering over the vines. As mentioned above selecting the appropriate value from the contour may eliminate this but it can be difficult to judge. SBI is more useful for identifying soil features rather then plant health.
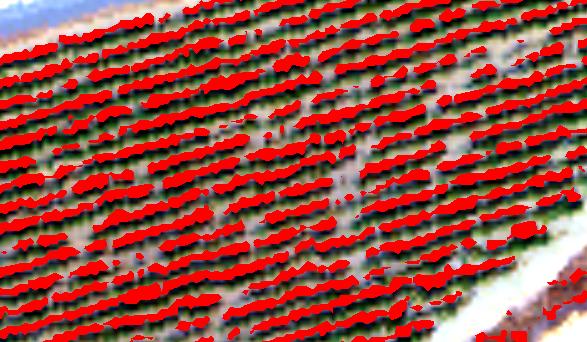
Figure 11. SBI
• Red Edge Inflection Point
The other four tests all returned results that were continuous starting from a lower value and moving smoothly to an upper value. The results from the REIP contained only seven discrete values. These values indicate the wavelength location (near 700 nm) of the chlorophyll "a" absorption edge. As a plant matures, this feature is found at longer wavelengths. Most of the values for the entire image were at an REIP value of 703 nm, which resulted in a complete washout of the image. Figure 12 shows the same area of vines as Figures 8 through 11. At this time no effective method of displaying the results from the REIP in ArcInfo has been developed.
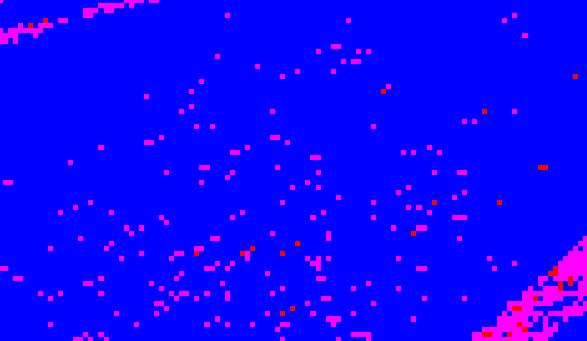
Figure 12. REIP
• Other Display Possibilities
The coverages created so far display the various test results for the plants themselves. Frequently, grape growers are interested in how each field is doing with respect all of the fields and less interested in differences between plants or rows of plants. Figure 13 shows the average SRE for each field, darker shades represent higher SRE values. This type of display can be useful when trying to determine which field to harvest first.
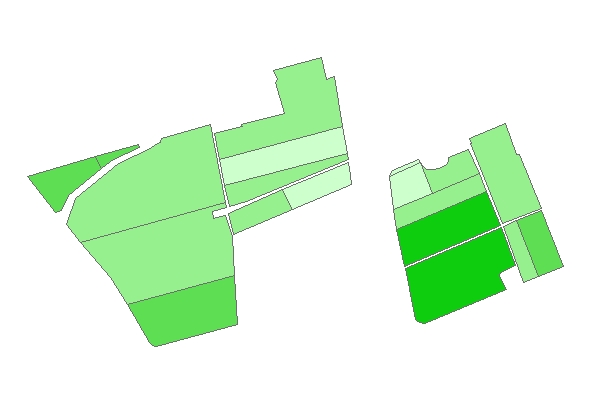
Figure 13. Average SRE
• Data Issues
The ability to convert data into an ArcInfo coverage depends on the quality of the collected hyperspectral imagery. Figure 14 demonstrates a field with small young plants. Compared to the mature plants, they are not detectable in the GI analysis. This appears to be the result of the resolution at which the data was collected. At a resolution of 0.7 meters per pixel, the small plants do not show up well enough in the GI analysis, even though they may be healthy. Increasing the resolution should solve this problem but it also increases the amount of data that must be collected and the data collection and processing times. Also, the platform (airplane) dwell time cannot be any slower for smaller pixels.
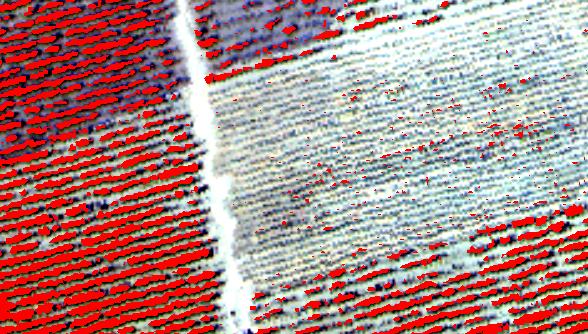
Figure 14. Resolution Limitations
The CASI depends on reflected light to collect data. Any shadows from trees or clouds will depress the spectral response. Healthy plants may not show up in coverages created, as shown in Figure 15, where a tree’s shadow effectively blocks some vines. This kind of problem can occur anytime there is a large decrease in reflected light levels.
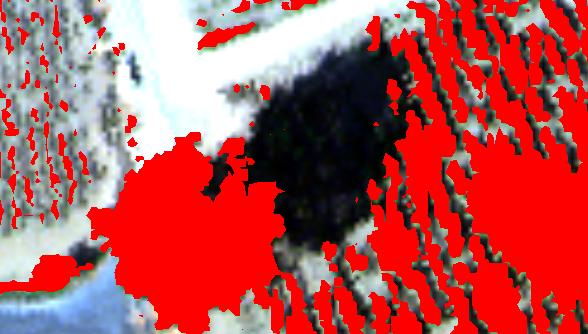
Figure 15. Shadows
• ArcExplorer
ArcInfo is a very expensive GIS package and may be unavailable to customers to whom this kind of data would be collected and made available for. Esri’s free GIS viewer, ArcExplorer is capable of displaying all of the ArcInfo coverages created. The program is fast and allows for the capability of viewing spatial and meta data. Map files for ArcExplorer can be made prior to delivery of any data, facilitating the viewing experience for the customer. Esri allows ArcExplorer to be distributed freely and can be included with any data delivered to a customer.
Conclusions
This report has documented the some of the results from BATC's Viticulture Internal Research and Development (IRAD) Program. The focus of this report has been on the use of the GIS package ArcInfo to create a GIS-based product.
The 36 band hyperspectral data of the Hanna Vineyards was geometrically corrected using GeoCorrTM and then mosaicked and analyzed using ENVI. These results were used to create five single band images. Each image displayed the result of a different test for plant health, age or vigor. The five tests were Normalized Difference Vegetation Index (NDVI), Slope of the Red Edge (SRE), Red Edge Inflection Point (REIP), Greenness Index (GI), and Soil Brightness Index (SBI).
The results from the five tests were imported into ArcInfo and converted into polygon coverages. The GIS-based results developed for NDVI, GI, and SRE were all very good. It was possible to create coverages that provided informative yet easy to interpret data. SBI was also successfully developed into a coverage but is probably of limited use when trying to determine plant health or vigor. The results from the REIP proved to be difficult to interpret in ArcInfo. The discrete REIP values had a limited range and effectively washed out any distinction between the vines and soil. The selected resolution of the CASI must be considered anytime small objects on the ground need to be detected. Not choosing the correct resolution can prevent the CASI from recording usable data, limiting post processing and analysis capabilities. Any shadows falling across the plants can also inhibit detection and analysis.
ArcExplorer appears to be an effective and easy to use method for displaying all of the data created for the Viticulture IRAD. Since ArcExplorer can be freely distributed, it will be a valuable tool to provide when delivering hyperspectral results to customers.
Overall, ArcInfo and ArcExplorer have shown themselves to be effective in interpreting the results of hyperspectral images and creating an easily interpreted and deliverable product to customers.