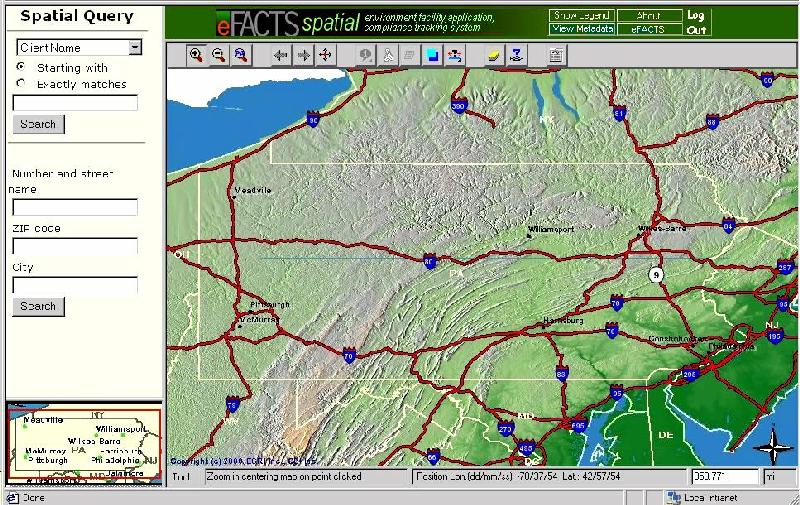
The permitting process at the Pennsylvania Department of Environmental Protection (DEP) is filled with many challenges. To enhance this process, DEP and Esri developed a web-enabled spatial component to DEP's corporate database, eFACTS, (Environmental Facilities Application Compliance Tracking System), known as eFACTS - Spatial.
eFACTS-Spatial demonstrates the power of GIS and the convenience of the web. This success has generated new initiatives in data quality, standards, and staff training.
Additionally, the success of eFACTS-Spatial and ArcIMS deployment has created the right tool for addressing key DEP concerns such as Watershed awareness, the permitting process and public outreach.
The Pennsylvania Department of Environmental Protection (DEP) has been on a three-year journey to "spatialize" its corporate database. Along the way, we at DEP have grown in our awareness, and employment of GIS technology to where GIS is an integral part of information technology initiatives. This paper chronicles the three-year evolution of GIS in Pennsylvania's Department of Environmental Protection.
Pennsylvania DEP has as one of its primary functions the task of processing permit applications. This requires managing legacy data; permit applications, inspections, and other functions related to the permit process. This results in approximately 1,200 Oracle tables and over 100,000 permits. Until DEP realized the tremendous advantages of viewing data with GIS, the choices in viewing, querying and otherwise manipulating this data were limited to less friendly methods.
When management has a spatial view of data and can visualize new ways of using that data, you begin the process of developing a GIS champion. This is the first and primary ingredient in changing the way data is viewed. This GIS champion can become the advocate for moving away from the single dimension table view to the prospect of employing the data in a relational database with a spatial context. The GIS champion is one who understands the power of GIS, can envision and articulate the advantages gained by applying GIS to existing systems, and has the leadership skills to move projects forward.
While some may argue for a different starting point, adding a spatial element to our most important, most used database by conducting a pilot project was the best approach to prove the value of GIS. As always, DEP relied on unbiased user input while developing the pilot. In 1998, DEP contacted Esri with an idea for developing a pilot. DEP needed something that was universally accessible, and user friendly, and provided the ability to have basic modifications and maintenance done in-house and of course within budget.
After several meetings, system designs, and mockups depicting the application were reviewed and modified until desired functionality, user interface, and data accessibility were achieved. From this initial concept, the pilot was developed and deployed. A cross-section of potential users was solicited for design recommendations and testing. From this initial users group changes and enhancements were made, and when consensus among the participants was achieved, the first version of eFACT-Spatial was launched. A GIS champion, a concept, user input, and a developer were some of the ingredients needed to produce this pilot.
Within eighteen months, DEP went from nothing to a customized web-based tool that could display and query information from our corporate database. Also included in our first version were County Boundaries, Minor Civil boundaries, Watershed layers, and other environmental data. Little did we at DEP know that we were among the first to use what would become ArcIMS technology.
As noted in Figure 1, there are several parts to eFACTS-Spatial. The major components include: the spatial query area, address matching capability, the map, and associated tool bar. A brief description of these major components follows.

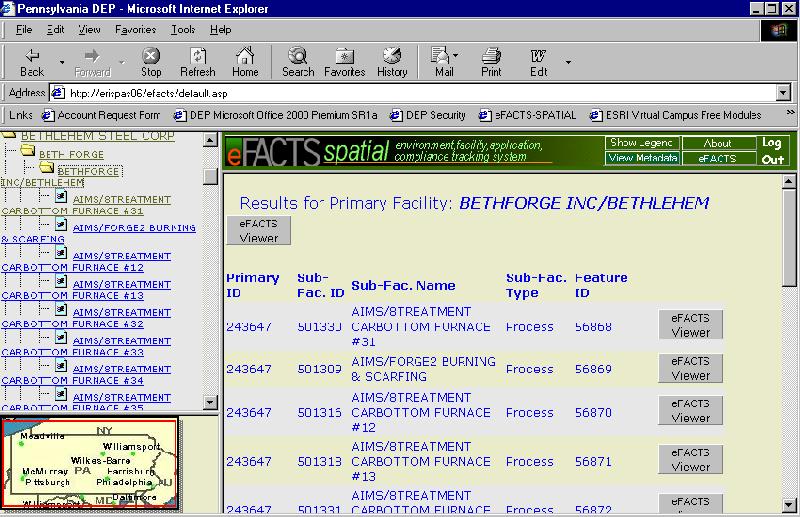
The spatial query area, shown in Figure 2, provides the ability to query our database of permitted facilities. Here the user can define the query based on the Client, Site, Primary Facility, or Sub-Facility. The resulting display of the Client, Site, Primary Facility, and Sub-Facility has added a needed dimension to aid the user in understanding our permitting environment and the relationship between the permitted entities. This tool will also query the County, Minor Civil Boundary, and the Watershed layers.
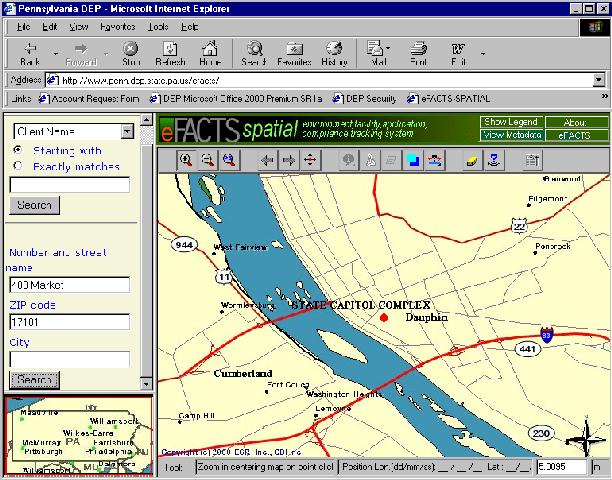
The address matching section, shown in Figure 3, allows the user to key in a street address and ZIP code and move the map to the desired location. The popularity of this web-based address matching tool, has been so high as to make it a default function for future development.
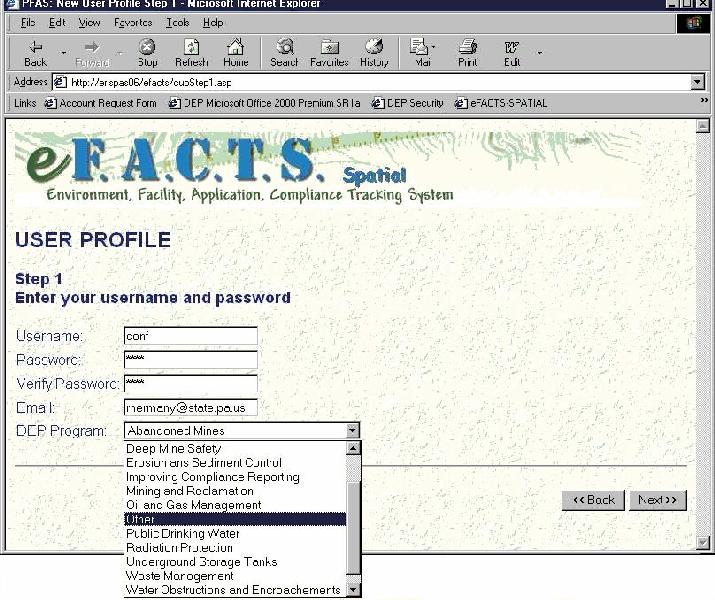
Over time, numerous spatial data themes have been added to eFACTS-Spatial. While adding this data has been beneficial to the users, they have also noticed a corresponding decrease in performance. Since most users only need the spatial data necessary for their particular program, it made sense to create user profiles based on DEP’s Environmental Program Areas. Figure 4 shows the logon screen and the drop-down box for selecting an Environmental Program Area.
This profile approach allowed us to reduce the loading time of the application because users were not loading all the data only what they needed. This profile option also provides for loading the data specific to a region. Therefore, added benefit is also achieved by not loading data for the entire state but only the data needed for a specific region. Less drain on the network, a faster response time, a customized view tailored to the specific user’s needs and providing data specifically related to the job has made for more and happier users.
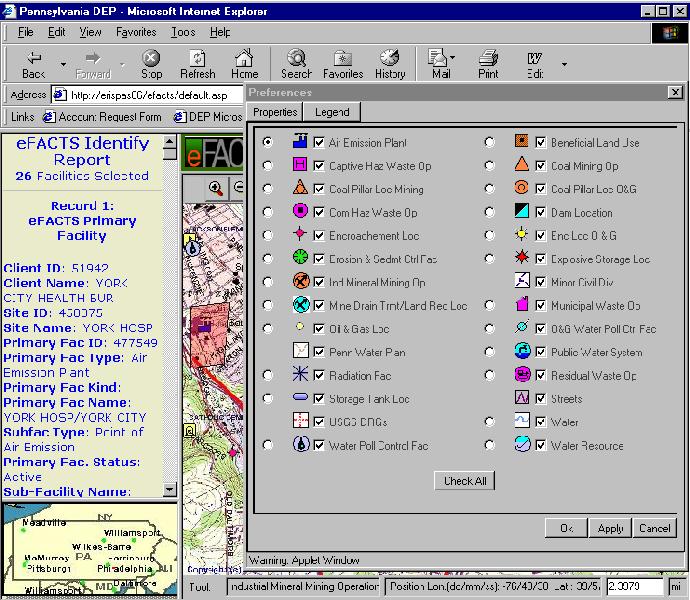
In Figure 5, the various icons are seen in the preferences box. The active icon (Air Emission Plants) has been queried using the familiar “Identify tool” and the results are noted to the left of the map.
If there is a secret to our success, it was in the use of this technology. The use of this technology and the design provided:
Because of eFACTS-Spatial’s functionality and accessibility, GIS awareness increased throughout DEP. However with awareness comes visibility of areas needing attention. A widely used resource that displays overlaying data layers will create a focus on data quality and a need for standards.
What starts with a simple question about projections and datums can and should involve all who need and use the data. Even though DEP would not consciously create and adopt a standard without maximizing collaboration, it is still necessary to remember not to generate standards from a vacuum. On the same note, wide spread use of assumed best practices does not make a standard.
Datum’s, projections, data accuracy, database standards, cartographic standards, and others are a few of the standards that should be in place. Although there are many approaches to data quality, all require, the tools to accomplish the desired goal. Requiring 10-meter accuracy or better may be a worthwhile goal but without available Global Positioning System (GPS) receivers, your requirements will go unfulfilled. Standards or policies put in place must consider the GIS user community. For a state government agency, contacting our regulated community, academia, private industry, and local governments must be accomplished prior to adopting any standards. Pennsylvania’s DEP is fortunate in gaining this needed insight through the work of others. Various statewide professional organizations regularly and vigorously discuss these issues and are therefore a great source for input.
There are many more issues regarding quality and standards, legacy data, cultural change, funding, and training just to name a few. While software application development is put in place to serve the user, DEP also needs a similar development effort that grows the infrastructure needed to ensure success of the application.
Today, DEP has made many changes resulting from the inclusion of GIS technology. Among the many changes is a new Locational Policy. DEP is instrumental in developing an all agency GIS steering committee, Pennsylvania Geospatial Information Council (PAGIC). Academia, the professional services industry, and local governments are members of the Pennsylvania Mapping and Geographic Information Consortium (PAMAGIC). Other changes are occurring but this is a good start.
Even though DEP tries to make GIS web sites as intuitive and friendly as possible, if the site is not easy to use it won’t be used. To head off problems before they start DEP became aware of several things needing to be done.
To many of the non-enlightened, GIS and web technology can be intimidating. Simple easy to use tutorials and help screen are essential. Contact with users during development and after rollout is needed to reduce the fear factor. For some the “this is the way we always did it” or the “it worked then it will work now” culture needs to be addressed. One way to minimize the cultural shock is to ensure the tool is relevant to the job. If the tools created for our users only complicate their jobs, the life of the application will be very short.
The fallout of eFACTS -Spatial is a proliferation of web GIS.
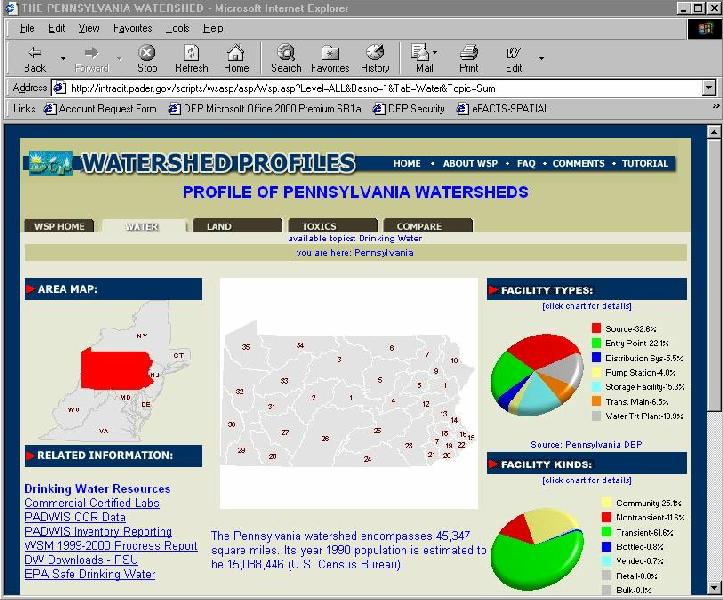
Here is just one example of employing ArcIMS technology. This Watershed Profile Tool displayed in Figure 6, draws together an Oracle database from one computer; a web server from another and an ArcIMS map service from yet another computer to enable this site to display water, land, and toxic information regarding a Watershed boundary.
Other GIS initiatives involve: West Nile Virus monitoring, Mine Subsidence Insurance, Landfills, and Brownfield Sites. All of these and others are enhanced by the use of web-based GIS.
GIS started with a few enthusiasts, pockets of GIS expertise, but not a department wide awareness of this technology. The success of our first web application using GIS technology opened the eyes of many to the possibilities provided by GIS. It was not an easy or quick sell. Cultural issues, building an infrastructure that includes standards and training were and are essential to a total integration of GIS.
The web is an excellent vehicle for introducing new technologies. Because the web browser is a common user-friendly tool, it serves well as a vehicle for launching GIS applications. It is this view that has advanced the use of web-based GIS. While there will always be a need for high-end desk top GIS, web GIS has found its niche at the Pennsylvania DEP.
Nancie Imler
Director, Bureau of Program Integration and Effectiveness
Program Manager, PA Watershed Profile Tool
Pennsylvania Department of Environmental Protection
Lori Shienvold
Senior Representative
Esri - Harrisburg, PA
717-772-4006
lshienvold@Esri.com