Many schools would like to incorporate a geographic information system (GIS) into their classrooms, but barriers such as software cost often prevent this from happening. A distributed geographic information system (DGIS) served out via the Internet can solve this problem by making a Web browser a virtual GIS. This presentation will examine how a team of graduate students at the University of Texas at San Antonio developed a DGIS (ArcIMS) to be used by San Antonio schools for environmental education. This presentation will also focus upon the educational effectiveness of a classroom DGIS, administrative barriers, technical problems, and academic value.
|
|
|
|
|
|
|
|
|
|
As of the early 1980’s, GIS programs were complex and required highly skilled users in sophisticated computing facilities to operate them. Recently, more user-friendly software has been developed and personal computers have been advancing in processing speed, memory storage, and lower prices affording the opportunity for the public to use GIS. However, this rapid expansion of technology did not bring expected booms in the GIS industry of an unanticipated shortage of trained professionals (Audet and Abegg, 1996). As a result of this shortage, the National Center for Geographic Information & Analysis (NCGIA), the national leader in GIS education, began developing curriculum at the college level and eventually published Core Curriculum in GIS to train individuals in GIS. (Goodchild and Kemp, 1990)
With the popularity and convenience of the Internet, GIS users realized that information needed to be shared on a global level to be most effective. Although geographic data that are communicated in a network have been in use for thirty years, it was not until 1995 that the Internet emerged as a potential networking source (Plewe, 1997). Since the Internet has already become fertile ground for real-time science, journalism, and publishing, it is a logical progression for GIS to move from the desktop to the Internet (Ter Haar, 1997). The Internet allows the opportunity to increase the efficiency and effectiveness of obtaining and sharing all types of geographic information such as maps, graphic text, and data.
The current explosion of GIS data on the World Wide Web (WWW) has caused many organizations to build effective websites that organize these data in a useful manner for public use. These organizations that incorporate GIS in their websites include Chatham County, North Carolina, Federal Emergency Management Agency, National Geographic, Geography Network and many local government offices. The Chatham County, North Carolina website (www.emapper.com/chatham/map.htm) allows one to create and query maps and tax-parcel data. The National Geographic website (www.nationalgeographic.com/maps) presents satellite imagery and street maps. The Illinois State Police website (http://samnet.isp.state.il.us/) provides interactive mapping of traffic sites, sex offenders, and other crime data by county. The Realtor.com website (www.REALTOR.com) allows one to search and map numerous property listings. In looking at all these examples, one can visualize the effectiveness of Internet GIS. In time, Internet GIS can allow a city worker to integrate local parcel data with flood maps, elevation data, and environmental data on government sites to perform complex analyses that were once time consuming.
Many nonprofit organizations are realizing that Internet GIS technology can provide more effective access to data at lower costs because viewing the Internet is virtually free to the public (Plewe, 1997). These organizations are creating sites that allow citizens to research for themselves the validity of a corporate organization’s possible misleading presentation of data in a matter of minutes. Currently in the United Kingdom, a web-based public participation GIS is aiding local environmental decision-making. Research has shown that in planning problems and policy making, these sites are useful in informing and engaging the public (Kingston et. al., 2000). “Sophisticated GIS software, once available to a few, is now made available for public use via the Internet.”
As awareness of the progression in technology has grown, the possibility of GIS implementation in secondary and elementary education has been considered by an informal network within the GIS community (Audet and Abegg, 1996). GIS has been sporadically introduced to educators through various in-services and workshops where teachers are introduced or trained to implement GIS in their classrooms. General interest among teachers has been high (Audet and Paris, 1997). However, several teachers have complained about the complexity of the software, lack of optimal hardware, and lack of a “ready-made” curriculum.
There have been recent advances in GIS curriculum development. Environmental Systems Research Institute (Esri) has published “Explore Your World,” a geography teaching supplement for grades 5-12, as well as the program ArcVoyager on CD-ROM (Environmental Systems Research Institute, 1998). In addition, the Center for Image Processing in Education has developed a series of lessons for teaching science, geography and social studies in grades 6-12 (Center for Image Processing in Education, 1998). Although these curricula are classified by level of countries or states, they do not allow the user to query local data. Local curricula have often been left to the occasional enthusiastic teacher, who is willing to devote the extra time to develop a module for their classroom (Brown, 1999). Teachers most often do not have the time to develop local curricula of their own.
Several initiatives among universities and high schools have led to local curricula that are adapted to high school curricula. Florida Atlantic University partnered with Jupiter Community High School to develop the Palm Beach County GIS Project. This project addresses environmental and earth education by integrating technology, focusing on interdisciplinary subject matter, and addressing environmental values (Ramirez and Althouse, 1995). As a result, a one-year curriculum was developed for the high school level. Another curriculum was adapted for use in Roosevelt Middle School, a Mathematics/Science/Technology magnet school in Palm Beach County, Florida (Ramirez, 1996). The University of Wyoming joined efforts with selected local earth science teachers in the Earth System Science Internet Project (ESSIP) and incorporated GIS into grades 6-12 science curricula throughout the state of Wyoming. They developed a CD-ROM entitled Wyoming: An Image Database for use in statewide education workshops (McClurg and Lerner, 1998). The geoscience department at Thomas Jefferson High School for Science and Technology in Northern Virginia developed a course that utilizes GIS along with other technology to teach geoscience (Fazio and Keranen, 1995).
From these examples one would think GIS is well on its way to being
integrated in many different secondary education curricula. However,
Brown University education professor Richard Audet, likens GIS technology
to the overhead projector. Bowling alleys had used the overhead projector,
a relatively simple technological innovation, for almost a decade before
it was widely adopted in education. GIS is also “progressing
at a similarly frustrating pace” (Audet and Paris, 1997). Thus, educational
applications of GIS technology at the secondary level have largely been
ignored.
According to Mackaness (1994), GIS helps to develop skills in managing information technology. GIS can be used to model global or local issues, to increase awareness of the need to collaborate on international levels, and to monitor and conserve the world’s resources. Mackaness also outlines reasons for GIS implementation at the secondary level. First, GIS develops spatial competence, problem-solving abilities, and geographic competence through interactive learning. Second, GIS develops interpersonal skills such as team problem solving skills and trouble shooting. Last, GIS creates an awareness of other world cultures. Goodchild and Kemp (1990) also provide similar arguments for GIS in the high schools, explaining that GIS will enhance student interest in geography and other subjects as well as motivate students toward careers in science and engineering.
Most existing curricula tend to focus on learning about GIS and skill acquisition. Few focus on actual project application. “The distinction becomes learning about GIS versus learning with GIS (Audet and Paris, 1997).” There is little room in an already packed curriculum to add learning about GIS. Therefore, GIS needs to be incorporated as a learning tool to achieve current curriculum objectives to be inviting for teachers to adopt such a new technology. Thus, the challenge is to develop a GIS curriculum that enables the student to gain valuable GIS operating skills and the knowledge of how to use GIS to solve problems. As children of the information-age graduate, GIS skills will help them organize and analyze the flood of information to make valued judgments in a proper context. Without these skills, this information can be overwhelming and unusable. Examples of valued judgments can include where to buy a house, what meteorological factors affect the area, what school district is right for the children, where community services are located, and how local industries are handling the generated wastes.
Internet GIS and the WWW combined are like a “virtual” textbook interface. Educators need to provide the skills to critically “read” this textbook. Most educational centers such as museums, zoos, and science centers already have interactive presentations such as a kiosk that allows the public to query different exhibits. Internet GIS can provide that similar interaction directly at home or wherever Internet access exists.
Internet GIS stands to have an advantage over current GIS software. GIS software can be very expensive, especially for smaller school budgets. Because most districts already have Internet access, providing GIS online gives teachers a financially risk-free opportunity to try GIS. A common teacher complaint concerning GIS is its difficult graphic user interface (GUI). By the nature of web browsers, the GUI for Internet GIS would be more user-friendly for easier public browsing. Current GIS software comes with packaged data. However, that data will eventually become obsolete. Internet GIS allows students to use updated data within their projects.
There are few examples of Internet GIS development for secondary education. Most current GIS projects use the Internet as a communication device for sharing of data. Yet, these projects still use GIS on desktop computers. The only project to the researcher’s knowledge that involves an Internet GIS is the Palm Beach County School District’s GIS KIDS project. A part of this project includes an interactive map entitled, InterActive Java GIS - On-Line Activities, located within a website (http://www.palmbeach.k12.fl.us/maps/gis/jshape/index.htm). This is a simple version of an Internet GIS with themes that include an aerial photo, roads, schools, and number of students. Besides this project, no other university or organization has developed a GIS curriculum to be accessed on the Internet for public use in schools.
As previously mentioned, there are limited general GIS curricula available
to high school teachers. Local curricula are even more rare.
No known curricula are available for Bexar County. Local curriculum
is seen to be more advantageous than general curriculum because students
are more interested in what is familiar to their own experiences (Brown,
1999; Dewey, 1938). Concerning Internet GIS, there is no known curricula
available. Therefore, a GIS curriculum that is local to Bexar County,
adaptive to current curricula, simple to implement with little prior training,
and available on the WWW gratis provides the best chance for adoption by
other teachers. Ultimately, student learning and interest would be
enhanced.
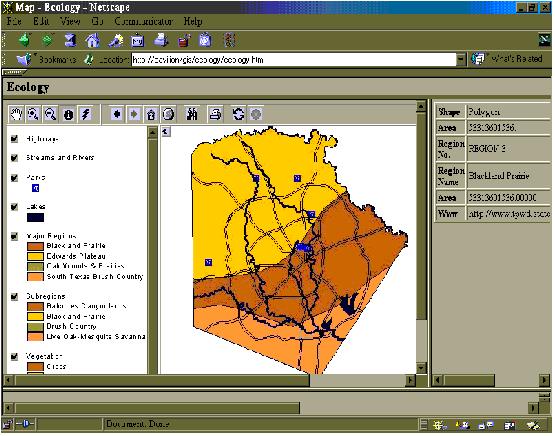
The first module, Ecology, was based on the ecology of Bexar County (Appendix A). Data sets and shapefiles of ecological regions were downloaded from the Texas Parks and Wildlife Department (TPWD) website (http://www.tpwd.state.tx.us/gis/download.htm) and the Texas Natural Resources Information System (TNRIS) website (http://www.tnris.state.tx.us/DigitalData/data_cat.htm). Themes in this module included highways, streams and rivers, parks, lakes, major ecological regions, ecological subregions, and vegetation. A special function of this module included hotlinking the theme of ecological regions to specific websites of the TPWD for more detailed information of that region. This hotlinking function was created by establishing the Link to URL script available at the Environmental Systems Research Institute website. Objectives of this module were to ascertain the major and minor types of ecological regions found in Bexar County; to dictate what types of vegetation and wildlife can be found within each region; and to use spatial analysis to apply information to the students’ own neighborhood. The total size of this module was 333 Kb.
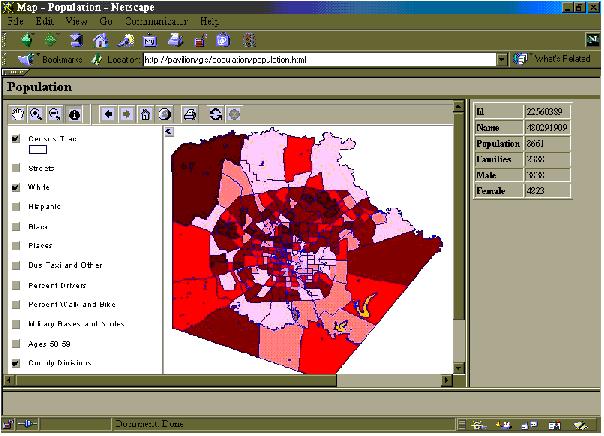
The second module, Population, was based on the problems with population in Bexar County (Appendix B). Data sets and shapefiles of the 1990 Census (TIGER data) were downloaded from the Environmental Systems Research Institute (Esri) website (http://www.Esri.com/data/online/index.html). Themes in this module included Census tracts; streets; Percent White population; Percent Hispanic population; Percent Black population; Percent Bus, Taxis, and Others; Percent Drivers; Percent Walk and Bike; Military bases, and Ages 50-59. The percent themes were created from the 1990 Census data. Objectives of this module were to analyze the population of the students’ neighborhood, military bases, and people ages 50-59; to analyze population based on race distribution; to analyze population based on modes of transportation; and to analyze the population explosion based on country by accessing several different websites pertinent to population change. The total size of this module was 50 Mb.
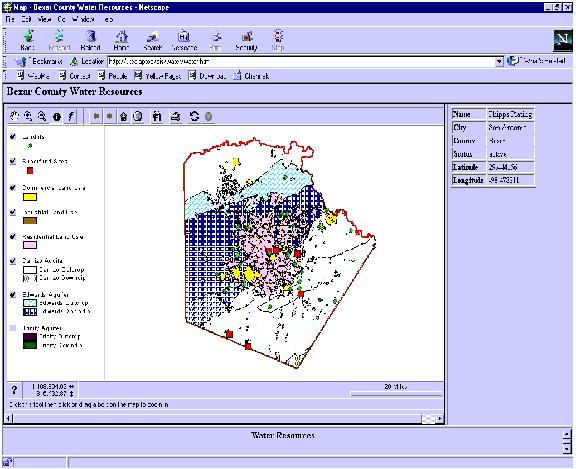
The third module, Water Resources, was based on the water resources of Bexar County and possible avenues of contamination of these resources (Appendix C). Data sets and shapefiles of aquifers, land use, landfills, and Superfund sites were downloaded from the Texas Natural Resources Information System (TNRIS) website (http://www.tnris.state.tx.us/DigitalData/data_cat.htm) and the Environmental Protection Agency (EPA) website (http://www.epa.gov/epahome/gis.htm). Themes in this module included Edwards Aquifer, Carrizo Aquifer, Trinity Aquifer, landfills, Superfund sites, commercial land use, industrial land use, and residential land use. Objectives of this module were to analyze the different aquifers and recharge zones of Bexar County; to use spatial analysis to determine which landfills and Superfund sites would be problematic to the water resources of the county; and to determine the status of various Superfund sites. The total size of this module was 17.5 Mb.
The last module, Air Quality, was based on the air pollution sources and pollution levels in Bexar County (Appendix D). Data sets of point sources, ozone levels, and nitrogen oxide levels were downloaded from the Environmental Protection Agency (EPA) website (http://www.epa.gov/epahome/gis.htm) and the Texas Natural Resource Conservation Commission (TNRCC) website (http://www.tnrcc.state.tx.us/gis/sites.html). These data sets were then converted to shapefiles. Air monitoring site shapefiles were downloaded from the TNRCC website. Themes in this module included monitoring sites, hourly levels of nitrogen oxides, daily levels of ozone, point sources, military bases and airports, and highways. A special function of this module included hotlinking the theme of point sources to the respective companies’ websites when possible. Objectives of this module were to research sources of air pollution from the TNRCC and EPA websites; to determine pollution levels of different point sources; to use spatial analysis of pollution levels to determine non-point sources; to determine the contribution Air Force bases have on air pollution; and to determine when ozone exceedances occur. The total size of this module was 19.8 Mb.
ArcIMS and a dedicated web server (Compaq Proliant 800 with 550
MHz, Pentium III processor, and 256 Mb RAM) were purchased by the University
of Texas at San Antonio in order to publish these modules on the Internet.
However, their use was unavailable due to software incompatibility problems
with UTSA and programming difficulties in the ArcIMS software. Therefore,
ArcView Internet Map Server, the predecessor of ArcIMS, and Microsoft Personal
Web Server 4.0 were used to publish the modules on a Dell Dimension XPS
T550 with a Pentium III processor at 550 MHz and 256 Mb RAM.
ArcView Internet Map Server is an ArcView GIS extension that allows
one to publish the “views” created on ArcView through a server. Personal
Web Server 4.0 allows one to convert a desktop computer to a server.
This is done by allowing Internet access to certain files through the computer’s
IP/Gateway address. The address was found by finding the Properties
of the computer’s Network.
Because ArcIMS had more functionality and options than ArcView Internet
Map Server, all modules had to be slightly adjusted. Some functions
and tools such as legend editor, query builder, and locate address were
not available on Internet Map Server. By serving the website through
a desktop computer and Personal Web Server 4.0 instead of a dedicated web
server, the server was probably more vulnerable to malfunctions, inefficiency
of handling multiple requests, and crashes. Therefore, for each module
a separate instance of ArcView was operating on the computer to avoid crashing
the entire website when a single module would encounter a programming malfunction.
For instance, if all four modules were operating from one instance of ArcView,
a crash to one module would render the others useless. By operating
four separate instances of ArcView, one for each module, the other modules
would not be affected by a crash to one single module.
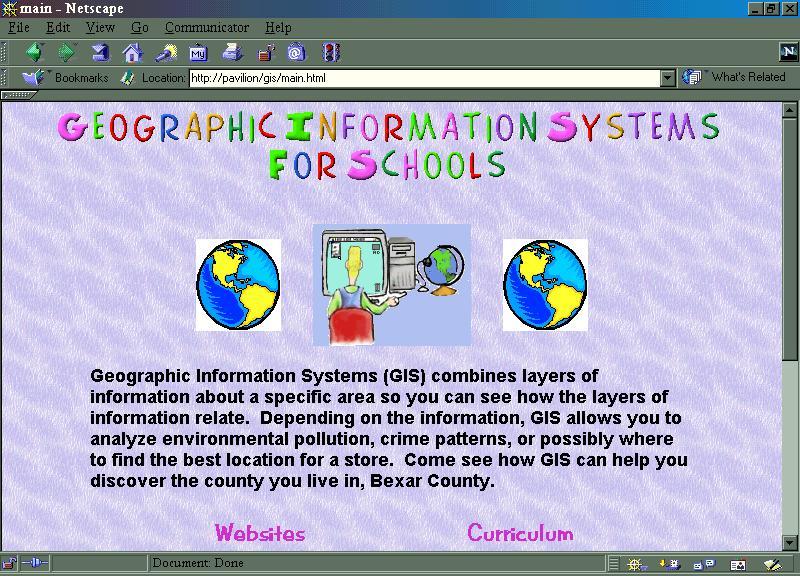
The main website (Figure 1) was developed to be the primary point of
access to all four modules. (http://129.115.242.148/gis/main.html: This
is a dynamically assigned IP address that is subject to change.)
Links to all four modules as well as their respective curriculum guides
were made available to the user. Each module’s website consisted
of three HTML frames. The main frame contained the theme legend and
the view. The right frame contained either listed data from the identify
tool or another website from the hotlink tool. The bottom frame contained
the worksheet for the respective module. (Figures 2 – 5.)

Testing of the curriculum occurred at both the high school
and middle school level. Students in a tenth grade chemistry class
were given five ninety-minute class periods to work on the four modules.
The classes were held in a computer lab housing 24 Dell Optiplex GX110
with a Pentium III processor at 800MHz and 128 Mb of RAM with 20 Gb of
hard drive space. Students were grouped two to a computer.
The URL of the website as well as the worksheets for each module were given
to the students. They were asked to follow the directions on the
worksheets. Students in an eighth grade Integrated Physics and Chemistry
class were given two forty-five minute classes to complete a module of
their choice. Various computers were used with most having a Pentium
II processor at approximately 300 MHz. The URL of the website as well as
the worksheets for each module were given to the students. Students
in a sixth grade science class were given the project as an extra credit
assignment. Various computers were used in school as well as at home.
The URL of the website as well as the worksheets for each module were given
to the students.
At the conclusion of the project, the high school students were asked
to evaluate the modules for academic value, and specifically what they
liked and disliked in each module. All students and teachers were
given a survey instrument that asked the user to evaluate certain statements
on a scale of 1 to 5, where 1 represented strongly disagree and 5 represented
strongly agree. A section was also provided for written comments.
Minimum teacher intervention was needed. Students seemed to learn how to navigate the website quickly. Few questions were asked. However, some redirection was needed. Most students were engaged in the curriculum and stayed on task. Several students did begin surfing the Internet through the available links on the secondary websites. However, the browsing did pertain to the topics within the module. A few student frustrations were observed when students were not able to access an organization’s website or when the module’s website became unavailable.
For statement one, the site was user-friendly and easy to learn, the average score for tenth grade, eighth grade, and sixth grade was 3.73, 3.15, 4.53, respectively. For statement two, I like the fact that the coverage was local to Bexar County, the average score for tenth grade, eighth grade, and sixth grade was 3.94, 3.70, 4.53, respectively. For statement three, I liked the functionality (tools) of the website, the average score for tenth grade, eighth grade, and sixth grade was 3.65, 4.35, 4.67, respectively. For statement four, I can learn valuable concepts through Internet GIS curriculum, the average score for tenth grade, eighth grade, and sixth grade was 3.96, 3.85, 4.60, respectively. For statement five, I felt my learning was enhanced by using Internet GIS vs. traditional teaching, the average score for tenth grade, eighth grade, and sixth grade was 3.77, 3.80, 4.93, respectively. For statement six, this type of curriculum (Internet GIS: interactive map with databases) has merit for today’s classrooms, the average score for tenth grade, eighth grade, and sixth grade was 4.31, 3.65, 4.80, respectively. For statement seven, rate your overall experience with this Internet GIS project, the average score for tenth grade, eighth grade, and sixth grade was 3.94, 3.95, 4.53, respectively.
Most of the average scores for each statement were approximately
four, which correlate to an agreement with the statements on the survey.
Overall experience also averaged approximately four, which correlates toward
a valuable learning experience. It is interesting to note that the
sixth grade students scored all statements higher than the other groups.
This increase is probably due to the fact that this project was given as
extra credit to the sixth graders. Therefore, only those students,
who were motivated to do extra work for a better grade, volunteered to
experiment with the curriculum. Another interesting difference was
that the teachers scored the functionality and ease of use of the website
slightly lower than the students. Possible reasons for this difference
could be that adults of the later generations are not as adept in learning
computer programs as students whose generation grew up with computers.
Also, some teachers are reluctant to learn new computer technology because
it can seem intimidating. In reality, students did not need much
teacher guidance. The browser functions were not more complex than
what is seen in most websites, and the tools were intuitive in nature.
Originally, the project was to use Arc IMS (educationally priced at $1000) and a dedicated web server (purchased for $6000), which both seem exorbitant. Because of software incompatibility problems, both were rendered useless. This dilemma was ultimately advantageous because what was substituted served the same purpose at a fraction of the cost. All that was needed to serve the website over the Internet was a standard desktop computer, Personal Web Server 4.0 (standard in Windows 95 and higher), ArcView Internet Map Server, and ArcView GIS which can be substituted by Arc Explorer 3.0 (available for free download at the Esri website). In most cases, Esri donates ArcView software to schools, as was in the researcher’s case.
Although there was a loss in processing speed, efficiency of the server, and functionality of the program due to the use of lower technology, this loss was compensated by the fact that this project became an affordable option for schools. Throughout the project, the researcher discovered that any school campus could house and maintain this website instead of UTSA because the components required were inexpensive and simple to maintain.
Having an on-site server in an individual school campus provides many different capabilities for maintenance and updating data. For instance, every time a programming problem arose or the website crashed, it needed to be corrected remotely at UTSA, and in the meantime, no further student work could be done at that site. With an on-site server, problems can be corrected instantaneously. Also, one has the capability of having students around the district collect local data and incorporate it in a timely manner. In other words, data can be collected, updated and served on the website making it available for all to see and use. However, the original idea of having UTSA host the site places the responsibility of maintaining the site and updating the data upon UTSA. In this manner, teachers can request specific data themes to be incorporated onto the site to parallel their curricula without having to worry about the mechanics of updating data.
In terms of academic value, it is apparent from the student evaluations that the curriculum is full of promise. Most students found the modules engaging and liked the fact that Internet GIS was an interactive learning experience. They felt they learned valuable information about their surroundings, making them more aware citizens. Most educators liked that it integrated technology in the classroom, which is fast becoming a required part of every curriculum. However, Internet GIS is more than interactive learning with computers. It also allows students to analyze current local data; to study real-life situations; and to understand the relationships between concepts through visual and spatial interpretation.
Of course, Internet GIS is not a substitute for other forms of
curricula. It is a complementary addition to both environmental science
and geography. Because GIS interpretation is a growing skill needed
in multiple fields, it should be implemented in some degree in secondary
education. The challenge will be finding teachers who are both innovative
and progressive enough to want to adopt Internet GIS into their curriculum.
Exposure and training through conference workshops and teacher in-services,
as well as the dedication of districts and teachers to create additional
curriculum, would be essential for Internet GIS’s success in the classrooms.
The scope of this study was to determine the feasibility of designing
and implementing an Internet GIS in a high school classroom. Since
this objective was achieved, the next logical step would be to determine
the actual level of effectiveness of this type of curricula on student
learning. The use of pre-tests and post-tests to evaluate student
learning would be warranted.
Since the curriculum does show promise as a method for engaging
students in the learning process, another area of research would be to
study how to properly integrate Internet GIS within an existing high school
curriculum for maximum effectiveness. Placement of the curriculum
within the unit, whether in the beginning as a discovery exercise, in the
middle, or at the end as a review, should be evaluated.
UTSA is committed to extending this project to all schools within
Bexar County. In light of this, a partnership and strong commitment
with districts and teachers are needed to make this project successful.
In-services or workshops dedicated to promoting Internet GIS in the classrooms
and across the district are needed. As the project is implemented,
technical support should be provided for all schools. It would be
essential for one to compile evaluations and comments from teachers, administrators,
and the general public to better serve the education community as this
project continues to progress.
In the discovery that an Internet GIS website could be created
and maintained on a school campus within simple means, a study should be
done on the feasibility of maintaining an Internet GIS website with an
actual campus. This website could be created as a class project
with students maintaining the site for a semester. Most individual
campuses within large school districts have their own website with their
own server on campus and have personnel dedicated to maintain the technology.
So in actuality, the technology infrastructure is available for this project
to become a reality.
Overview
Students will interact with GIS website to ascertain the ecological
components of Bexar County. This information will allow students
to establish which types of vegetation and wildlife can be found in various
ecological regions.
Time Frame
2 - 45 minute class periods
Objectives
? Ascertain the Major and Minor types of Ecological Regions found in
Bexar County
? Dictate what types of vegetation and wildlife can be found within
each region
? Use spatial analysis to apply information to their neighborhood.
Materials
? Computers with access to Internet
? GIS website
? Curriculum Handout
National Standards Addressed by this Lesson
Life Science
Populations and ecosystems
Earth and Space Science
Structure of Earth system and components
Science in Social Perspective
Natural Resources and environments
State Standards Addressed by this Lesson
Texas Essential Knowledge and Skills
§112.44. Environmental Systems.
(1) In Environmental Systems, students conduct field and laboratory
investigations, use scientific methods during investigations, and make
informed decisions using critical thinking and scientific problem solving.
Students study a variety of topics that include: biotic and abiotic factors
in habitats; ecosystems and biomes; interrelationships among resources
and an environmental system; sources and flow of energy though an environmental
system; relationship between carrying capacity and changes in populations
and ecosystems; and changes in environments.
(3) A system is a collection of cycles, structures, and processes that
interact. Students should understand a whole in terms of its components
and how these components relate to each other and to the whole. All systems
have basic properties that can be described in terms of space, time, energy,
and matter. Change and constancy occur in systems and can be observed and
measured as patterns. These patterns help to predict what will happen next
and can change over time.
(2) Scientific processes. The student uses scientific methods during
field and laboratory investigations. The student is expected to:
(C) organize, analyze, evaluate, make inferences, and predict trends
from data; and
(D) communicate valid conclusions.
(4) Science concepts. The student knows the relationships of
biotic and abiotic factors within habitats, ecosystems, and biomes. The
student is expected to:
(A) identify indigenous plants and animals, assess their role within
an ecosystem, and compare them to plants and animals in other ecosystems
and biomes;
1. Open Ecology Page of UTSA GIS for Schools Project
2. Take a moment and become familiar with the tools on the tool bar.
See what each one of them does. Use the Home button to refresh the
screen after you test the buttons.
3. Make sure the following items are turned on in the legend bar.
Highways
Streams
Parks
Lakes
4. Using the Zoom tool – zoom into your neighborhood.
5. Use the Identify tool and begin to identify features on the
map near your neighborhood.
a. Highway______________________________
b. Stream_______________________________
c. Park_________________________________
d. Lake_________________________________
6. Zoom out – now go to another area of town and zoom into an area and
identify features in that neighborhood.
a. Highway______________________________
b. Stream_______________________________
c. Park_________________________________
d. Lake_________________________________
7. Zoom back out and refresh the screen. You may have to scroll
down the map to get to the vegetation layer – turn of the vegetation layer.
a. What happened to the map?____________________________________
8. Turn on the Major Regions layer.
a. On what Major Ecological Region is your neighborhood located?_____________________________________
b. On what Major Ecological Region is Downtown SA located?_____________________________________
9. Click on the hotlink button. Now click on the Edwards
Plateau region in Bexar Co. Find the web site devoted to the Edwards
Plateau in the frame on the right side of the screen. You may need
to adjust the size of the frame by dragging the left edge to have access
to the information there. Record the following data:
Topography:
1. Size of Edwards Plateau _________________________________
2. Land characteristics _________________________________________________________________________________________________________________________________________________________________________________
3. Special features & Rainfall
___________________________________________________________
___________________________________________________________
Major Cities: List 3 Major Cities found in this region and note their
elevation and rainfall.
1. ___________________________________________
2. __________________________________________
3. ___________________________________________
Vegetation: List 5 common plants found in this region.
1. _____________________
2. _____________________
3. _____________________
4. _____________________
5. _____________________
List 5 rare or endangered plants and their location within this region
1. _____________________
2. _____________________
3. _____________________
4. _____________________
5. _____________________
List 5 common animals found in this region
1. _____________________
2. _____________________
3. _____________________
4. ____________________
5. _____________________
List at least 3 rare or endangered animals
and their habitat found in this region
1. _____________________
2. _____________________
3. _____________________
Continue exercise completing the same information for the other Major Ecological Regions.
Topography:
1. Size of Blackland Prairie ______________
2. Land characteristics _________________________________________________________________________________________________________________________________________________________________________________
3. Special features & Rainfall
___________________________________________________________
___________________________________________________________
Major Cities: List 3 Major Cities found in this region and note their
elevation and rainfall.
1. ___________________________________________
2. ___________________________________________
3. ___________________________________________
Vegetation: List 5 common plants found in this region.
1. _____________________
2. _____________________
3. _____________________
4. _____________________
5. _____________________
List 5 rare or endangered plants and their location within this region
1. _____________________
2. _____________________
3. _____________________
4. _____________________
5. _____________________
List 5 common animals found in this region
1. _____________________
2. _____________________
3. _____________________
4. _____________________
5. _____________________
List at least 3 rare or endangered animals
and their habitat found in this region
1. _____________________
2. _____________________
3. _____________________
Topography:
1. Size of South Texas Brush Country_________________________
2. Land characteristics _________________________________________________________________________________________________________________________________________________________________________________
3. Special features & Rainfall
___________________________________________________________
___________________________________________________________
Major Cities: List 3 Major Cities found in this region and note their
elevation and rainfall.
1. ___________________________________________
2. ___________________________________________
3. ___________________________________________
Vegetation: List 5 common plants found in this region.
1. _____________________
2. ____________________
3. ____________________
4. ____________________
5. _____________________
List 5 rare or endangered plants and their location within this region
1. _____________________
2. ____________________
3. _____________________
4. _____________________
5. _____________________
List 5 common animals found in this region
1. _____________________
2. _____________________
3. _____________________
4. _____________________
5. _____________________
List at least 3 rare or endangered animals
and their habitat found in this region
1. _____________________
2. _____________________
3. _____________________
10. Turn off Major Regions and turn on Subregions of Bexar Co.
1. What Subregion is your neighborhood found in? ____________________
2. What Subregion is your school found in?__________________________
3. What Subregions are found in Edwards Plateau Region?
____________________________________________________
4. What Subregions are found in the Blackland Prairie? ____________________________________________________
5. What Subregions are found in the South Texas Brush Country?___________________________________________________
Now that you have a working knowledge of the Major and Subcatagories
of ecological regions, it is time to apply this information.
11. Turn off the Major Regions & Subregions themes and turn on Vegetation. Take a few minutes and use the “Hot Link” button to identify and look at examples of each of the types of vegetation categories found in the Bexar County area.
1. Is there a pattern to which types of plants grow where?
2. Do certain types of plants only grow in one region and not others?
Why do you think that is?
3. Can you discern the Major or Sub Region ecosystems based only on
the vegetation map?
a. What does that tell you about those regions?
4. Why is there an unidentified area in the downtown region of San Antonio?
a. If this were 100 years ago, what types of plants do you think would
be growing in the downtown area of San Antonio? What evidence are
you basing your decision on?
5. Looking at the various plant populations, rainfall, & geology,
what do you think is the major feature that discerns one region from another?
Overview
Students will interact with GIS website to ascertain the population
demographics of their neighborhood, modes of transportation and the population
explosion.
Time Frame
2- 45 minute class periods
Objectives
? To analyze the population of the students’ neighborhood, military
bases, and people ages 50-59
? To analyze population based on race distribution
? To analyze population based on modes of transportation
? To analyze the population explosion base on country by accessing
several different websites pertain to population change
Materials
? Computers with access to Internet
? GIS website
? Curriculum Handout
Texas Essential Knowledge and Skills
§112.44. Environmental Systems.
(1) In Environmental Systems, students conduct field and laboratory
investigations, use scientific methods during investigations, and make
informed decisions using critical thinking and scientific problem solving.
Students study a variety of topics that include: biotic and abiotic factors
in habitats; ecosystems and biomes; interrelationships among resources
and an environmental system; sources and flow of energy though an environmental
system; relationship between carrying capacity and changes in populations
and ecosystems; and changes in environments.
(2) Scientific processes. The student uses scientific methods during
field and laboratory investigations. The student is expected to:
(C) organize, analyze, evaluate, make inferences, and predict trends
from data; and
(D) communicate valid conclusions.
(3) Scientific processes. The student uses critical thinking and scientific
problem solving to make informed decisions. The student is expected to:
(A) analyze, review, and critique scientific explanations, including
hypotheses and theories, as to their strengths and weaknesses using scientific
evidence and information;
(7) Science concepts. The student knows the relationship between
carrying capacity and changes in populations and ecosystems. The student
is expected to:
(A) relate carrying capacity to population dynamics;
(B) calculate exponential growth of populations;
(C) evaluate the depletion of non-renewable resources and propose alternatives;
and
(D) analyze and make predictions about the impact on populations of
geographic locales, natural events, diseases, and birth and death rates.
(8) Science concepts. The student knows that environments change. The
student is expected to:
(A) analyze and describe the effects on environments of events such
as fires, hurricanes, deforestation, mining, population growth, and municipal
development;
11) How many families live in your area?
12) What is the total population for the area in which you live?
12) Are there more males or females?
B) Military Bases.
1) Turn on Military Bases theme.
2) Turn off streets and census tract themes.
3) Choose a miltary base and identify it.
4) Compare the population of your census tract with that of the military. (You’ll need to turn census tract theme on now.)
5) What are the differences in total population and why?
C) Ages 50-59
(Lightest sections refer to least amount. Darkest sections refer
to most amount.)
1) Turn on the Ages 50-59 theme with all other themes off.
2) Find and identify the census tract with the largest area and the
highest population of Ages 50-59.
3) Find and identify the census tract with the largest area but with
the smallest population.
4) Explain the reason for this difference in population for Ages 50-59
for these census tracts. Use common knowledge and other themes such as
places and military bases to help you.
(Remember: only the highest theme in the legend turned on will be identified.
So you may need to turn on themes one at a time.)
D) Race and Population Distribution
(Lightest sections refer to least amount. Darkest sections refer
to most amount.)
1) Compare and contrast the three themes of African Americans, Hispanics,
and Whites by turning on each theme separately.
2) Describe what population patterns you see for each.
3) Why do you think these groups show the pattern that they do?
E) Population & Transportation: (% Walk & Bike)
(Lightest sections refer to least amount. Darkest sections refer
to most amount.)
Description of themes:
% Walk & Bicycle (% of population who walk and ride their bicycle
to work).
% Drivers (% of population who drive, ride a motorcycle, or carpool
to work).
% Bus Taxi & Other (% of population who ride the bus, take a taxi
or use any other mode of transportation to get to work)
1) Turn on % Walk and Bicycle theme with all other themes off.
2) Describe the pattern you observe
3) Find the three highest areas and determine what type of place these
areas are.
(Use other themes.)
F) Population & Transportation: % Drivers
(Lightest sections refer to least amount. Darkest sections refer
to most amount.)
1) Turn on the % Drivers theme with all other themes off.
2) Identify the area with the highest % of people who drive to work.
3) What type of place is that area and what is the % drivers?
4) How is this map representation misleading?
(Hint: This map is based on percent not actual population)
5) How could this map be dangerous for an environmental scientist?
G) Population & Transportation: % Bus, Taxi, & Other
(Lightest sections refer to least amount. Darkest sections refer
to most amount.)
1) Turn on the % Bus Taxi & Other theme with all other themes off.
2) What general trend do you find in the geographical distribution
of these percentages?
3) What is rational explanation for this distribution pattern?
Extension: Related Website Exercises
Exercise 1
1) Go to: www.census.gov/cgi-bin/popclock.
2) Find the population projection for the current time.
3) Go to Historical National Population Estimates. Find your
birth year and compare the population projection for today with the population
when you were born.
4) Go to Projections link on first page. Click on Population estimates,
then County, then County Population Estimates for7/1/99 and Population
Change: 7/1/98-7/1/99.
a) How much has the population in your county grown within the last
year?
b) Multiply your answer by 20 to see what the population might reach
in 20 years.
c) Compare that number to the current county population. Is it a significant change?
d) Do you think resources will be available in the future to support
this rate of growth for future generations?
Exercise 2
1) Go to: www.pbs.org/kqed/population_bomb/
2) Click on Danger, then Population Timeline.
a) Compare population growth from 1800 - 1900 with 1903 - present.
3) Go to What Price? Look at the graph. Notice that the US population
is the lowest percentile and look at the percentage of hazardous waste
we produce, and how much energy and fossil fuel we consume.
a) What would you propose to make the United States more environmentally
responsible?
4) Go back to the Home page. Click on Hope then Learning Tools.
a) What is the estimated population in 2020.
5) Go back to Home page. Click on Action, then Who Can Help? Select
one of the websites for the organizations that are listed and read about
it.
a) What does this organization do?
Exercise 3
1) Go to: www.xist.org/index.htm.
2) Click on Charts, then Area.
a) Which 3 countries are largest?
b) Compare their size to their population by going to Population.
Calculate to find which of these three countries has the most dense population.
c) Compare this to the country with the most dense population overall
by going to Population, then Density.
Exercise 4
1) Go to: http://zebu.uoregon.edu/1998/es202/archive/l13.html
2) Look at the chart of US Population Change.
a) Which region has the highest growth rate in the US?
3) What is ZPG?
4) Scroll down and compare female literacy rate to birth rate.
a) What is the overall trend
b) Taking this information into consideration, do you feel education
is more important than ever?
5) Scroll down to “Run Applet”. Click Run. Exponential Growth
is demonstrated.
a) View Habitat and View Graph
b) Determine how many generations it takes to fill the screen.
6) Reset and change birth rate to 3 which is the highest population
growth rate depicted in the map of World Population Growth Rate.
Click Run.
a) Compare how many generations it takes to fill the screen with this
birth rate to the previous number of generations.
Overview
Students will interact with GIS website to analyze water resources
in Bexar County. This information will allow students to determine
how solid waste sites may affect water resources.
Time Frame
2- 45 minute class periods
Objectives
? To analyze the different aquifers and recharge zones of Bexar County
? To use spatial analysis to determine which landfills and Superfund
sites would be problematic to the water resources of the county.
? To determine the status of various Superfund sites.
Materials
? Computers with access to Internet
? GIS website
? Curriculum Handout
Texas Essential Knowledge and Skills
§112.44. Environmental Systems.
(1) In Environmental Systems, students conduct field and laboratory
investigations, use scientific methods during investigations, and make
informed decisions using critical thinking and scientific problem solving.
Students study a variety of topics that include: biotic and abiotic factors
in habitats; ecosystems and biomes; interrelationships among resources
and an environmental system; sources and flow of energy though an environmental
system; relationship between carrying capacity and changes in populations
and ecosystems; and changes in environments.
(3) A system is a collection of cycles, structures, and processes that
interact. Students should understand a whole in terms of its components
and how these components relate to each other and to the whole. All systems
have basic properties that can be described in terms of space, time, energy,
and matter. Change and constancy occur in systems and can be observed and
measured as patterns. These patterns help to predict what will happen next
and can change over time.
(2) Scientific processes. The student uses scientific methods during
field and laboratory investigations. The student is expected to:
(C) organize, analyze, evaluate, make inferences, and predict trends
from data; and
(D) communicate valid conclusions.
(3) Scientific processes. The student uses critical thinking and scientific
problem solving to make informed decisions. The student is expected to:
(A) analyze, review, and critique scientific explanations, including
hypotheses and theories, as to their strengths and weaknesses using scientific
evidence and information;
(5) Science concepts. The student knows the interrelationships
among the resources within the local environmental system. The student
is expected to:
(A) summarize methods of land use and management;
(B) identify source, use, quality, and conservation of water;
(C) document the use and conservation of both renewable and non-renewable
resources;
(D) identify renewable and non-renewable resources that must come from
outside an ecosystem such as food, water, lumber, and energy;
(E) analyze and evaluate the economic significance and interdependence
of components of the environmental system; and
(F) evaluate the impact of human activity and technology on land fertility
and aquatic viability.
(7) Science concepts. The student knows the relationship between carrying
capacity and changes in populations and ecosystems. The student is expected
to:
(A) relate carrying capacity to population dynamics;
(B) calculate exponential growth of populations;
(C) evaluate the depletion of non-renewable resources and propose alternatives;
and
(D) analyze and make predictions about the impact on populations of
geographic locales, natural events, diseases, and birth and death rates.
§112.49. Geology, Meteorology, and Oceanography.
(10) Science concepts. The student knows the interactions that
occur in a watershed. The student is expected to:
(A) identify the characteristics of a local watershed such as average
annual rainfall, run-off patterns, aquifers, locations of river basins,
and surface water reservoirs;
(C) describe the importance and sources of surface and subsurface water.
Surface water begins as runoff from precipitation, springs, or snow melts. The combination of these three creates rivers, streams, and sometimes lakes. When a body of water passes over a ground surface that is permeable, or porous, then water seeps through the porous rock or soil and enters the ground. Sand, gravel, and sedimentary rock are all permeable layers. Water continues to move downward through the permeable layer until it reaches an impermeable layer. When the water reaches the impermeable layers and all of the pores fill up it is known as the zone of saturation. The area above the zone of saturation, in which the pores are filled partially with air, is known as the zone of aeration. The junction of the two zones is called the water table.
An aquifer is the soil or rock layer that contains water. The Edwards Aquifer is the primary water source for San Antonio. You may have heard about the concern for the Edwards Aquifer level (http://www.saws.org) on the news.
Water, in an aquifer, moves like an underground river. The region where water enters the aquifer is called the recharge zone. Outcrops are regions where the aquifer reaches the ground surface and are often areas of recharge. The Edwards outcrop is the recharge zone for the Edwards Aquifer.
1. Turn off all of the themes except Bexar County.
2. Click on the theme for the Edwards Aquifer.
3. What color is the recharge zone?
4. Where is it approximately located?
The Edwards Aquifer is not the only aquifer in Bexar County. Bexar County contains two other significant aquifers.
5. Turn off Edwards Aquifer theme and click on the themes for the other
aquifers in Bexar County.
6. What are the names of these two aquifers?
Although the Edwards Aquifer is not the only aquifer in Bexar County, it is the primary source of drinking water for San Antonio. With the explosion of population in San Antonio in the last 20 years, water has been a great concern.
7. At http://texas.sierraclub.org/alamo/January99Newsletter.html, look at the sections entitled “SAWS Water Procurement Actions” & “San Antonio Needs Smart Growth”.
8. What are some concerns with the current growth of population?
9. Look at http://encarta.msn.com
10. In what direction has most of the population growth expanded?
11. What is the potential problem with this expansion?
12. Look at: http://www.saws.org. Link to Sensitive Land Acquisition Program.
13. What is the goal of this program?
14. How will this help the population expansion problem?
Population growth is a concern because of contamination. Contamination of limestone aquifers occurs easily. Because the Edwards Aquifer recharge zone is located at an outcrop, the potential for chemicals to seep through cracks and crevices of the limestone is very high. Oil and gasoline runoff from roads, highways, and driveways, homeowner’s improper use of pesticides and herbicides, and wastewater from septic tanks can all contaminate drinking water.
15. Turn on the themes for land use (commercial, industrial, residential)
and Edwards Aquifer. Turn all other themes off.
16. Which land use is most abundant?
17. How might residential land use effect the aquifer?
18. What can you do to maintain the cleanliness of our drinking water?
19. Turn on landfills theme.
20. What landfills are problematic for the Edwards Aquifer?
21. How many Landfills are open (O), closed (C), or potential sites
(P)?
22. Why do you think so many are closed?
23. Go to www.epa.gov/superfund/ to find out about Superfund.
What is it?
24. Find the Superfund sites in Bexar County from the links on this
site. List them.
25. What types of facilities are a majority of them?
26. Why do you think this is so?
27. Look at Kelly AFB. What Actions have been taken on this site?
28. When was this site discovered?
29. What is the most current action taken?
30. Look at R&H Oil. What Actions have been taken?
31. Why do you think community involvement as an action is important?
32. Turn on Superfund sites theme.
33. Identify the six Superfund sites on the map.
34. How many of these are on the current list of Superfund sites on
the EPA web site.
35. Why might this be so?
36. What does this say about the reliability of data on maps?
Overview
Students will interact with GIS website to analyze air quality in Bexar
County. This information will allow students to determine how point
sources and non-point sources affect air quality.
Time Frame
2- 45 minute class periods
Objectives
? To research sources of air pollution from the TNRCC and EPA website,
? To determine pollution levels of different point sources,
? To use spatial analysis of pollution levels to determine non-point
sources,
? To determine the contribution Air Force bases have on air pollution,
? To determine when ozone exceedances occur.
Materials
? Computers with access to Internet
? GIS website
? Curriculum Handout
Texas Essential Knowledge and Skills
§112.44. Environmental Systems.
(1) In Environmental Systems, students conduct field and laboratory
investigations, use scientific methods during investigations, and make
informed decisions using critical thinking and scientific problem solving.
Students study a variety of topics that include: biotic and abiotic factors
in habitats; ecosystems and biomes; interrelationships among resources
and an environmental system; sources and flow of energy though an environmental
system; relationship between carrying capacity and changes in populations
and ecosystems; and changes in environments.
(3) A system is a collection of cycles, structures, and processes that
interact. Students should understand a whole in terms of its components
and how these components relate to each other and to the whole. All systems
have basic properties that can be described in terms of space, time, energy,
and matter. Change and constancy occur in systems and can be observed and
measured as patterns. These patterns help to predict what will happen next
and can change over time.
(2) Scientific processes. The student uses scientific methods during
field and laboratory investigations. The student is expected to:
(C) organize, analyze, evaluate, make inferences, and predict trends
from data; and
(D) communicate valid conclusions.
(3) Scientific processes. The student uses critical thinking and scientific
problem solving to make informed decisions. The student is expected to:
(A) analyze, review, and critique scientific explanations, including
hypotheses and theories, as to their strengths and weaknesses using scientific
evidence and information;
§112.49. Geology, Meteorology, and Oceanography.
(9) Science concepts. The student knows the role of natural energy
resources. The student is expected to:
(A) research and describe the origin of fossil fuels such as coal,
oil, and natural gas;
(B) analyze issues regarding the use of fossil fuels and other renewable,
non-renewable, or alternative energy resources; and
(C) analyze the significance and economic impact of the use of fossil
fuels and alternative energy resources.
(12) Science concepts. The student knows the characteristics
of the atmosphere. The student is expected to:
(A) identify the atmosphere as a mixture of gases, water vapor, and
particulate matter;
(B) analyze the range of atmospheric conditions that organisms will
tolerate including types of gases, temperature, particulate matter, and
moisture; and
(C) determine the impact on the atmosphere of natural events and human
activity.
A) In your computer’s web browser, go to http://www.tnrcc.state.tx.us/air/aqp/pollsource.html#Point to learn about air pollution.
1) Sources of air pollution are organized into what categories?
Give descriptions of each category.
B) How are CO, NO2, VOC, SO2, and Particulate Matter harmful?
1) Refer to the following websites to research the answer.
i) http://www.epa.gov/globalwarming/emissions/index.html
ii) http://www.epa.gov/airmarkets/acidrain/
iii) http://www.epa.gov/oar/oaqps/gooduphigh/
iv) http://www.epa.gov/OMSWWW/04-ozone.htm
v) http://www.epa.gov/OMSWWW/02-toxic.htm
C) Go to http://129.115.242.148/gis/main.html and begin the Air Quality Module.
Turn on the Point Sources theme.
Using the Identify button determine the following:
(Remember: You need to click directly in the center of the icon)
1) Which plant has the highest CO?
2) Which plant has the highest NO2?
3) Which plant has the highest SO2?
4) Which plant has the highest VOC?
5) Which plant has the highest particulate matter?
6) Which plant has the highest total emissions?
D) Use the hotlinking button to view each company’s website. You may
need to adjust the size of the frame on the right side of the screen by
dragging the left edge of the frame to see the full site.
1) What kind of industrial processes do these plants use to create
these pollutants?
E) Turn on the air monitoring sites.
1) Where are most of them located? Why?
2) Notice the air monitoring site in the south eastern corner of Bexar county. Why do you think the state placed and air monitoring site down there? (Hint: What point sources is it near?)
3) Turn off the air monitoring sites theme and turn on Ozone daily levels.
What do you notice about the level of ozone at the southeastern monitoring
site relative to the other air monitoring sites?
F) Questions from CPS site.
Helpful websites:
http://www.epcor-group.com/company+info/epcor+generation/coal+to+electricity/index.htm
http://www.epcor-group.com/company+info/epcor+generation/gas+to+electricity/index.htm
1) From what sources does CPS generate electricity?
Go to http://www.citypublicservice.com/default.htm and go to Business
Information, then CPS facts.
2) What are the two major types of emissions that result from these
processes?
3) What are some of the alternatives to using fossil fuels for the generation
of electricity? http://www.windtricity.com/ go to Renewable
Energy.
4) What other major source of energy is not mentioned on CPS’ list?
5) See if you answer was correct by going to http://www.stpnoc.com/.
6) What is the relationship between CPS and this station?
7) Why might CPS not want advertise this source as prominently as the
others?
G) Questions from Lackland AFB site.
Helpful website: http://www.aacog.dst.tx.us/1996%20Emissions%20Inventory/1996%20E%20I/1996EI_AirMilitary.html#LacklandAir
1) What types of sources are responsible for the majority of Lackland
AFB’s emissions?
2) Give two examples of an on-road mobile source?
3) What are the five major types of emissions that result from on-road
mobile sources?
4) Which of the four categories of on-road mobile sources had the highest
percentage of VOC emissions? What is that percentage?
5) Why do you think this category had the highest percentage of VOC
emissions?
H) Questions for SA Airport: (Use the same website as Lackland AFB)
1) State the characteristics that lead to good atmospheric dispersion
of pollutants.
2) What were some of the major sources at the San Antonio International
Airport that played a key part in the production of pollutants?
3) The majority of VOCs at the San Antonio International Airport was
a result of which of the following sources?
i) Aircraft
ii) Fueling Ops
iii) Parking Lots
iv) GSE/AGE/APU
4) Why do you think airplanes are a major source of VOC pollutants at the San Antonio International Airport?
Nitrogen Oxides (NOx)
A) Go to http://www.epa.gov/oar/oaqps/nox/what.html for information on what nitrogen oxides are and where they come from.
1) How are nitrogen oxides formed?
2) What is the primary source of nitrogen oxides?
3) If you wanted to reduce the total amount of nitrogen oxide emissions,
which source would you initially focus on and why?
4) Rank these various motor vehicles in terms of which reduce nitrogen
oxide emissions:
o 2000 Honda Accord (midsize car that gets 31mpg on the highway)
o 2000 Honda Civic HX (compact car that gets 43mpg on the highway)
o 2000 Honda Passport (sport utility vehicle that gets 20mpg on the
highway)
B) Turn on the NOx theme.
1) Note the locations of the monitoring stations. Of the seven,
only four currently measure NOx. Determine these four by using the
identify button.
Answer the following questions based on those four monitoring stations.
2) Which stations are located closely to major highways?
3) Which stations are located closest to downtown San Antonio?
4) Which two stations would you expect to have the highest traffic volume?
5) Which two have the highest NOx readings for 7:00?
6) What is the relationship between the two stations with the
highest traffic volume and the two stations with the highest NOx readings?
7) Answer questions 5 & 6 for 18:00.
8) Use the Identify button to identify the monitoring station directly
in the center of the city. At what times do the NOx peak?
Why?
9) How would the use of public transportation such as buses or carpooling
effect levels of NOx emissions?
C) Go to http://www.epa.gov/oar/oaqps/nox/hlth.html for information on the environmental effects of nitrogen oxides. Pay particular attention to the ground-level ozone (smog) paragraph and how NOx reacts to form ozone.
1) How would reducing NOx levels effect levels of ozone?
2) Use the Identify button on the monitoring station to the right of
the center monitoring station. In general, are the NOx readings higher
in the daytime or at night? Why would this be?
3) Why does the ozone season in Texas occur from April to October?
4) Could it be possible for a city to completely eliminate all nitrogen oxide emissions and still have an ozone problem? If so, how?
OZONE:
A) Helpful website: http://www.tnrcc.state.tx.us/air/monops/ozoneinfo2.html
1) What is ozone and how is it chemically formed?
2) What are some sources?
3) When are ozone levels the highest?
4) What is the ozone level standard set by the Federal Clean Air Act
in ppb?
B) The data in the Ozone daily level theme is an average eight hour
high recorded in parts per billion for the month of September 2000.
1) Turn the Ozone theme on.
2) Using the Identify button, determine which sites on which days had
exceeded the ozone standard.
3) Using the hotlink button, click on those sites that had exceedances.
4) What parameters does each site monitor?
5) On the hotlinked website, go to the Current Measurements Link, choose the exceedance date and generate a report for that day.
6) What is the relationship between ozone levels, temperature, and wind
speed for these days?
Extension:
Using your web browser, go to http://www.tnrcc.state.tx.us/cgi-bin/monops/8hr_monthly.
1) Generate reports for each month and determine which months had the
most exceedances. (Houston is a good indicator city)
Audet, R., Abegg, G. 1996. Geographic information systems: Implications for problem solving. Journal of Research in Science Teaching. v33, Jan 1996, pp.21-45.
Audet, R., Paris, J. 1997. GIS implementation model for schools: Assessing the critical concerns. Journal of Geography. v96, Nov/Dec 1997, pp.293-300.
Brown, S. 1999. Teaching With a GIS Using Existing Grade 7-12 Curricula. Ph.D. dissertation. SUNY College of Environmental Science and Forestry.
Center for Image Processing in Education. 1998. Discovering GIS. National Science Teachers Association Conference Workshop. Las Vegas, Nevada. April 14, 1998.
Dewey, J. 1938. Experience and Education. New York: Collier.
Environmental Systems Research Institute. 1998. Explore Your World. Redlands, CA. Environmental Systems Research Institute, Inc.
Fazio, R., Keranen, K. 1995. Mapping a Course with GIS. The Science Teacher. v62, March 1995, pp.16-19.
Fund For the Improvement of Postsecondary Education (FIPSE) Project Descriptions. 1999. The Distributed Geographic Information Education Classroom and Training Lab on the World Wide Web. www.ed.gov/offices/OPE/FIPSE/99ProgBk/eECp212.html [September 11, 2000].
Goodchild, M.F., Kemp, K.K. 1990. The NCGIA Core Curriculum
in GIS. Santa Barbara, California: National Center for Geographic
Information and Analysis.
Kingston, R., Turton, I., Carver, S., Evans, A. 2000. Web-based
public participation geographical information systems: An aid to local
environmental decision-making. Computers, Environment and Urban Systems.
v24, (2) pp.109-125.
Mackaness, W. 1994. Curriculum issues in GIS in K-12. GIS/LIS Annual Conference and Exposition, Phoenix, Arizona. p.560-8.
McClurg, P., Lerner, H. 1998. Earth System Science Internet Project Widens Wyoming Students’ World. Geo Info Systems. v8 (3), pp.34.
Plewe, B. 1997. GIS Online: Information Retrieval, Mapping, and the Internet. Sante Fe, NM. OnWard Press. 1st edition. August 1, 1997.
Ramirez, M. 1996. A driving force in technology education: Geographic information systems. TechTrends v41, March 1996, pp.34-36.
Ramirez, M., Althouse, P. 1995. Fresh thinking: GIS in environmental education. Technical Horizons in Education Journal. v23 (2), September 1995, pp.87-90.
Ter Haar, P. 1997. Internet-based GIS: the next step on the desktop. Geomatics Info Magazine. v11 (6), 1997 pp.6-9.
Van Demark, P. 1992. Where is desktop GIS headed?
Urban and Regional Informations System Association (URISA) Proceedings.
v3 (2), pp.54-61.
Ruth Lin Cheung
University of Texas at San Antonio
Department of Earth and Environmental Sciences
6900 N. Loop 1604 West
San Antonio, Texas 78249-0663
(210) 458-4956
rlcheung@hotmail.com
Stephen C. Brown
University of Texas at San Antonio
Department of Earth and Environmental Sciences
6900 N. Loop 1604 West
San Antonio, Texas 78249-0663
(210) 458-4956
sbrown@utsa.edu