The Georgia Department of Community Affairs (DCA) has released its Web-enabled decision support tool - PlanBuilder. A key component of PlanBuilder is its ability to display MapViews using ArcIMS technology. The MapViews are prepared for 159 Georgia counties and up to 100 different map themes from land use to community facilities. The MapViews are integrated with an online knowledge base and other decision support components including DataViews (demographic and economic data), a data calculator, and data visualization.
The Georgia Department of Community Affairs (or DCA as we like to call it) is in the business of helping Georgia’s communities realize their dreams for growth, development and improving quality of life. In order to keep with this tradition we sometimes need to break tradition, be cutting edge with the latest in communications and information technology so that our assistance is current, beneficial and viable.
PlanBuilder has evolved from a simple idea - that we needed to do a better job of delivering information to and from communities faster, more efficiently and with more accessibility. With the popularity and convenience of the Internet, that idea became a very realistic proposition. We wanted to build a “Digital Nervous System” connecting local and regional governments with the state’s information system. This idea manifested itself as PlanBuilder - a Web-Enabled Application for Planning, Decision Support and Knowledge Management.
Let’s face it; assisting communities with growth and development issues is a complicated process. Each community has its own ideas and priorities on planning and managing growth. There are a few things we can do to help. But first we have to get the information and tools in their hands. By using the World Wide Web, we can provide on-line decision support, knowledge management, word processing, data visualization and GIS tools to virtually anybody who knows how to open a browser and get on the Internet.
As a planning tool, PlanBuilder will help you get organized. Since all of your planning tasks can be done on-line and at your desk, time is not wasted looking for hard to find documents, reports, letters, and data. Your work won’t get lost between the cracks, behind your desk, or “in the mail”. You may occasionally have to search for a digital document but you can let the computer search your file system while you take care of other business.
The developers of PlanBuilder have anticipated that you might want to look at a related document or get additional information. These electronic documents are provided with “hyperlinks” that take you directly to the document and open it automatically. For most of you, who have spent any time on the Internet, this is not new or very exciting (I’ll get to that stuff later) but for those planners still writing plans the old fashioned way, this can be quite enlightening.
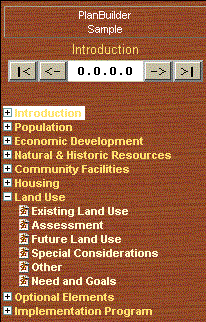
PlanBuilder provides you with a Table of Contents, organized by Planning Element, Topics and Subtopics within each of these Elements. The support documentation and resources needed to complete the plan are linked directly to each topic so that you get just the information you need when you need it.
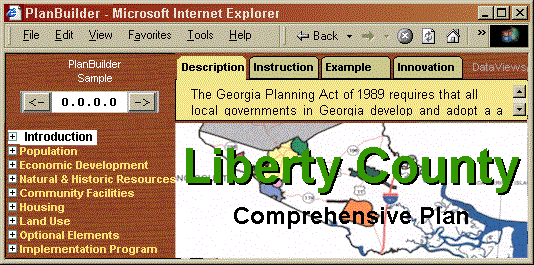
Besides being more organized we also want you more efficient and to plan smarter, so at DCA we’ve done a little organizing of our own and created what we call a Planning Knowledge Base. This knowledge base provides everything you ever wanted to know about writing a comprehensive plan but were afraid to ask (or at least didn’t know quite how to ask it on your computer). At the top of PlanBuilder we have placed four file folders (manila colored - with tabs). They look just like the ones you keep in your file cabinet or desk drawer. These four folders contain the expert knowledge that we have begged, borrowed or stolen from years of comprehensive planning. They include Description, Instruction, Example and Innovation tabs that you can click on when you need to see them.
Most experienced planners won’t need the Description knowledge which gives you an overview of the planning elements but it does come in handy for new planners or a new mayor that wants to gain a better understanding of what is contained in a comprehensive plan.
Planners will want to keep the Instruction Folder open if only to make sure that the plan adheres to the state’s minimum standards set forth in the Planning Act of 1989. Step by step instructions will tell you everything you need to do to comply.
If you get stuck on what to write or how to say it just click on the Example Tab to see what other planners have written in the past. We don’t mean to cramp your creative style we just want to give you a little push and perhaps save you some time for the more important things in life – like implementing a short term work program.
And let’s not forget the Innovation tab for those of you who want to go the extra mile. Take a look at some new ideas, some proven strategies and opportunities that might put you on the path to better quality community objectives.
What exactly is a decision support system? For sake of argument we’ll say it is any information or application that presents itself in a manner that will help you make decisions. In the case of planning, these decisions might be used to determine what are the best alternatives for economic development, growth management strategies or future land use.
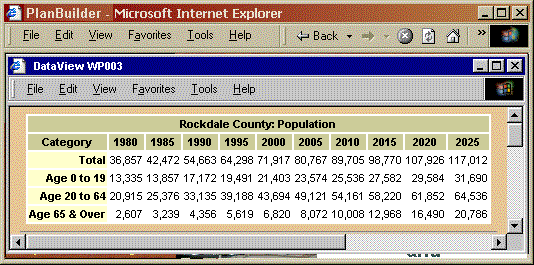
PlanBuilder integrates and leverages Data Tables (or DataViews as we call them), a Data Calculator, Data Visualization and GIS as Decision Support Tools to support your planning decisions. We've got demographic data like population, age, race. We've got your Economic data, Education data, Housing data. You ask for it. We got it. Just click on the menu and up pops a data table. We even have that hard to find historical data and projections as well.
In the past DCA published hard copy books called “Data for Planning” and “Using Data for Planning”. If you are familiar with these books, the on-line DataViews look very similar. We figure this would make the data easy to use and at the same time very convenient for editing within PlanBuilder or within your favorite spread sheet program. You simply copy the tables, rows or columns that you want to use and paste them into your favorite spreadsheet program or directly into the PlanBuilder Editor.
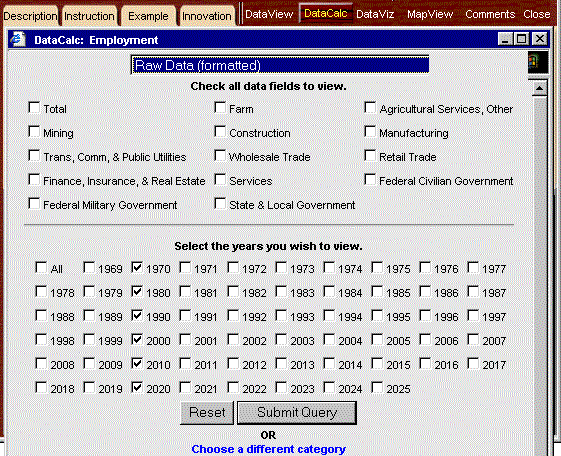
A Data Calculator allows you to customize the DataViews in order to view different years and different categories or calculate percentages. Sometimes you need more than Data Tables to understand or grasp the trends – that’s where the Data Visualization comes in. Data Visualization takes DataViews a step farther by using graphs and charts to visualize the same data in a way that is more meaningful.
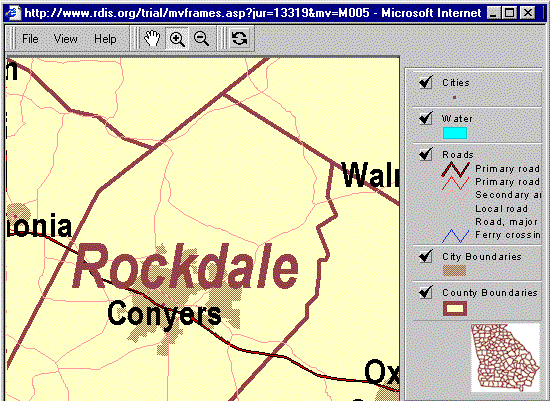
And one of the most important decision support tools is the use of Geographic Information Systems or GIS. In order for GIS to be user friendly enough for non-technical folks we removed the complex parts and left you with the good stuff. In fact we even gave GIS a friendlier name – MapViews. The base map and required data layers for over 100 MapViews have been set up ahead of time back at the DCA offices. The system already knows your location and what layers you will need for any particular planning element or topic. So all you have to do is click on a few buttons to change your view. View different locations with pan and zoom. Turn on and off layers. And click on different features to get more information.
Now that's organization – only the information you need – when you need it. Besides being easy to use PlanBuilder provides much more power via the web. You not only have access to your local data, you can view every other jurisdiction’s data and maps as well. So if you want to see how fast your surrounding counties are growing or what the landuse looks like in other parts of the state. It’s all at your fingertips on your desktop. When you are done writing your plan and it is approved, DCA will host it as part of the Georgia Community Network web site, for all the world to see.
Because PlanBuilder was designed for Workgroups, there is opportunity for many folks to contribute comments, ideas, and strategies. Once consensus is built (on-line) the plan is subject to public scrutiny. A PlanViewer is available to allow any interested citizen to view the final published plan from their desktop. If a government agrees to do something in the plan, exposing this plan on-line for all to see will provide additional incentive for the government to do what they said they would do. In other words, they are held accountable.
Once we built the basic engine for PlanBuilder we knew we had something special. After all its not only planners that want to Get Organized, Get Smarter and Make Better Decisions. So we decided that if we played our cards right and were careful how we built this thing, we could use PlanBuilder as a Framework to develop other applications with similar traits. We could build it using one of those fancy Object Models or Component Object Models (COM) is how the programmers say it. This would let us re-use the code for other applications or plug in somebody else's components or tools if need be. Boy, what a blessing that turned out to be. We can now build a prototype of a new application using the components we’ve already built in less than a day and we don’t have to pay those high falutin programmers a dime until we need something we haven’t built before. And it just so happens we got plenty of new opportunities where people want to get organized, get smarter and make better decisions: Zoning Ordinance Builder, Environmental Ordinance Builder, Our Governor’s got a whole lot of new ideas that these tools will work just fine with - a Green Space Initiative, a new Transportation Authority that studies Development Impact, a new Technical Authority that looks at agency's Strategic Plans. We are coming around full circle by actually using this thing to rewrite our Planning Act.
So lets take a closer look to see how these new fangled components work:
At the heart of PlanBuilder is a SQL Server Database that houses the Knowledge Base, the Plan in progress, the Table of Contents or Hierarchy of topics, User information, Decision Support Data like Demographic and Economic Data, even the GIS data. All of this information is accessed via the Web using Microsoft’s Active Server Pages (ASP) and XML technologies (in case you're interested). Here are some of the components: the TOC Navigator, the Knowledge Base, the Plan Editor, DataViews, and MapViews.
The Table of Contents for the plan is hierarchical and allows a user to expand and contract the content by simply clicking on a plus (+) or minus (-) sign. The user navigates to the element or topic of interest by pointing and clicking on the particular subject.
Since each item in the TOC is represented as a record in a database, the user can also navigate by using a standard data control that allows them to move one record at a time forward or backward, moving to the beginning or the end (just like your VCR). The Topic Name and Topic Number are displayed in a box at the top of the TOC for confirmation.
The TOC navigator also controls the display of content from the Knowledge Base and the Plan Editor. This control synchronizes all of the content and data displayed in all the views by updating these view windows every time the user selects a new topic.
The PlanBuilder Knowledge Base contains the body of knowledge of planning specialists and experts in the field as well as the facts and rules needed to complete the comprehensive plan. A key to making the PlanBuilder easy to use is in the organization and presentation of information. This information can be in the form of descriptions, instructions, examples, innovative ideas, strategies and help. The information can also take the form of data tables, spreadsheets, charts, maps and other types of data visualization.
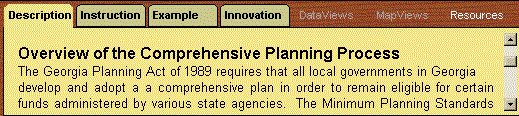
The context by which this information is displayed changes according to the user's perspective. For each topic in the TOC there are tabs that allow the user to select what type of information is appropriate. A first time user may want to select the description tab to get an overview of the topic or help to better understand how to use the system. Experienced planners might want to select example text to quickly update the plan with appropriate text. The knowledge base is comprised of four tabs that allow users to navigate between context information. Viewing the Knowledge Base category in context with each of the topics in the TOC is what leverages the Knowledge Management aspect of PlanBuilder.
The Plan Editor acts like a simple word processor to enter text, format, cut, and paste text and tables between documents. The planner can format the text font, size, and color through the Plan Editor tool that then interprets these style selections as HTML tags for display on the Web. Hyperlinks to other document types can also be inserted into the text.
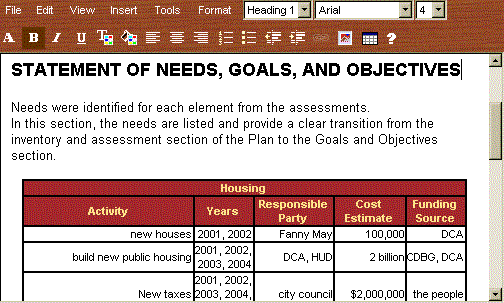
The Plan Editor allows PlanBuilder to become a Content Manager in a WorkGroup environment where planning staff can contribute various sections for submission and review. Because all of the HTML is done behind the scenes, contributors aren't required to know how to format HTML pages. Just type the content and your done.
PlanBuilder provides access to the tabular data (demographic and economic) with the DataView component. DataViews are linked directly to the plan topics so that when the planner is in a specific topic, like Population Age Distribution, the DataView control only presents tables that are related to that topic.
A Data Calculator provides customized selection of individual categories, years and percentages for simple analysis of tabular data. This tool will be expanded later to include more sophisticated statistical functions. Sometimes it takes more than tables to demonstrate the trends in your community. Charting functions help the planner discover, understand and analyze the data.
MapViews are not your father's GIS. In the past, local governments relied on GIS analysts, a scary group of people with there own way of talking and their own way of walking. These folks were wired with expensive computers and plotters. And every once in a while they would come out of the closet and show you a great big map that actually looked pretty good and could be very useful if you could just get it folded back the right way.
But now with MapViews, Maps can be produced by anyone (even Planners) on the Web with a minimum amount of expense, time and effort. In addition these maps are also interactive. You can pan and zoom, turn layers on and off, and add additional data from your desktop or anywhere on the Web. You can also point to things on the map and up pops a table telling you just what it is you are looking at. And when your done looking at it you don't even have to fold it.
"But how can this be?" you ask yourself. Well I guess we are just lucky. We had to have a couple things come together at just the right time to make this all happen. We needed:
The idea was to create a Mapping Tool that anyone could use. We wanted to leverage this geographic information by removing the barriers that have made GIS in the past not very user friendly and not very accessible. We changed the name to MapViews so that people who didn't know what GIS is or how to spell it could use it. Inherently, because these MapViews are on the WEB, the user interface is going to be easier for you to use. It's one you are already familiar with - your own friendly browser. We hid all of the technical jargon like Polygon Processing, Spatial Analysis and UTM Projections and all the other big words that scare the bejeezus out of unsuspecting planners. And instead we give you a menu of MapViews, so it's as easy as turning on and off whatever map you want to look at.
Because of the Planning Act of 1989, which said we should develop a Regional Development Information System (RDIS), we already had a pretty good idea of what geographic data was needed for a comprehensive plan. Working closely with the Regional Development Centers and the Georgia GIS Clearinghouse we could exert just enough influence to ensure we got a state wide set of geographic data that suited all your planning needs: Orthophotography, Transportation, Hydrology, Wetlands, Watersheds, Community Facilities, Natural and Historic Resources, Landuse, Boundaries all collected, digitized, projected, and most important free!
With MapViews the hard part of GIS is taken care of before you ever see the maps. Remember those scary GIS folks (oh yea, they're still around) but now they prepare this stuff ahead of time and put it all together in one big database for the entire state. The computer figures out what area of the state you need to look at, what layers should be turned on and just about everything else you need in order to create the maps for your plan. Now, if you think you can do a better job, we still give you the controls you need to Pan and Zoom, turn layers on and off, even add your own data. But at the very least we give you the data and the tools you need to get you started on your road to recovery.
ArcIMS (Internet Map Server) is the engine behind MapViews. It provides all the functionality we need to design and build the MapViews from a variety of Geographic Data Sources, manage the MapView Web Services and display the MapViews over the Internet using a customized browser. The power of ArcIMS provides the GIS component required to create and manage Georgia Planning.Net
So where are we heading...
Georgia has 159 counties and over 700 local governments in all. Think about it, if we could somehow manage all of these plans being built by PlanBuilder, leverage the knowledge contained in these plans, what a powerful tool this would be. A Digital Nervous System that truly empowers the local governments and more importantly their citizens. Comprehensive plans for over 700 local governments available at your fingertips. A search engine to search all the plans that contain the words: Green Space, Mixed Use, and Protected Mountains. What about looking at your neighboring county just to see what they might be cooking up? How about as an Economic Development Tool!
The demand for this information is growing every day. Putting this information and tools to handle the information on the Internet is the only way to go. Look at the benefits:
Our goal is to make Georgia Planning.Net available to anyone interested in a local government’s planning process, the knowledge base used to create these plans and the implementation strategy to make things happen. In essence, the community’s comprehensive plan becomes each community’s own Web Site with inventory, analysis, and geographic information on Population, Economic Development, Housing, Natural Resources, Historic Resources, Community Facilities and Land Use. PlanBuilder is the tool to develop these web sites. Georgia Planning.Net is the portal to access the community web sites.