Under the Kutztown University's Performance Outcomes Plan, which was approved by the State System of Higher Education Board of Governors on October 12, 2000, the University is to increase its enrollment of minority populations. At the present time, minority student enrollment is 5.2% at Kutztown University while the System average is 8.5%. To reach the System average Kutztown University will have to target its recruitment efforts at specific potential minority student markets. This paper reports on a pilot study that uses ArcView GIS to identify these potential market areas. A potential model is developed to identify recruitment areas using a combination of census block group information and school district data. The results of the model are then compared to historic enrollment data to identify those areas where additional recruitment efforts are needed to increase minority enrollments at the University.
Along with the other thirteen universities within the State System of Higher Education, Kutztown University of Pennsylvania was required to complete a Performance Outcomes Plan during the Spring 2000 term. The purpose of the Performance Outcomes Plan was to measure the effectiveness of the University in meeting its mandate to provide affordable, high-quality higher education to the citizens of Pennsylvania. The low level of diversity within the student population at Kutztown was one measure on which the school did not meet the System's goal. This paper reports on a pilot study to build a GIS database that can be used to identify specific Pennsylvania school districts from which Kutztown University may be able to recruit minority ethnic groups in order to enhance its minority enrollment. Presently, minority enrollment is 5.2% of the total student population or 2.3% below the State System of Higher Education average. The identification of the target school districts is based on the application of a Demand Potential Model. The Demand Potential Model is implemented through ArcView GIS software using data from the U.S. Bureau of the Census, the Pennsylvania Department of Education, ACT, Inc., and Kutztown University.
This paper is divided into the following sections. After a discussion of the Demand Potential Model, the data sources used to build the database and calculate the model are discussed along with the data preparation necessary to operationalize them within ArcView GIS. This data discussion is followed by a discussion on the enrollment patterns for Kutztown University and its market share; a discussion of the results of the Demand Potential model; and how it may be applied to identify those school districts in which minority recruitment efforts should be enhanced. The paper concludes with recommendations for future research.
The Demand Potential Model looks at the demand for a good at a point based on a spatially distributed market. This model is a simplification of the Demand Potential Surface model that was developed by Chauncy Harris in the 1950's [Harris, 1954]. In its extended and simplified forms the demand potential model states that the demand at any location j for goods at point i is proportional to the size market at j and inversely related to the distance between j and i. In effect, the model is a measure or index of the accessibility of a location to other locations within a study area. Thus this model is similar to Reilly's Law of Retail Gravitation and the various spatial interaction gravity models in that distance, measured as cost, time, or kilometers, is an impedance to movement over space, while larger size places will have more interaction than smaller places [Reilly, 1931; Wilson, 1985]. This model is appropriate for this study since the universities within the State System of Higher Education were established to be accessible, regional centers of higher education [Martin, 2000].
For this study the potential ( Pij ) of college bound students within a school district is directly proportional to the number of college bound students in the district and inversely proportional to the intervening distance between the school district and Kutztown University. The model is represented by the following equation.
Using calculated potentials of the schools districts along with the ethnic composition of the high school graduating class(es) of the districts, schools districts with high potential and significant minority enrollments will be used to identify those districts where additional recruitment efforts should be made to improve the diversity of the Kutztown University student population. An additional factor that can be considered is the 'quality' of the district student population. This factor will be considering by identifying those schools districts that are recruitment targets, which have higher average SAT scores.
To calculate the Demand Potential Model and to identify the student composition of the school districts, data were drawn from Kutztown University's records, ACT (Academic Collegiate Testing), Inc., Pennsylvania Department of Education, and the U.S. Bureau of the Census. The following discussion identifies the particular elements of the data sources that were used to implement the model and the recommendations for recruitment.
To study the present Kutztown University minority enrollment pattern and provide a basis for comparison with the Demand Potential Model, a data file of the freshmen class for Fall 2000 was used [Office of Research and Planning]. The Fall 2000 Enrollment Report file contained information on gender, ethnicity, degree program code, high school ID code, county, state, and country for each of the 1,538 freshmen entering the University in the fall term of 2000. The ethnicity codes in the file are for five groups: Black, non-Hispanic; American Indian/Alaskan Native; Asian/Pacific Islander; Hispanic; and White, non-Hispanic.
The high school ID code within the Kutztown University Fall 2000 Enrollment Report allowed additional information to be added from the ACT High School Address File [ACT, 2001]. The ACT data file contains 40,594 records of the ID code, name, street address, city, state and postal code for each high school in the United States, as well as those outside of the country where U.S. citizen were receiving a high school degree.
The Pennsylvania Department of Education maintains a web site from which several data files for the 2000 academic year were downloaded in order to complete this study. These data files were the High School Graduate Report for public schools, the School Contact Directory for public and private schools, and the District SAT Scores [PDE, 2001]. The School Contact Directory contained the school district name, district accounting unit number (AUN), school name, street address, city, and postal code information. The High School Graduate Report contained information on the school district, AUN, high school name, racial/ethnic category, gender, and post-high school activity for the graduates of Pennsylvania's high schools who graduated in the 2000 academic year. The ethnic groups within the file are the same as those identified in the Kutztown University enrollment file discussed above. The post-high school activities are given in Table 1.
The District SAT Scores file contained information on school district name, AUN, number of school and number of students taking the SAT's, and the average verbal and math scores for the 2000 academic year. The data within this file will be the basis for measuring the 'quality' of the recruitment target school district. The school districts for Pennsylvania were downloaded from the ArcData On Line (ADOL) web site maintained by Esri. The specific data were 1995 U. S. Bureau of the Census county shape files for unified school districts within Pennsylvania. In addition to the polygons for the school districts, these files contained the school district's name, street address, city, and postal code and accounting unit number (AUN) information as attributes.Originally, block group census shape files from the 1990 Census were downloaded from the ADOL site along with their demographic data files. These files were limited to those counties from which Kutztown draws the majority of its students. It had been intended to use these files to identify the ethnic diversity of potential and actual market areas for the University. However, this portion of the study was discarded when recently released 2000 Census data indicated that Pennsylvania had had a significant growth in its Hispanic population that would not be reflected in the 1990 data.
To be able to map the enrollment patterns of Kutztown University students and make recommendations as to those school districts that should be the focus of additional marketing efforts, the data files mentioned above had to be combined through a series of operations. The preparation of these files allowed mapping and analysis to be completed with ArcView GIS.
The Kutztown University Fall 2000 Enrollment Report, which was a received as an Excel file, was imported into Access. Table 2 provides a basic summary of the information in this file.
| Black, non-Hispanic | Female | |||
| American Indian/Alaskan Native | Male | |||
| Asian/Pacific Islander | ||||
| Hispanic | ||||
| White, non-Hispanic | Pennsylvania | |||
| TOTAL | Other U.S. States | |||
| Foreign |
Using a query all freshmen that originated in Pennsylvania were extracted and a new database was created, which will be called KU1 for this paper. There were two reasons for this reduction in the file. The first reason is that the majority of the students entering Kutztown University are from Pennsylvania as indicated in Table 2. And the second reason is the attitude of the state legislature that the state universities should be focused on residents of the state.
The ACT High School Address File was received as a compressed fixed format flat file. This file was imported into an Access database that allowed a query to extract all high school address records for those schools within the state of Pennsylvania. A query based on the high school ID codes allowed the records within the KU1 file to be matched and merged with their address information from the extracted ACT file. The results of this query were saved as a separate file, KU1_ACT.
Using the school name attribute of the Pennsylvania Department of Education School Contact Directory file was queried, matched, and merged to the school name within the KU1_ACT file. This merged file, KU_ACT_PDE, allowed the school district AUN (accounting unit number) to be assigned to each student record for the freshmen class. This was critical since the AUN allowed summary information to be calculated for ethnic groups by school district and it allowed the KU_ACT_PDE file to be joined to a spatial database of school districts. However, before the KU_ACT_PDE file could be joined to the school districts shape file it had to be summarized by ethnic groups for each school district. This ethnic summary was accomplished by using the pivot table analysis capability within Excel to develop a file, KU_SUM, of the count of students by five ethnic groups for each school district. The KU_SUM file forms the basis to map the present origin of Kutztown University students by school district and ethnic group. It also allows the present enrollment pattern to be compared to potential enrollments.
The High School Graduate Report from the Pennsylvania Department of Education was used as the basis for the Demand Potential Model. Using the pivot table analysis capabilities of Excel, this file was summarized by school districts' AUN, ethnic group and post-high school activity. Thus resulting file, PDE_BASE, provides information for each school district on the number college bound students broken down by ethnic group. As with KU_SUM since the file contains the district AUN it could be joined with the school districts shape file for mapping and implementing the Demand Potential Model.
Using ArcView GIS the Bureau of the Census unified school district files for the sixty-seven counties were merged and then dissolved by AUN to provide a spatial data set of all school districts within the state. The dissolve operation was necessary since numerous school districts were not restricted to a single county. Removing attributes that were not pertinent to this study further modified the statewide school district shape file. This consisted of removing the numerous census attributes, which were based on the 1990 Census, for the same reason as the block group analysis was deleted from the initially proposed study. The final step in the data preparation was to join the school districts shape file table with PDE_BASE, KU_SUM, District SAT Scores files using the school districts' AUN.
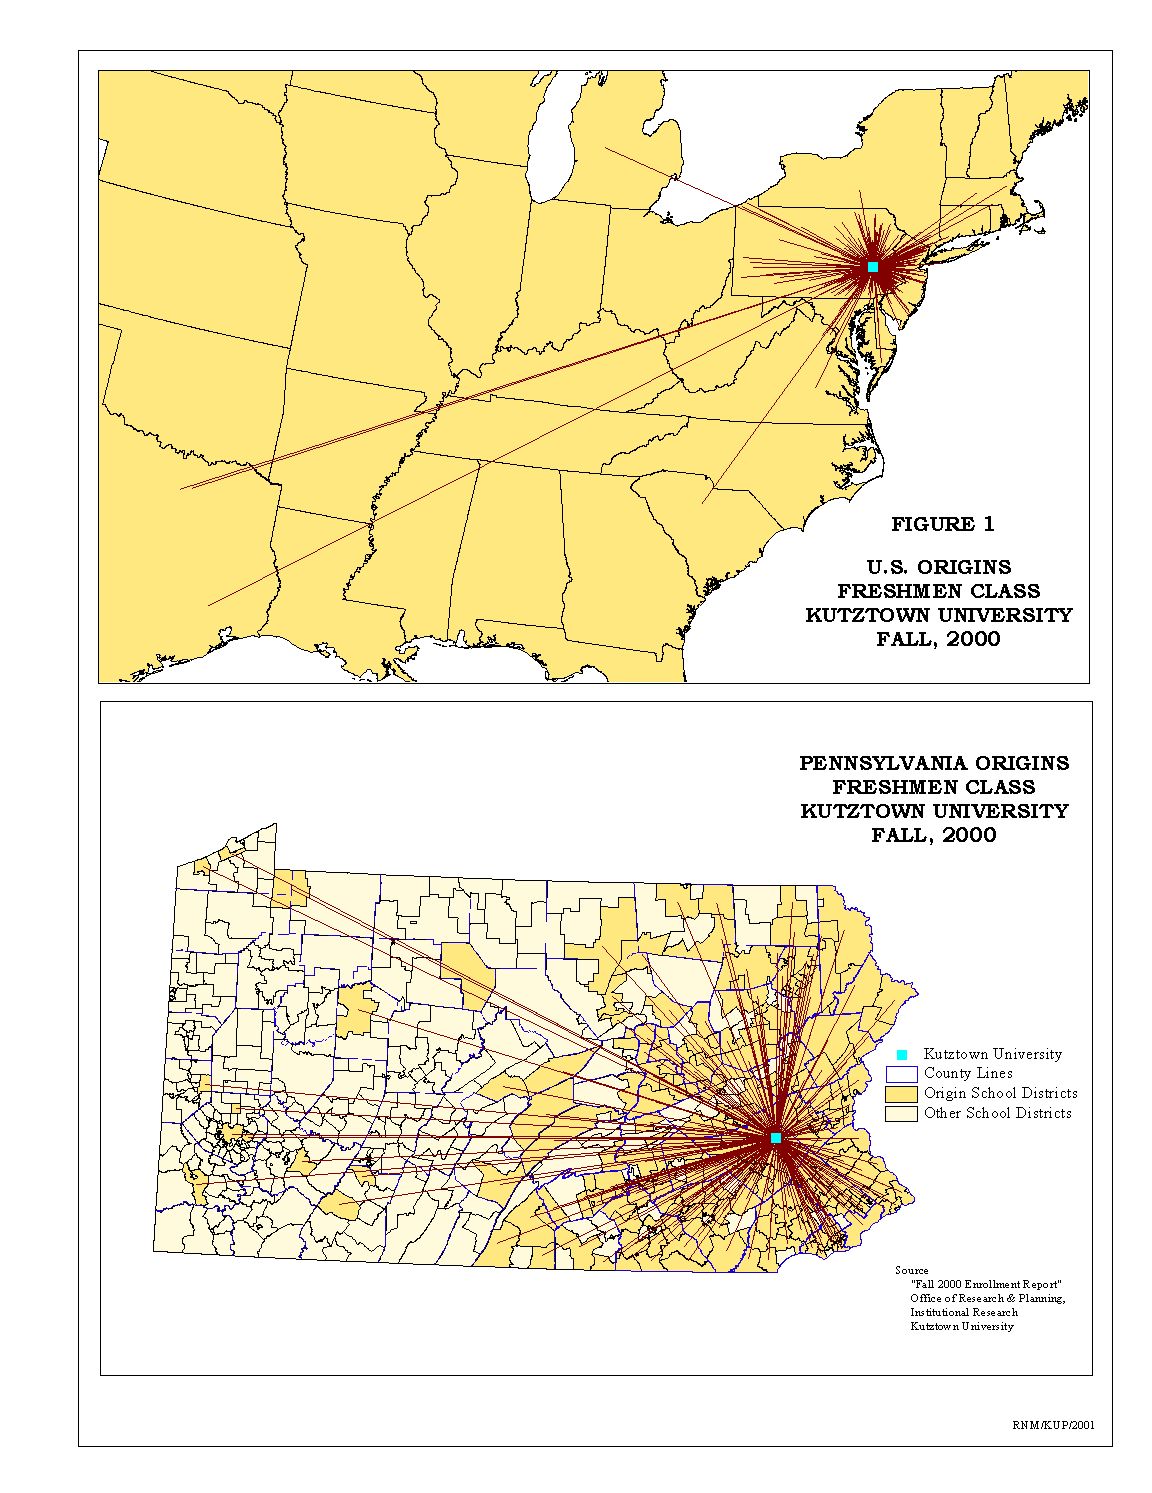
As shown in Figure 1, the Kutztown University market area is very localized reflecting its regional character. The Fall 2000 freshmen class had 20 foreign students and 185 students were out-of-state with 150 of those coming from New Jersey. At the state level the majority of the freshmen came from school districts in eastern Pennsylvania.
Because Kutztown University is a 'regional' university, the analysis of demand potential that follows will focus on study area that includes those school districts within counties from which Kutztown University received 10 or more freshmen student in the Fall of 2000, see Table 3 and Figure 2. Pike County was included for contiguity in eastern Pennsylvania on the Delaware River.
FALL 2000 |
|||
| Berks | |||
| Lehigh | |||
| Montgomery | |||
| Bucks | |||
| Northampton | |||
| Chester | |||
| Lancaster | |||
| Delaware | |||
| Schuylkill | |||
| Philadelphia | |||
| Monroe | |||
| Luzerne | |||
| Lackawanna | |||
| York | |||
| Carbon | |||
| Cumberland | |||
| Lebanon | |||
| Dauphin | |||
| Columbia | |||
| Northumberland | |||
| Wayne | |||
| Pike |
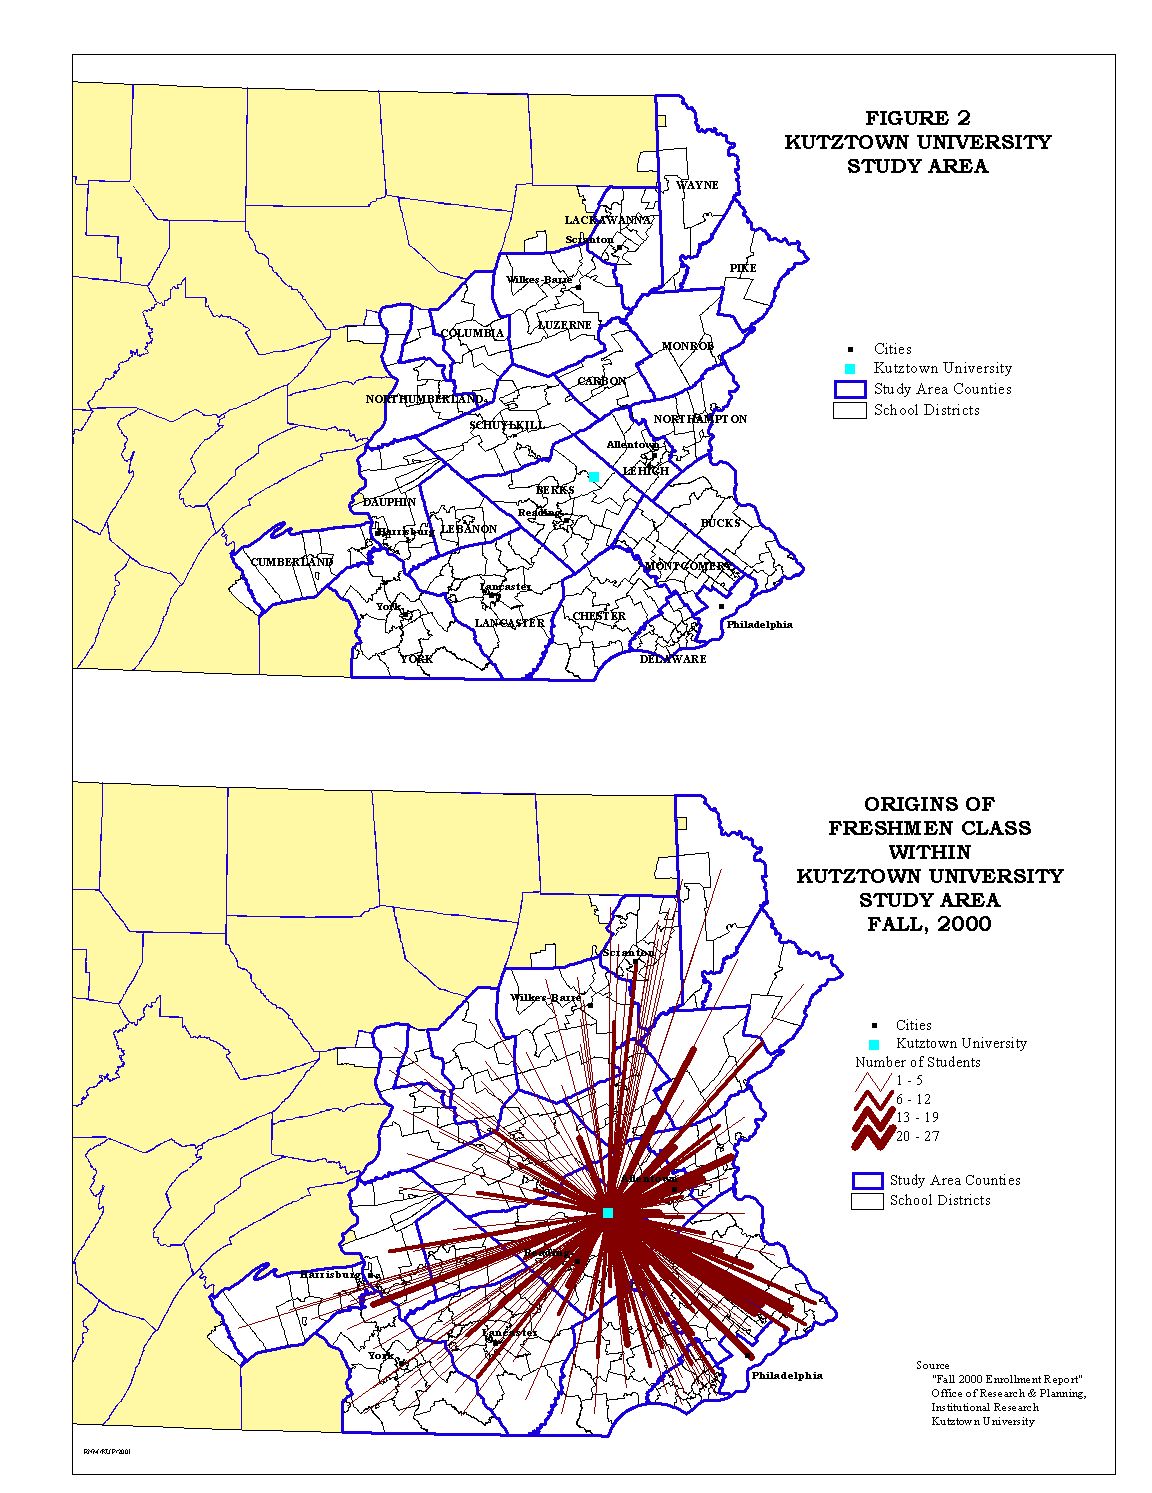
As indicated in Table 3, these counties accounted for over 95% of the freshmen class at Kutztown University with the first five counties accounting for 51%. Based on this county defined study area, the number of Pennsylvania school districts to be analyzed was reduced from a total of 501 to 215 or a little over 43% of all school districts within the state.
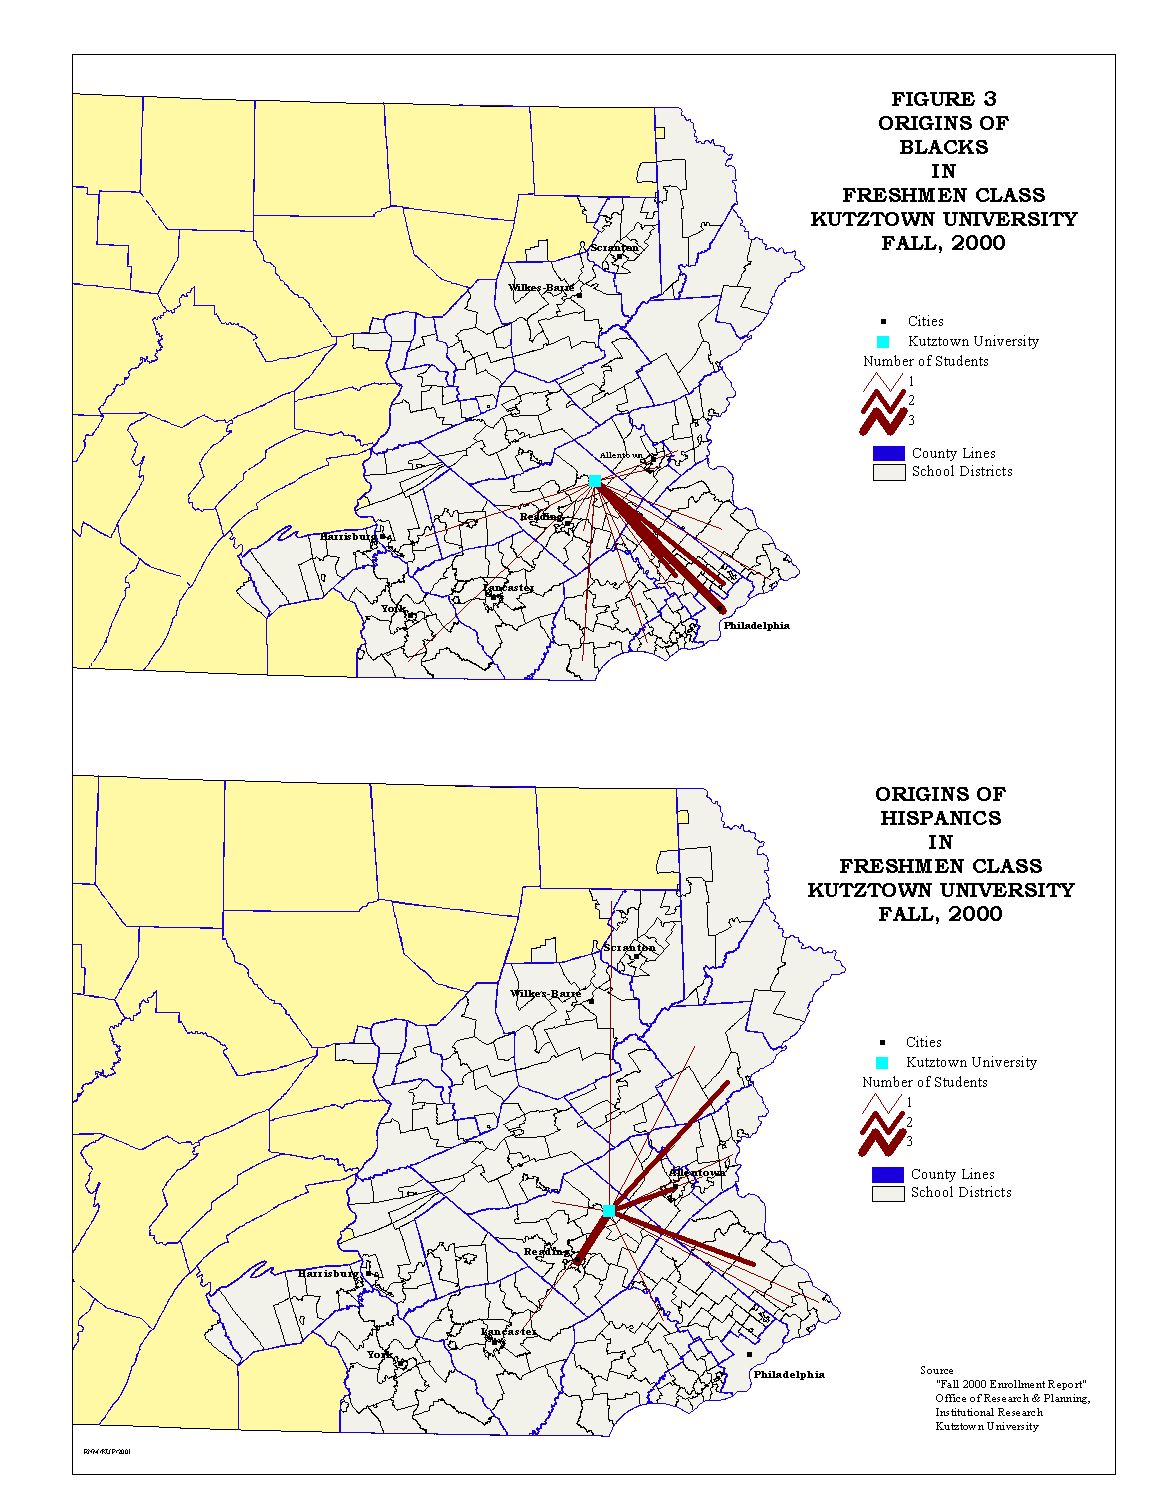
The school districts within the study area account for a significant proportion of the college bound minority high school graduates within Pennsylvania: Hispanic - 90.1%; Black, non-Hispanic - 77.2%; Asian/Pacific Islander - 85.1%; American Indian/Alaskan Native - 79.6%. These districts also accounted for 56.6% of all White college bound high school graduates within the state.
Freshmen attending Kutztown University from districts within the study area accounted for 1,121 students of the 1,333 freshmen from all Pennsylvania public school districts and private schools. More importantly for this study, the school districts within the study area accounted for all but one Black American and two Hispanic students in the freshmen class. The ethnic freshmen enrollment numbers for the study area and a comparison to the number of state university and total college bound high school graduates are given in Table 4.
| KU Freshmen | ||||||
| C.B. - State University | ||||||
| C.B. - Total Graduates | ||||||
| KU % of C.B. State University | ||||||
| KU % of C.B. Total |
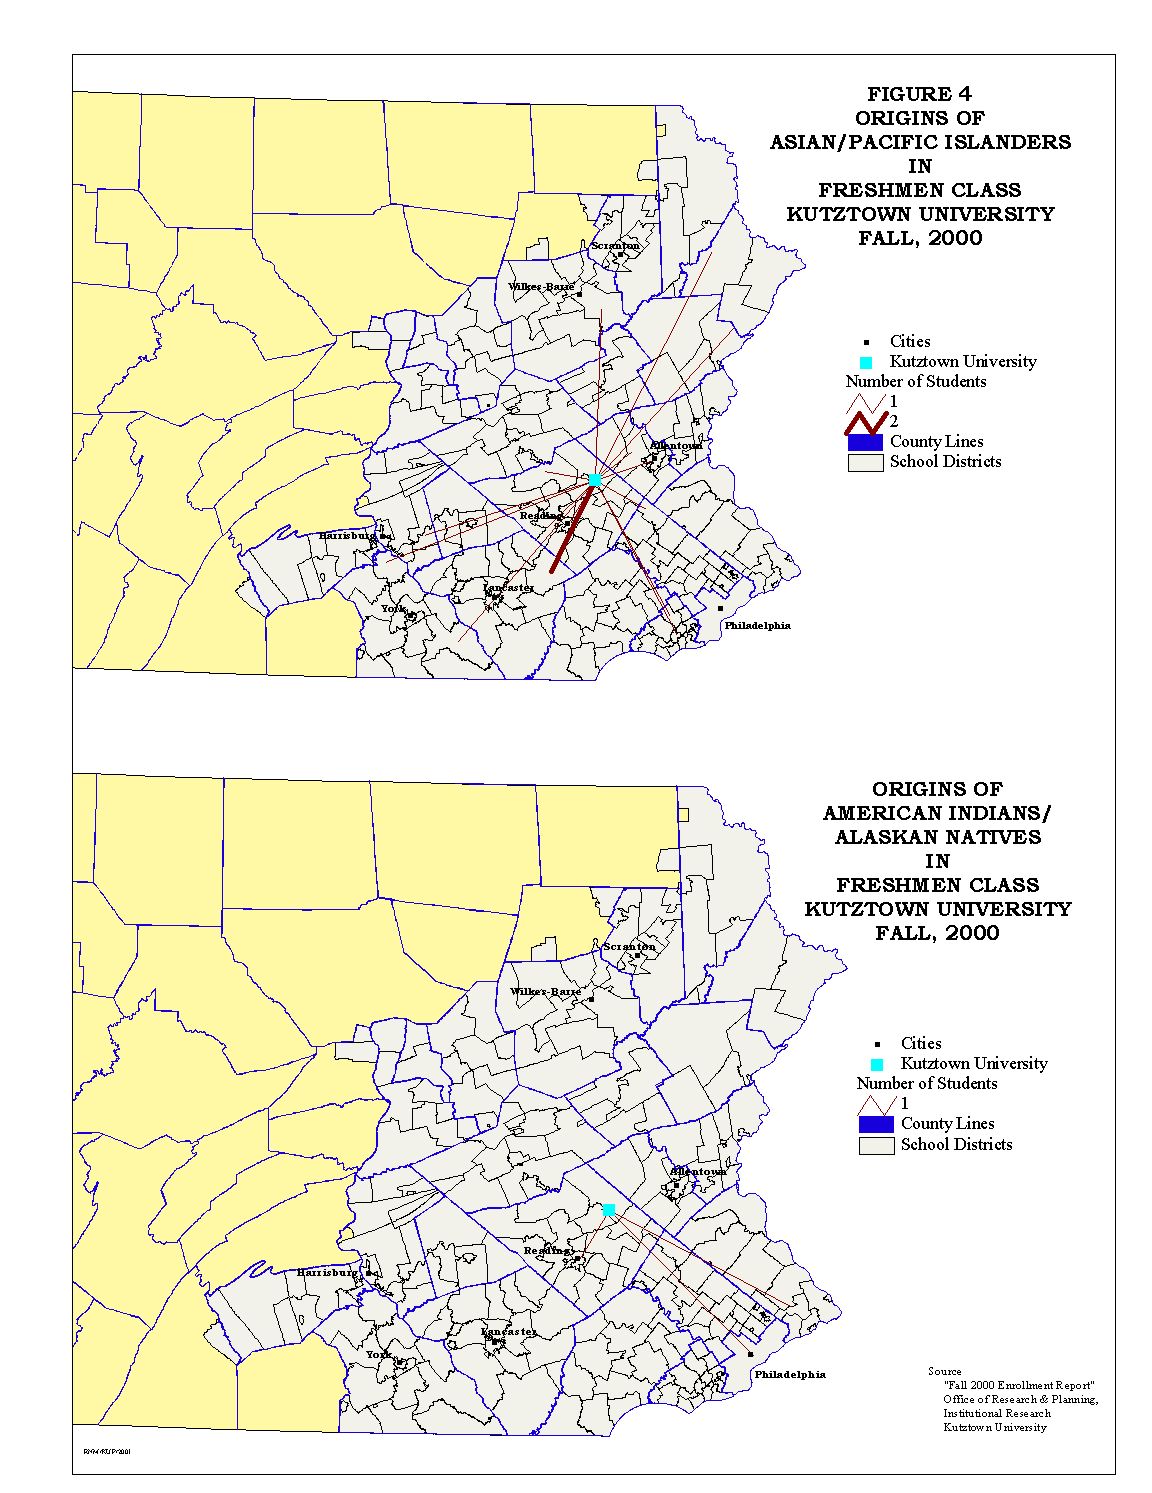
Except for American Indian/Alaskan Native freshmen, Kutztown University proportions of the college bound ethnic minorities are low compared to state universities as a whole. Figures 3 and 4 show the origin school districts for the freshmen minorities.
Figures 5 through 7 show a comparison of Kutztown University freshmen enrollment, both total and ethnic group, compared to the college bound high graduates by school district.
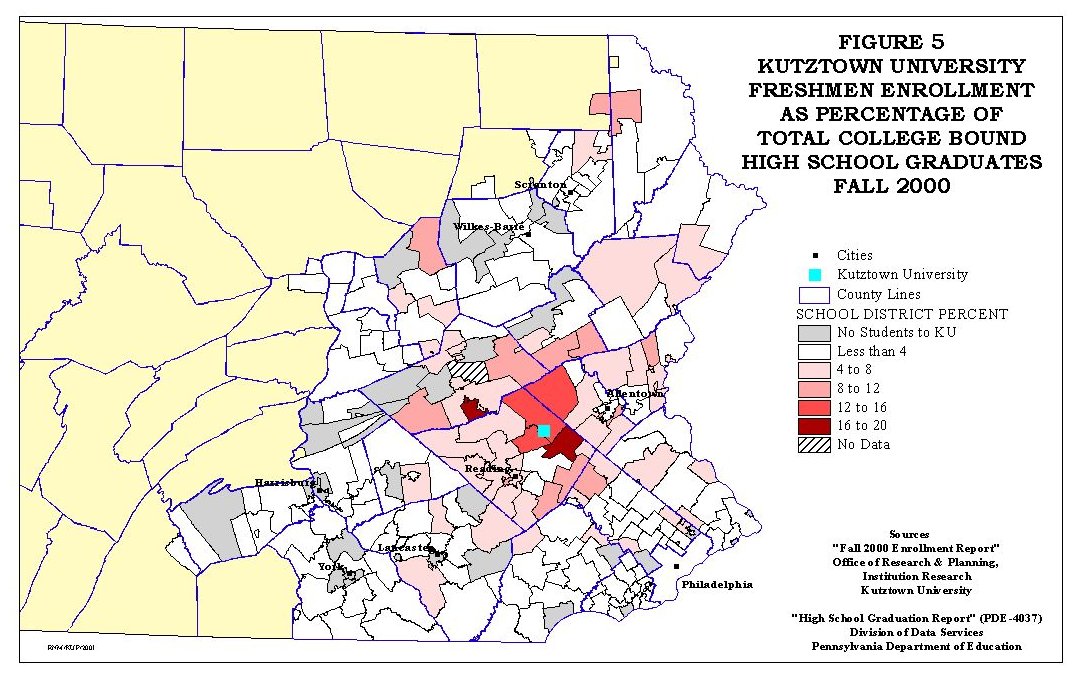
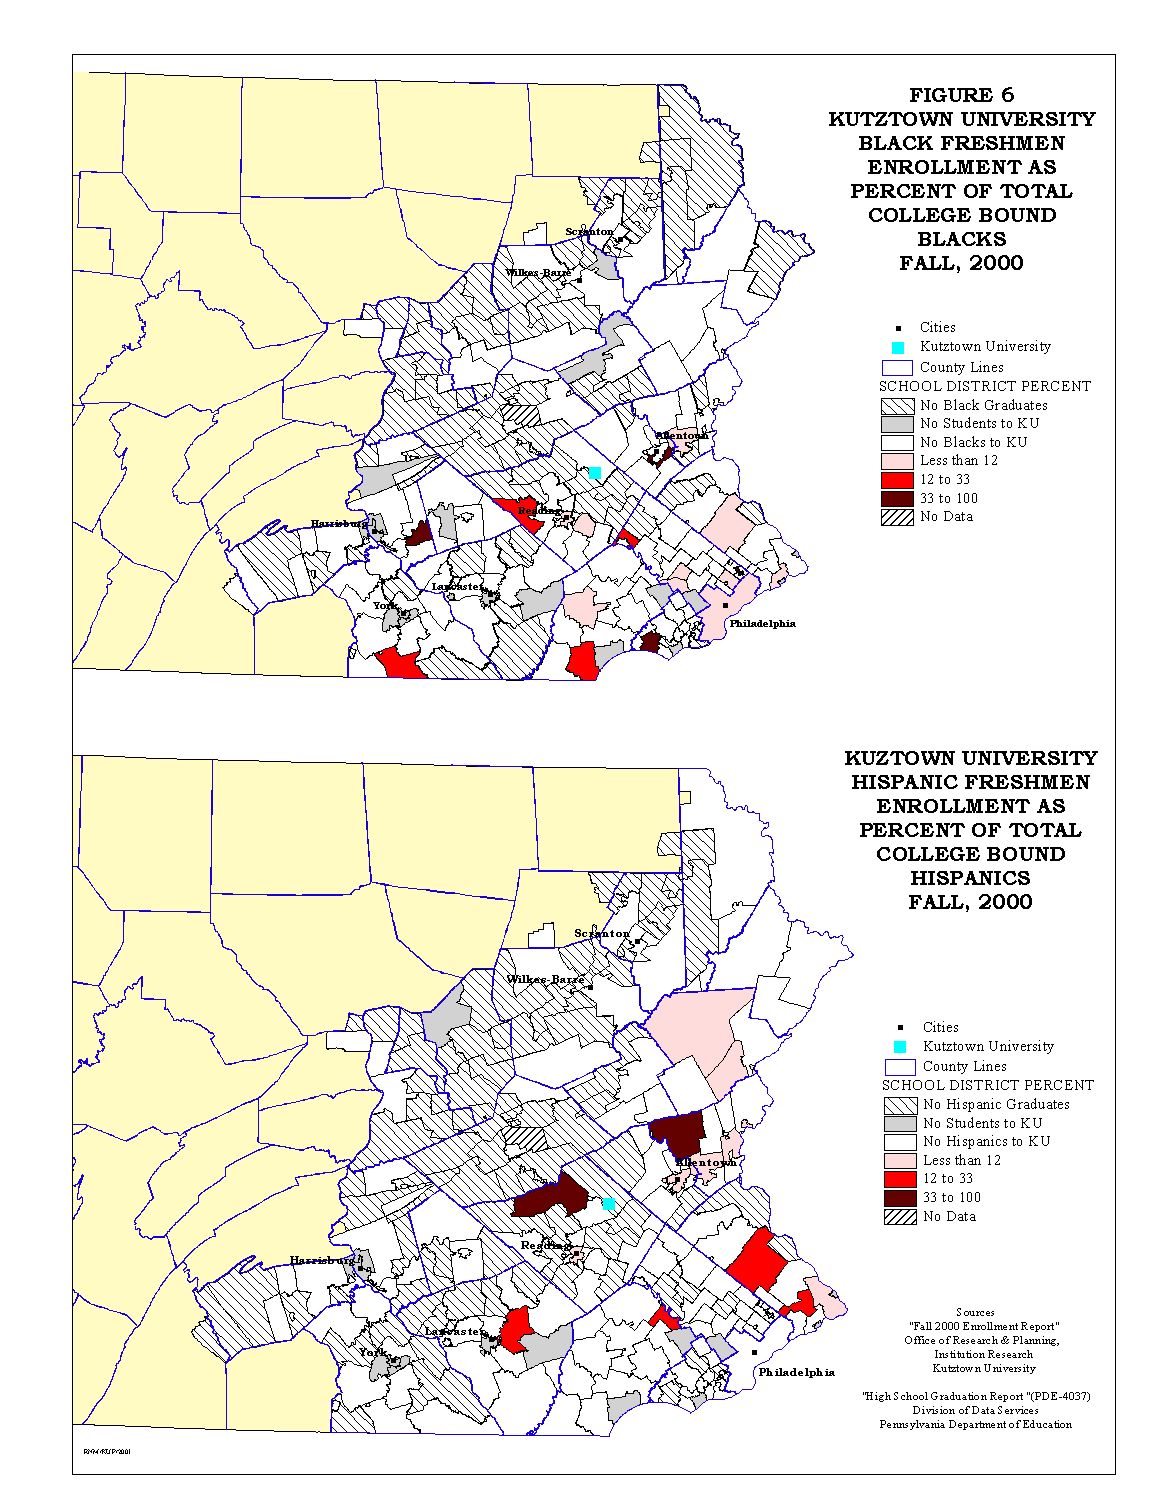
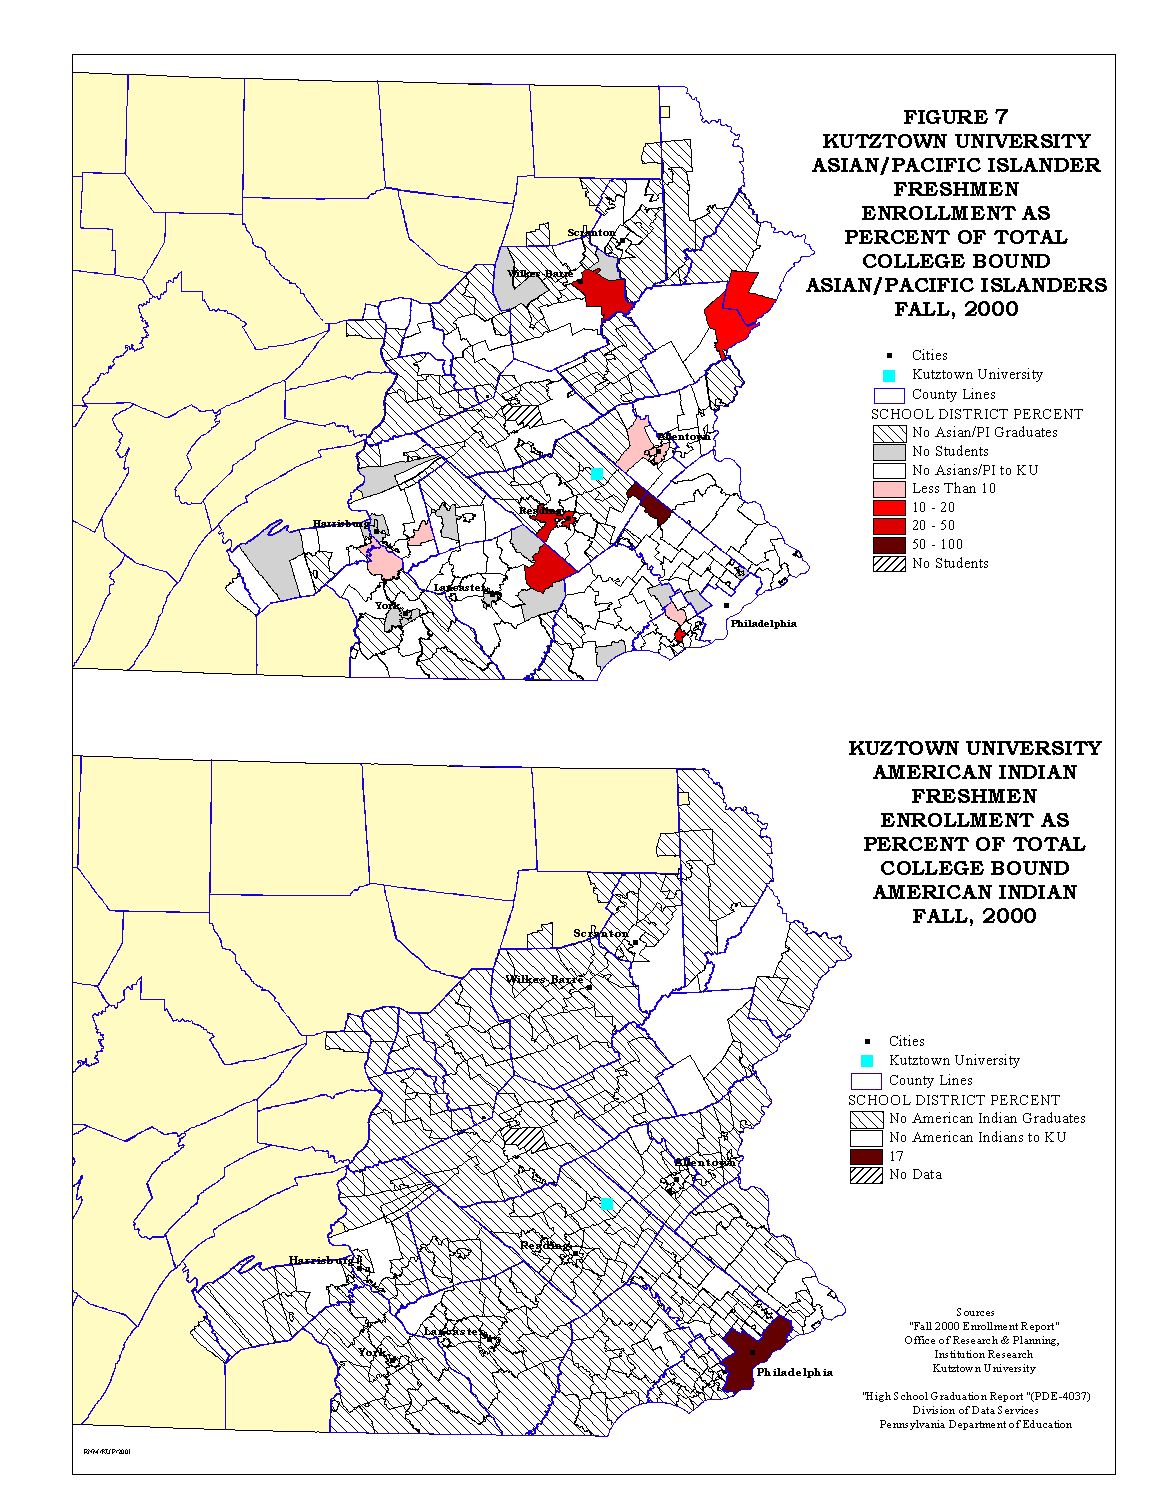
The University's percentage of total college bound students, as seen in Figure 5, shows the regional nature of the University's market area. For the ethnic minorities Figures 6 and 7 show a very dispersed pattern. There are two striking characteristics of the ethnic minority maps. The first characteristic is the number of school districts that have no college bound minority. The second characteristic is the number of districts from which Kutztown does not draw ethnic minority college bound students. It is this situation that is being addressed in this study.
To calculate the Demand Potential Model, the centroid of each school district polygon was determined using the XTOOLS extension [DeLaune, 2001]. Using these centroids shape file and the point shape file of Kutztown University, the Spider Diagram script found within ArcView GIS was used to generate an arc shape file of distances from each school district to Kutztown. Since all the shape files within this study had be projected to a UTM Zone 18, NAD 83, projection, these distances were meters and were converted to kilometers. This attribute would be the impedance in the model. A spatial join of the centroids and the arc shape files allowed each arc to be assigned the attributes of the school districts. The table of the modified arc shape file was edited by deleting all attributes except the unique AUN of each school district and the distances calculated with the Spider Diagram script. The resulting 'arc distance' file was then joined with the school district file. This allowed the calculation of the demand potential for each school district by dividing the total number of college bound high school graduates within the district by its distance to Kutztown University. The results of this modeling are shown in Figure 8.
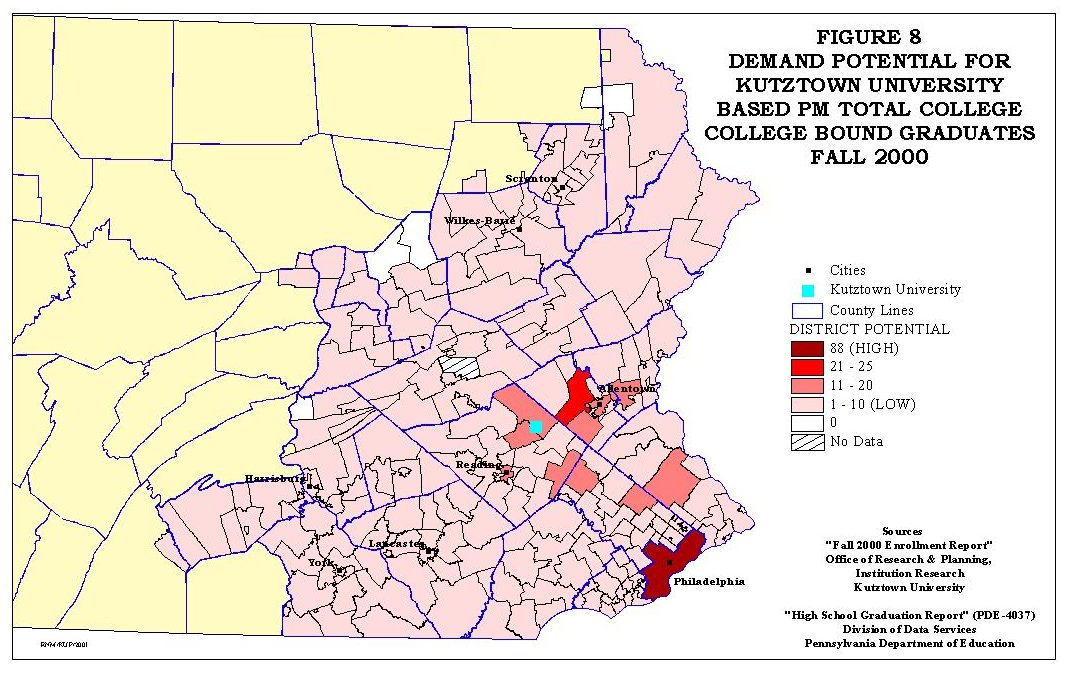
The spatial distribution of the demand potentials in Figure 8 is a relative index of both the size of the school district population and the impedance of distance. As would be anticipated those districts closest to Kutztown University or had large college bound graduating classes have high potential. While demand potentials could have been calculated for each ethnic group, this was not done because of the relative small size of ethnic college bound populations within the school districts. This would have resulted in many districts having values near zero. A change in the distance measure from kilometers to miles would have increased the numeric value of the districts' ethnic potential but the districts relative position among the would not have changed. An alternative to ethnic potential model is discussed in the following section.
With the information discussed above in the database for the school districts, the database becomes a tool that allows recruitment decisions to be based on a school district's potential; the number of ethnic college bound students; and SAT scores. In order for this to be accomplished the average school districts' SAT verbal and mathematic scores were joined to the file and the calculated potential were converted to ranks.
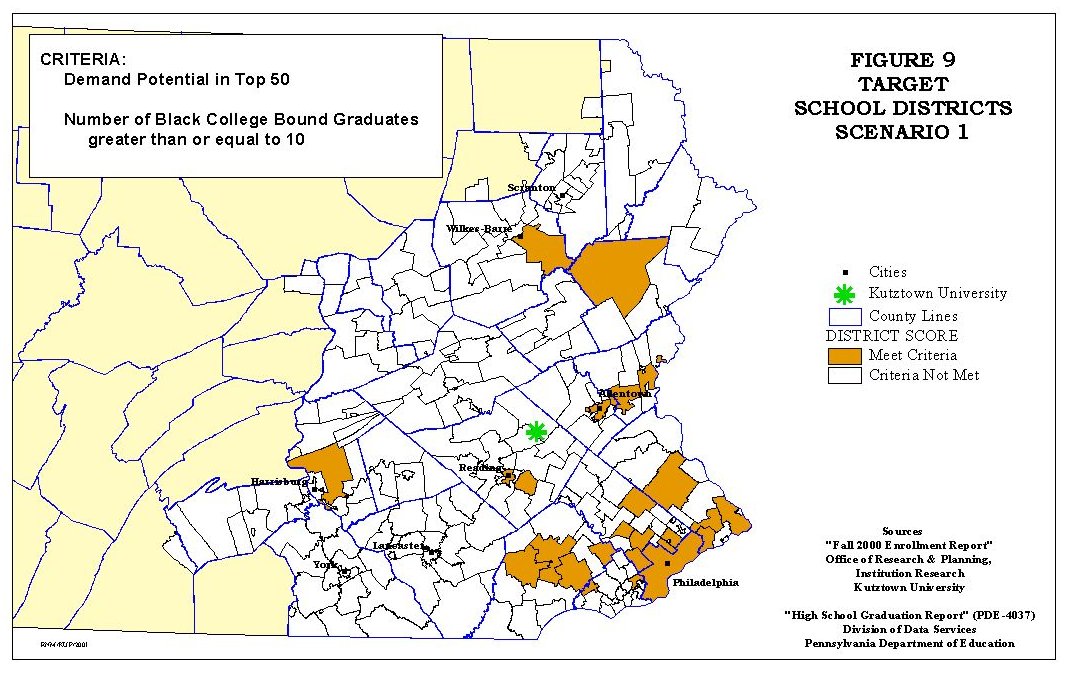
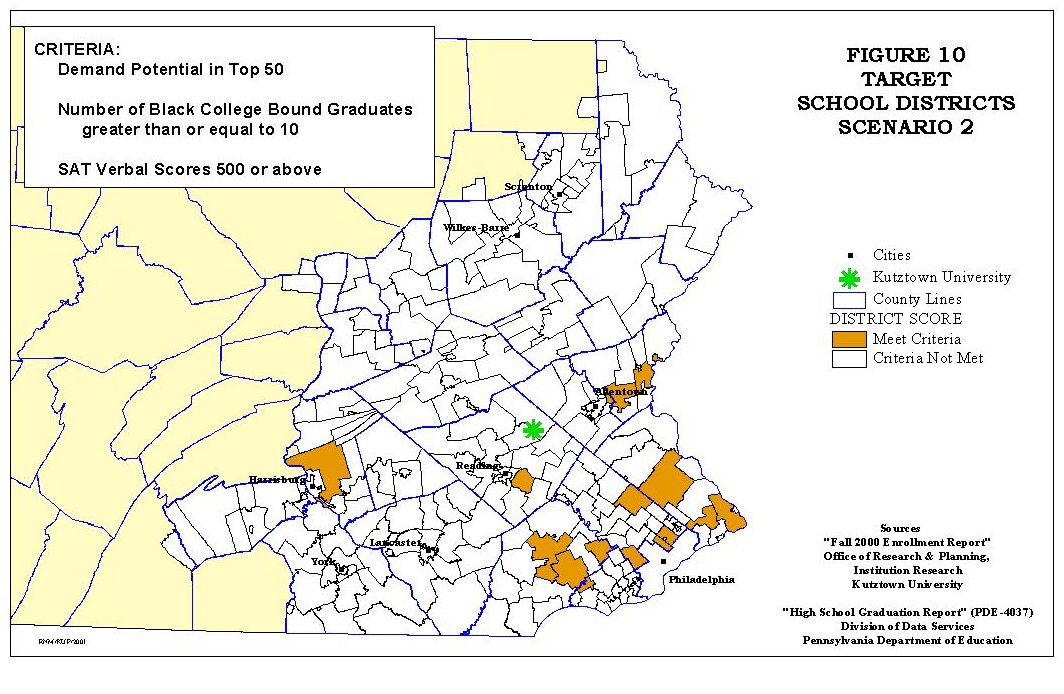
Two scenarios will show how the GIS database may be used for recruitment. In the first scenario, the database will be queried to identify the top fifty districts in terms of potential and those districts with 10 or more Black Americans. The second scenario example modifies the first by adding the requirement that the average verbal SAT scores be above 500.
The result for the first scenario found in Figure 9 and Table 5.
COLLEGE BOUND |
COLLEGE BOUND STATE UNIVERSITY |
FRESHMEN ATTENDING K. U. |
FRESHMEN ATTENDING K. U. |
|
| ABINGTON SD | ||||
| ALLENTOWN CITY SD | ||||
| BENSALEM TOWNSHIP SD | ||||
| BETHLEHEM AREA SD | ||||
| CENTRAL BUCKS SD | ||||
| CENTRAL DAUPHIN SD | ||||
| CHELTENHAM TOWNSHIP SD | ||||
| COATESVILLE AREA SD | ||||
| COLONIAL SD | ||||
| DOWNINGTOWN AREA SD | ||||
| EASTON AREA SD | ||||
| EXETER TOWNSHIP SD | ||||
| LOWER MERION SD | ||||
| NESHAMINY SD | ||||
| NORRISTOWN AREA SD | ||||
| NORTH PENN SD | ||||
| PENNSBURY SD | ||||
| PHILADELPHIA CITY SD | ||||
| POCONO MOUNTAIN SD | ||||
| READING SD | ||||
| TREDYFFRIN-EASTTOWN SD | ||||
| UPPER DARBY SD | ||||
| WEST CHESTER AREA SD | ||||
| WILKES-BARRE AREA SD | ||||
| TOTALS |
As shown in Table 5, twenty-four school districts meet the criteria of being ranked in the top 50 based on demand potential and having 10 or more Black Americans college bound. More importantly though, in terms of the application of the database to identify minority recruitment target school districts, this scenario shows that there are 16 school districts from which Kutztown University enrolled no Blacks despite the large number of Black American high school graduates that were college bound. To improve the ethnic diversity of Kutztown University these sixteen school districts should be the focus of additional recruitment efforts based on the criteria of the scenario. It should be noted for this scenario that the twelve Blacks who entered Kutztown accounted for 57.41% of all Black Americans freshmen while being only 0.24% of those Blacks that were college bound and 1.57% of college bound Black American attending state universities.
The results for the second scenario are found in Figure 10 and Table 6.
COLLEGE BOUND |
COLLEGE BOUND STATE UNIVERSITY |
FRESHMEN ATTENDING K. U. |
FRESHMEN ATTENDING K. U. |
|
| ABINGTON SD | ||||
| BETHLEHEM AREA SD | ||||
| CENTRAL BUCKS SD | ||||
| CENTRAL DAUPHIN SD | ||||
| CHELTENHAM TOWNSHIP SD | ||||
| DOWNINGTOWN AREA SD | ||||
| EASTON AREA SD | ||||
| EXETER TOWNSHIP SD | ||||
| LOWER MERION SD | ||||
| NESHAMINY SD | ||||
| NORTH PENN SD | ||||
| PENNSBURY SD | ||||
| TREDYFFRIN-EASTTOWN SD | ||||
| WEST CHESTER AREA SD | ||||
| TOTALS |
As would be expected and shown in Table 6, when the criteria become more stringent the number of school districts meeting the criteria declines as does the number of ethnic minority students available. The five Black Americans attending Kutztown represent 1.12% of college bound Blacks and 9.61% of the college bound Black Americans attending state universities. While these percentages are higher than Scenario 1, a more significant element to consider is that Kutztown received students from only four of the fourteen districts that met the criteria of this scenario. As with Scenario 1, those school districts from which Kutztown University receives no Black students should be the focus of additional recruitment efforts to improve the University's diversity. While the two scenarios are examples of how the database may be applied to identify school districts that should be the focus of additional recruitment efforts for Black Americans, the database may be used in a similar manner for Hispanics, American Indians/Alaskan Natives or Asian/Pacific Islanders. With the appropriate queries target school districts may be identified based on more than one ethnic minority or combination of other attributes within the database, see Appendix for a complete list of attributes.
While the GIS database built for this pilot study appears to meet the needs of identifying school districts that should be targeted for additional recruitment efforts, there are two areas in which the database could be improved. The first area of improvement would be the replacement of straight-line distance based on district centroids with road distance or travel time between the districts and Kutztown University using the transportation network. This would allow the demand potential to be calculated based on a distance measure that is more realistic. The second area of improvement would be to develop the college bound attributes for the school districts on a longer-term basis rather than on a single year. This would allow the detection of changes in enrollment patterns in the school districts and therefore changes in the demand potentials.
| ATTRIBUTES | |
| POLYID | Unique ID for School District polygon |
| AREA | Area of School District in square meters |
| PERIMETER | Length of Perimeter of School District in meters |
| SDUNI | School District ID Code from Census Files |
| CTY_NAME | County Name |
| AUN_DIS | PDE Accounting Unit Number |
| PHONE | Telephone Number |
| ZIP | Postal Code |
| ZIP4 | Plus 4 Postal Code |
| FIPS_ST | FIPS for State |
| FIPS_CNT | FIPS for Count |
| ADDRESS | Street Address of School District |
| CITY | City Name |
| DISTRICT | School District Name |
| KU2000 | Code: 1 if graduates attend KU; 0 otherwise |
| PERSONS | Population of School District based on 1990 Census |
| HECTARES | Area of School District in hectares |
| DISTANCE | Distance in meters to Kutztown University |
| DIST_KM | Distance in kilometers to Kutztown University |
| AMCOL | Total American Indian College Bound for 2000 |
| AMOTH | Total American Indian not College Bound for 2000 |
| APCOL | Total Asian/Pacific Islander College Bound for 2000 |
| APOTH | Total Asian/Pacific Islander not College Bound for 2000 |
| BLCOL | Total Black, non-Hispanic College Bound for 2000 |
| BLOTH | Total Black, non-Hispanic not College Bound for 2000 |
| HICOL | Total Hispanic College Bound for 2000 |
| HIOTH | Total Hispanic not College Bound for 2000 |
| WHCOL | Total White, non-Hispanic College Bound for 2000 |
| WHOTH | Total White, non-Hispanic not College Bound for 2000 |
| TTCOL | Total Graduates College Bound for 2000 |
| TTOTH | Total Graduates not College Bound for 2000 |
| AMPOT | American Indian Potential |
| ASPOT | Asian/Pacific Islander Potential |
| BLPOT | Black Potential |
| HIPOT | Hispanic Potential |
| WHPOT | White Potential |
| TTPOT | Total Potential Rank |
| AI01 | American Indian Non-PA 2-Year College |
| AI02 | American Indian Non-PA 4-Year College |
| AI03 | American Indian Non-PA Other Post Secondary Degree |
| AI04 | American Indian PA Community College |
| AI05 | American Indian PA Other Non-Degree |
| AI06 | American Indian Pa Other Post Secondary Degree |
| AI07 | American Indian PA Private 2-Year College |
| AI08 | American Indian PA Private 4-Year College |
| AI09 | American Indian PA State Universities |
| AI10 | American Indian PA State Related Universities |
| AI11 | American Indian Non College |
| AP01 | Asian/Pacific Islander Non-PA 2-Year College |
| AP02 | Asian/Pacific Islander Non-PA 4-Year College |
| AP03 | Asian/Pacific Islander Non-PA Other Post Secondary Degree |
| AP04 | Asian/Pacific Islander PA Community College |
| AP05 | Asian/Pacific Islander PA Other Non-Degree |
| AP06 | Asian/Pacific Islander Pa Other Post Secondary Degree |
| AP07 | Asian/Pacific Islander PA Private 2-Year College |
| AP08 | Asian/Pacific Islander PA Private 4-Year College |
| AP09 | Asian/Pacific Islander PA State Universities |
| AP10 | Asian/Pacific Islander PA State Related Universities |
| AP11 | Asian/Pacific Islander Non College |
| BL01 | Black, Non-Hispanic Non-PA 2-Year College |
| BL02 | Black, Non-Hispanic Non-PA 4-Year College |
| BL03 | Black, Non-Hispanic Non-PA Other Post Secondary Degree |
| BL04 | Black, Non-Hispanic PA Community College |
| BL05 | Black, Non-Hispanic PA Other Non-Degree |
| BL06 | Black, Non-Hispanic Pa Other Post Secondary Degree |
| BL07 | Black, Non-Hispanic PA Private 2-Year College |
| BL08 | Black, Non-Hispanic PA Private 4-Year College |
| BL09 | Black, Non-Hispanic PA State Universities |
| BL10 | Black, Non-Hispanic PA State Related Universities |
| BL11 | Black, Non-Hispanic Non College |
| HI01 | Hispanic Non-PA 2-Year College |
| HI02 | Hispanic Non-PA 4-Year College |
| HI03 | Hispanic Non-PA Other Post Secondary Degree |
| HI04 | Hispanic PA Community College |
| HI05 | Hispanic PA Other Non-Degree |
| HI06 | Hispanic Pa Other Post Secondary Degree |
| HI07 | Hispanic PA Private 2-Year College |
| HI08 | Hispanic PA Private 4-Year College |
| HI09 | Hispanic PA State Universities |
| HI10 | Hispanic PA State Related Universities |
| HI11 | Hispanic Non College |
| WH01 | White, Non-Hispanic Non-PA 2-Year College |
| WH02 | White, Non-Hispanic Non-PA 4-Year College |
| WH03 | White, Non-Hispanic Non-PA Other Post Secondary Degree |
| WH04 | White, Non-Hispanic PA Community College |
| WH05 | White, Non-Hispanic PA Other Non-Degree |
| WH06 | White, Non-Hispanic Pa Other Post Secondary Degree |
| WH07 | White, Non-Hispanic PA Private 2-Year College |
| WH08 | White, Non-Hispanic PA Private 4-Year College |
| WH09 | White, Non-Hispanic PA State Universities |
| WH10 | White, Non-Hispanic PA State Related Universities |
| WH11 | White, Non-Hispanic Non College |
| TT01 | All Ethnic Groups Non-PA 2-Year College |
| TT02 | All Ethnic Groups Non-PA 4-Year College |
| TT03 | All Ethnic Groups Non-PA Other Post Secondary Degree |
| TT04 | All Ethnic Groups PA Community College |
| TT05 | All Ethnic Groups PA Other Non-Degree |
| TT06 | All Ethnic Groups Pa Other Post Secondary Degree |
| TT07 | All Ethnic Groups PA Private 2-Year College |
| TT08 | All Ethnic Groups PA Private 4-Year College |
| TT09 | All Ethnic Groups PA State Universities |
| TT10 | All Ethnic Groups PA State Related Universities |
| TT11 | All Ethnic Groups Non College |
| KU_PUB | Total Freshmen attending KU, Fall 2000 |
| KU_BLACK | Total Black Freshmen attending KU, Fall 2000 |
| KU_ASIAN | Total Asian Freshmen attending KU, Fall 2000 |
| KU_AMIN | Total American Indian Freshmen attending KU, Fall 2000 |
| KU_HISP | Total Hispanic Freshmen attending KU, Fall 2000 |
| KU_WHIT | Total White Freshmen attending KU, Fall 2000 |
| KU_ASPER | District's Percent of KU Asian/PI Freshmen, Fall 2000 |
| KU_AMPER | District's Percent of KU Am. Ind. Freshmen, Fall 2000 |
| KU_BLPER | District's Percent of KU Black Freshmen, Fall 2000 |
| KU_HIPER | District's Percent of KU Hispanic Freshmen, Fall 2000 |
| KU_WHPER | District's Percent of KU White Freshmen, Fall 2000 |
| KU_TOPER | District's Percent of KU Total Freshmen, Fall 2000 |
| R_TP | Total Potential Rank (1 is high) |
| VERBAL | Average SAT Verbal Score for 2000 |
| MATH | Average SAT Math Score for 2000 |
| RANK_VER | Rank of SAT Verbal Score (1 is high) |
| RANK_MAT | Rank of SAT Math Score (1 is high) |
C.D. Harris, "The Market as a Factor in the Localization of Industry in the United States," Annals, Association of American Geographers, Vol. 44, No. 4, 1954, pp. 315-33.
W.J. Reilly, The Law of Retail Gravitation, New York, 1931 as referenced in Economics of Location, 2nd ed., A. Losch, translated by W.H. Woglom, New Haven: Yale University Press, 1954, pp 410-412.
A.G Wilson and R.J. Bennett, Mathematical Methods in Human Geography and Planning, Chichester: John Wiley & Sons, 1985, Chapter 12.
R.N. Martin, "The Shrinking Student Pool and Higher Education: An Example from Pennsylvania", Proceedings of the 20th Annual Esri International Users Conference, Redlands, CA: Esri, 2000.
Fall 2000 Enrollment Report, Kutztown University, Office of Research and Planning, Institution Research, Kutztown University.
ACT High School Address File, ACT (Academic Collegiate Testing), Inc., Des Moines, IA, 2001.
High School Graduate Report (PDE-4037), School Contacts (S01), and District SAT Scores (D08), Division of Data Services, Pennsylvania Department of Education at http://www.pde.psu.edu.
M. DeLaune, Xtools Extension, Available at http://www.odf.state.or.us/stateforests/sfgis/Documents/Xtools.htm