The paper summarizes the final year of a study using geographic information systems to examine patterns of childcare stability and utilization in central California. A socio-econometric model has been enhanced with detailed survey data and construction of supply-demand analysis down to the census block group level. Stability factors such as cost, transportation availability, and welfare-to-work status, are examined along with questions of family preferences and provider access.
This paper is the second and final part of a two-year research concerning provider utilization and childcare stability in a central California county-Fresno. The research has three primary objectives-(1) examine the patterns of childcare utilization and factors governing the choice of providers; (2) the level of stability of childcare arrangements and the factors underlying the change or termination of providers; and (3) the locational and demographic characteristics that are associated with particular patterns of childcare utilization and stability. In its first year the research focused primarily on the patterns of childcare utilization and factors governing the choice of providers. It was found that, in Fresno, families receiving subsidized childcare arrangements concentrated primarily in the central-southern areas of the city where the provision of care or choice of providers is limited. The relative lack of choice generally confined the families to select providers that were nearby. The families in the central-southern portions of the city had shorter traveling distances to their providers than their northern counterparts. The relative lack of choice also confined the families to rely on relative or friends for care services. The families in the central-southern portions of the city associated more with exempt providers than those in the northern part of the city. At the end of the period an elementary socio-econometric model using the traveling distance between a family and its provider as the dependent variable and a number of other independent variables was constructed. The objective was to assess the relative significance of the various independent variables on the choice of providers. The model was constructed based on data at zip code boundary level. The model confirmed the various relationships elaborated above.
In the second year the research focused on the level of stability of childcare arrangements and the factors underlying the change or termination of providers. It also sought to enhance the socio-econometric model with data at the census block group level. To determine the various factors underlying patterns of utilization and stability, the research further undertook a large-scale social survey with a size of effective response of 759 cases. In the sections that follow the paper will detail the findings pertaining to the level of stability and to the survey. The paper will also analyze the provision of care in relation to the respective demand at the census block group level. The socio-econometric model will not be elaborated at this time as additional efforts using survey data are required.
To examine the level of stability of childcare arrangements the study acquired two sets of data from a collaborating childcare service agency for the time periods 8/1/98-7/31/99 and 8/1/99-7/31/00. Each set of data contains three files-one relating to providers, the other to children, and the third to family. Children IDs served as the key field linking the three files. Since the data files contained multiple records for one child and other incoherent structures, extensive programming efforts were involved to re-structure the data for use in ArcView and in other statistical packages.
With respect to the survey the research team gained the assistance of a collaborating childcare service agency, which helped to distribute a detailed questionnaire to families receiving subsidized childcare, in the summer of 2000. Approximately 1,200 questionnaires were distributed, resulting in a total of 493 usable returns containing information on 759 children-provider pairs. The questionnaire contains a total of 21 questions. The primary questions include how the families found out the providers, who and how children were transported to the providers, whether the provider was the first choice of the families, and whether location of provider was an important provider selection factor.
As regards the analysis of care provision in relation to demand the paper used the 1997 data by HUD at the census block group level. The care provision data came from the combined data from various sources including major childcare services agencies and the Human Services Systems of the County of Fresno. Since the original data contain only street addresses, ArcView was used to relate such street addresses to corresponding census blocks. The demand aspect was constructed using the total number of children aged five or under. The final care provision analysis was based on a unit slightly larger than an individual census block as certain census blocks are too small for statistical analysis purposes.
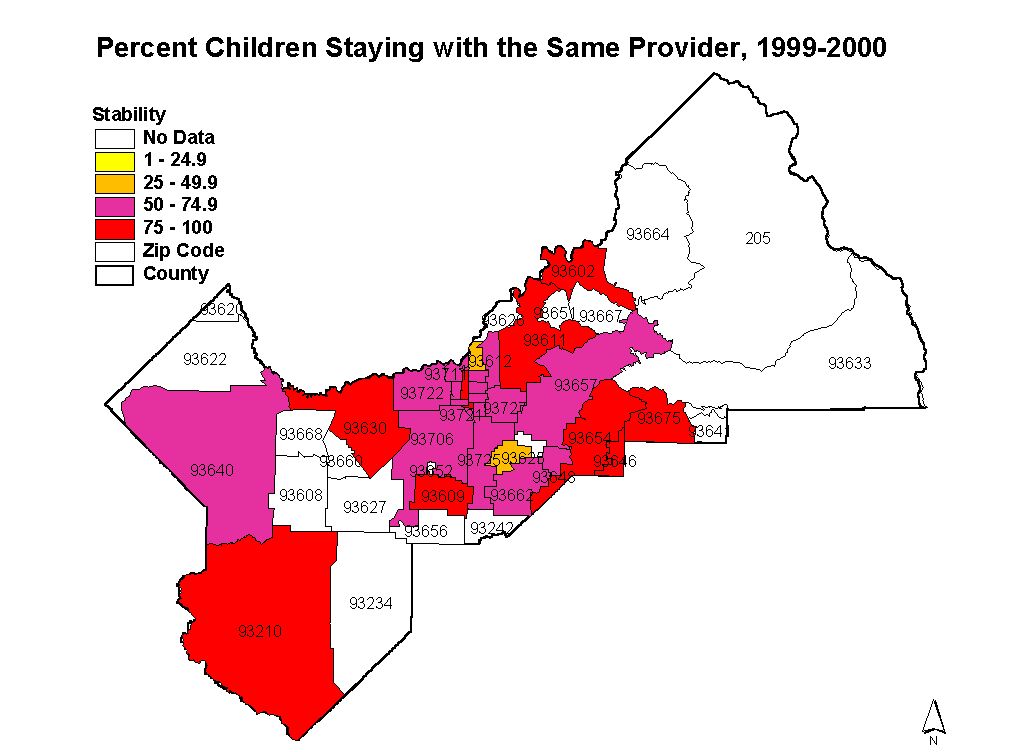
In the two-year period under investigation, the childcare arrangements in Fresno County exhibited moderate levels of stability. About 68.6 percent of the care arrangements underwent no change in the period. The level of stability was slightly lower in the northern part of the city, with 61.0 percent of the arrangements that were unchanged in the period. The lower level of stability reflects the greater choice of providers due to larger provider capacity in the northern part of the city. This finding affirms that established earlier. With respect to the level of stability by type of provider, care arrangements with licensed providers were more stable than those with exempt providers (71.8 percent of licensed care arrangements unchanged versus 65.1 percent of exempt care arrangements). As licensed providers are usually medium or large in size, medium and larger providers had higher levels of stability (76.9 and 73.2 percent of care arrangements by medium- and large-sized providers, respectively) than small providers (65.6 percent unchanged).
A more detailed analysis of the level of stability at a zip code level shows that quite a number of rural pockets in the county had relatively high levels of stability of care arrangements. The high levels of stability can be a result of the lack of provider choice, a situation that is compounded by greater transportation difficulties due to their non-central locations or economic difficulties because of their more chronic unemployment or poverty conditions.
Figure 1: Stability of Childcare Arrangements by Zip Codes, 1999-2000
Since the two sets of data files record only basic information it was not possible to discern the reasons why the 31.4 percent of care arrangements were changed or terminated in the period. This aspect was one of the major questions in the survey and will be examined more fully later in the survey findings section.
Aside from the continuance of most existing care arrangements, the county experienced a rapid growth in new care arrangements in the period because of a large provider capacity building grant to the various care services agencies. For the collaborating agency under examination, there were 1,412 new care arrangements in the year 2000 period, representing nearly a one-fold increase over the level of 1999. In the city of Fresno the growth was especially high in the northern and eastern portions of the city. The central-southern portion, which had a supply deficit condition at the beginning of the period, suffered from slower increase in care arrangements.
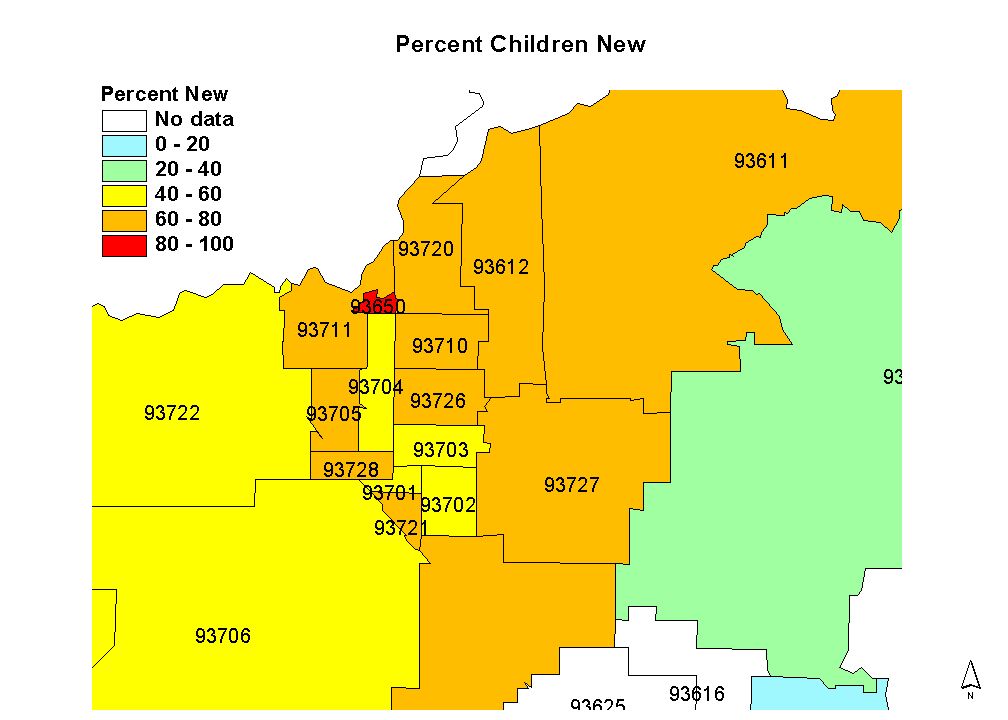
Figure 2: Level of New Care Arrangements of A Collaborating Agency by Zip Codes, 1999-2000
Three factors were identified from the survey as the most important determinants of provider choice in Fresno County. The three factors are-(1) the location of the child care provider to the home of the parents (69 percent of all responses), the hours child care is available (65 percent), and the type of child care provided (63 percent). Among the factors that are not considered important by the respondents with respect to choice of provider include access to public transportation, language other than English spoken, and ethnicity of the children.
It is important to note that, further statistical analysis revealed that the location of the child care provider is significantly associated with the current selection of unlicensed relatives providing child care in the homes of the children. It is not an important factor in selecting a child care center or relative providing care in the homes of the relatives.
Geographically there is some difference between the rural areas of the county and the city areas of the city with respect to the importance of provider location as a care selection factor. A higher percentage (78.8 percent) of the responding families in the rural areas indicated that location of provider is an important factor, while about 68.3 percent of the responding families in the city areas of Fresno did so. The difference is a mild one; it is significant at 0.1 level (Chi Square = 2.9642, df = 1). There is no significant difference; however, with respect to the location as a care selection factor between the northern and southern portions of the city of Fresno.
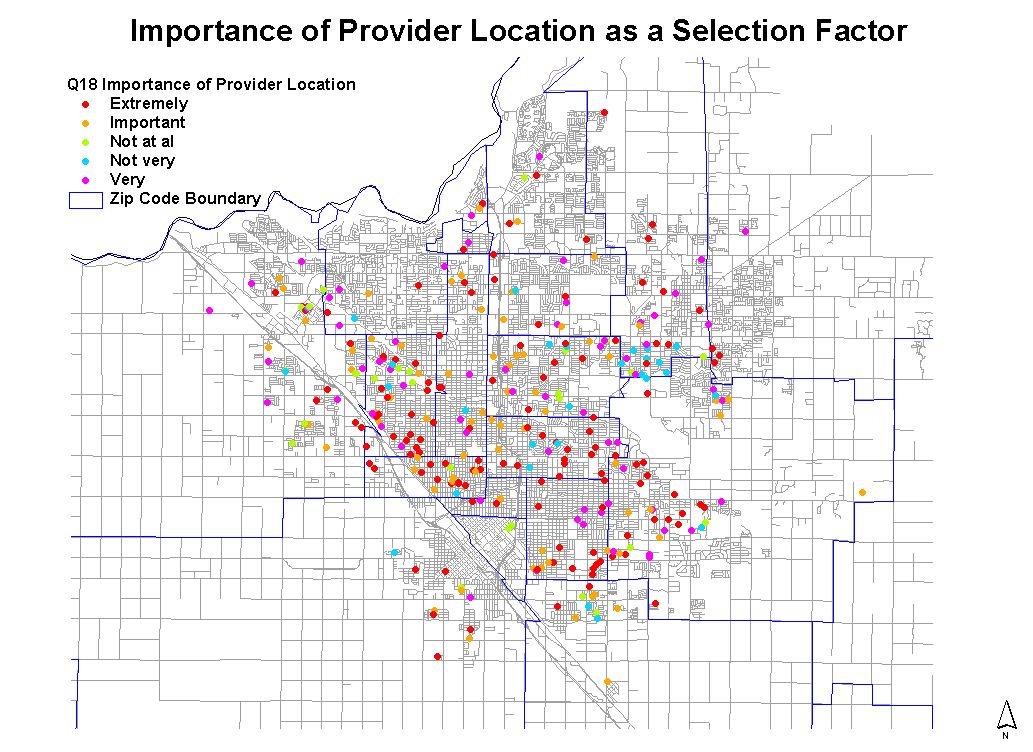
Figure 3: Whether Location of Provider was an Important Care Selection Factor
With respect to whether families got their first choice the majority of parents (58 percent) indicated they obtained their first choice provider. Families received information about child care providers from three major sources-(1) agencies (37 percent); (2) personal friends (21 percent); and (3) relatives or family members. There is no significant difference in whether families got their first choice between the northern and southern portions of the city of Fresno, or between the rural areas and the city. There is also no significant difference in the sources of information for provider information between the two city areas, and between the rural areas and the city.
As location of provider is an important care selection factor transporting the children from the families to their providers can be another important care selection decision determinant. The majority (79 percent) of responding parents provide transportation for their children to child care. The majority (86 percent) of responding parents use personal automobiles as the means of transportation.
In the rural county areas where provider of location is a more important care selection factor responding parents are more dependent on other persons to provide transportation for their children to child care. About 64.1 percent of the parents in the rural county areas transport their children to child care by themselves, while 81.3 percent of the parents in the city areas do. The difference is statistically significant at 0.01 level (Chi Square = 10.2194, df = 1). The greater reliance on other persons for transportation highlights the lower levels of car ownership in these areas, as the rural county areas have higher unemployment and poverty rates than the city areas of Fresno. This situation is also reflected by the means of transportation for transporting the children to child care, as parents in the rural areas are more dependent upon other means of transportation rather than personal automobiles for such purposes. The proportion of families in the rural areas using personal automobiles for transportation is 70.1 percent, whereas that in the city areas is 81.7 percent. The difference in the means for transportation the children to child care between the rural county areas and the city is statistically significant at the 0.05 level (Chi Square = 4.5651, df = 1).
There is no significant difference in either who transports the children to child care or the means of transportation between the northern and southern portions of the city of Fresno.
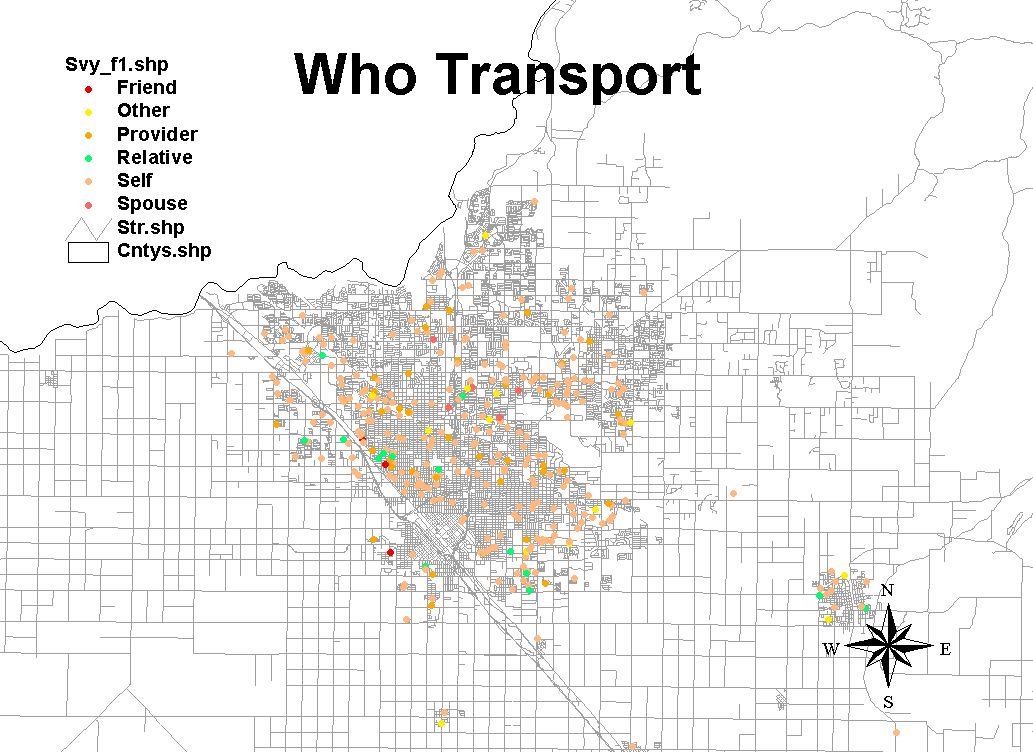
Figure 4: Who Transport Your Child to Child Care?
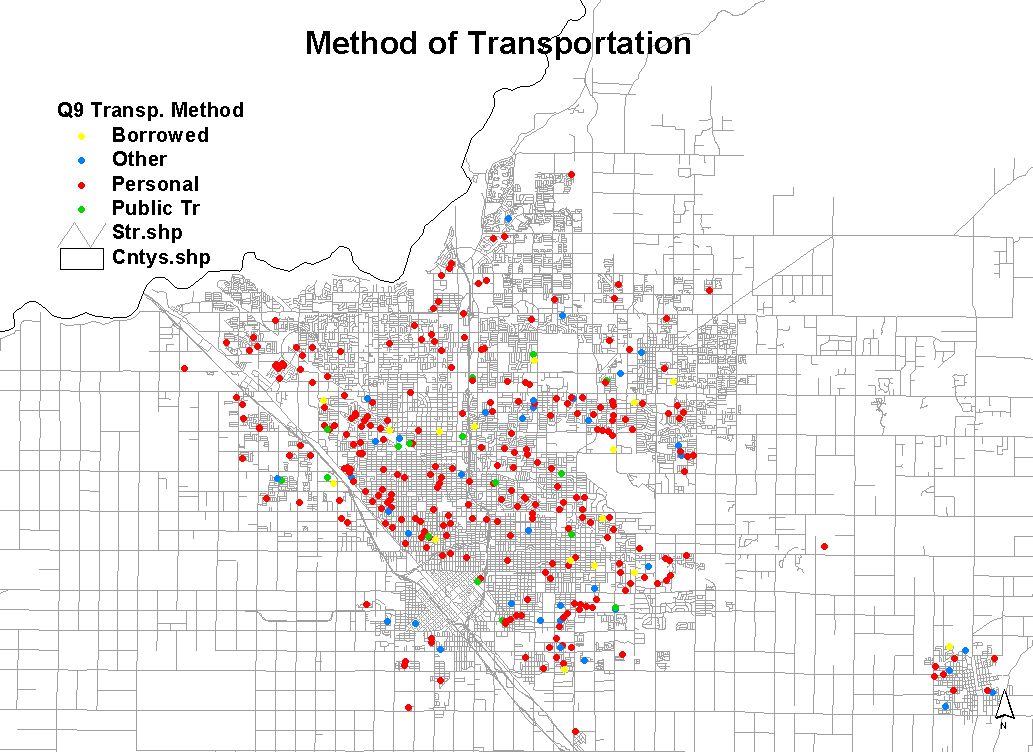
Figure 5: Means of Transportation to Get Your Child to Child Care?
In agreement with the analysis in the above section, the care arrangements among survey respondents show moderate degree of stability. Approximately 64 percent of the children received child care services stayed with their current providers for over one year. The level of stability is relatively the same among various types of providers.
There is no significant difference in stability of care arrangements between the northern and southern portions of the city, or between the city areas and rural county areas of Fresno.
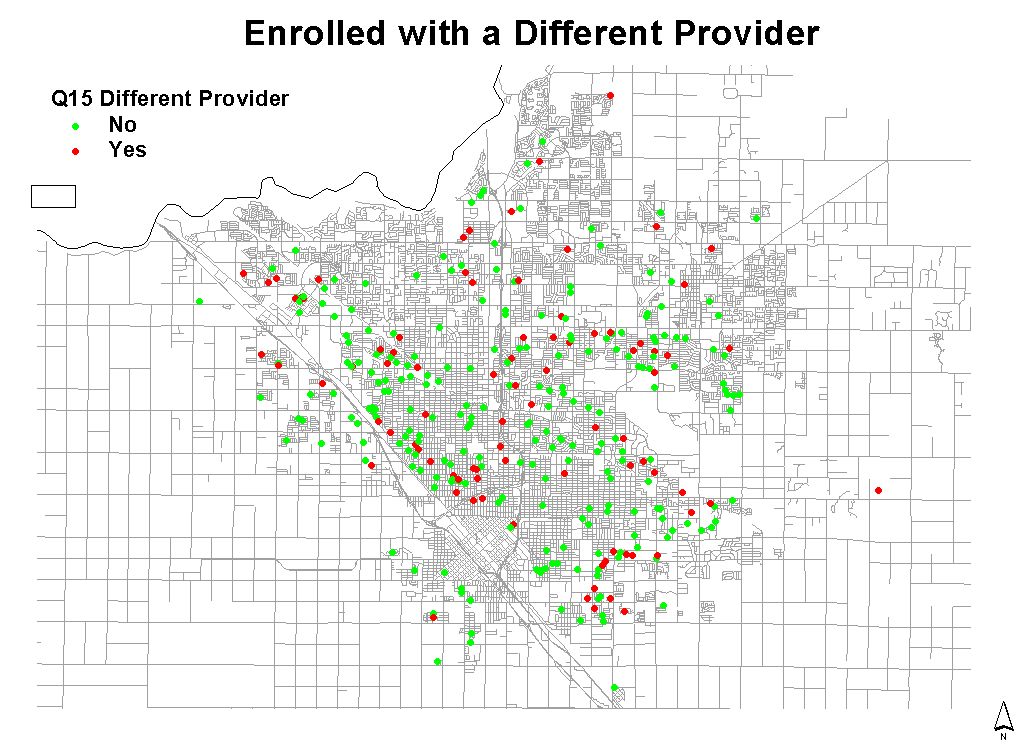
Figure 6: Has Your Child Been Enrolled with a Different Care Provider Within the Past Year?
The majority of responding families indicate their general satisfaction toward the care provided by their current child care providers. With respect to a five-category classification, fifty-eight percent of the responding parents express 'extremely satisfied' with their current providers. The percentages for parents who indicate 'very satisfied' and 'satisfied' are 25.6 and 12.0 percent, respectively.
As a result, there is no significant difference in the degree of satisfaction with current providers between the northern and southern portions of the city, or between the city areas and rural county areas of Fresno.
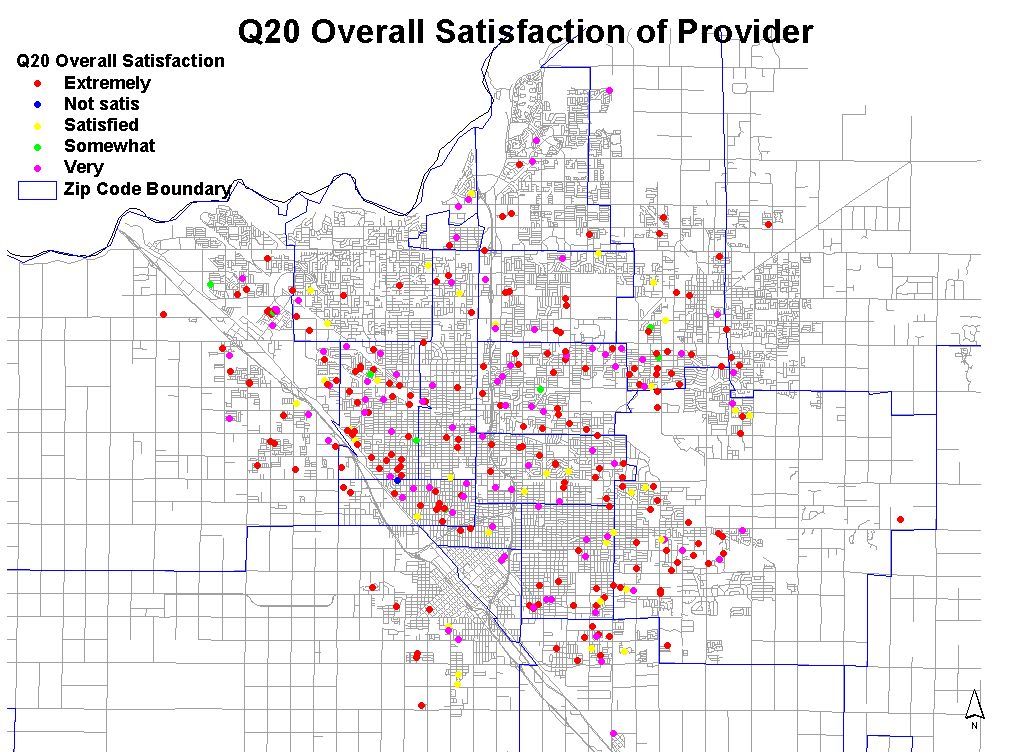
Figure 7: Overall Satisfaction of Current Child Care Provider?
The higher level of satisfaction leads to a general preference to stay with the current child care providers. Approximately 84.4 percent of the responding parents do not plan to move their children from the current providers in the near future. This re-affirms the relative stability of care arrangements among the survey respondents.
In the first year it was found that areas in the city of Fresno varied in capacity of child care services and such condition had certain negative effects on families who sought child care services for their children. While the insights provided by the analysis were valuable, the analysis was done at a zip code area level that prevented an adequate understanding of demand-supply conditions within the areas. This is especially so for zip code areas which are large or elongated in shape. To attain a better understanding of the supply-demand conditions the capacity of providers and the number of children five years or younger were re-tabulated based on census block groups. Given the small size of individual census block groups the analysis was conducted using a larger census block group unit, which usually comprises four to six census block groups. Most of the large census block groups are regular in shape and size, ensuring higher degrees of homogeneity in supply-demand condition within an individual area.
The analysis at the large block group level reveals substantial variations in supply deficit condition in most of the zip code areas in central-south portions of the city. In zip code area 93727, one of the areas in the southeastern portion of the city for example, there were extreme supply deficit conditions in three pocket areas (14031 in the center, 34012 in the northeast, and 50014 in the east). Similar situations can be found in zip code areas 93706 (southwest), 93711 (northwest), and 93612 (northeast). In the cases of northwest and northeast the extreme supply deficit pockets are generally in the outlying areas. These pockets are at a distance from the large licensed centers, which are located in the more central locations in the northern portion of the city.
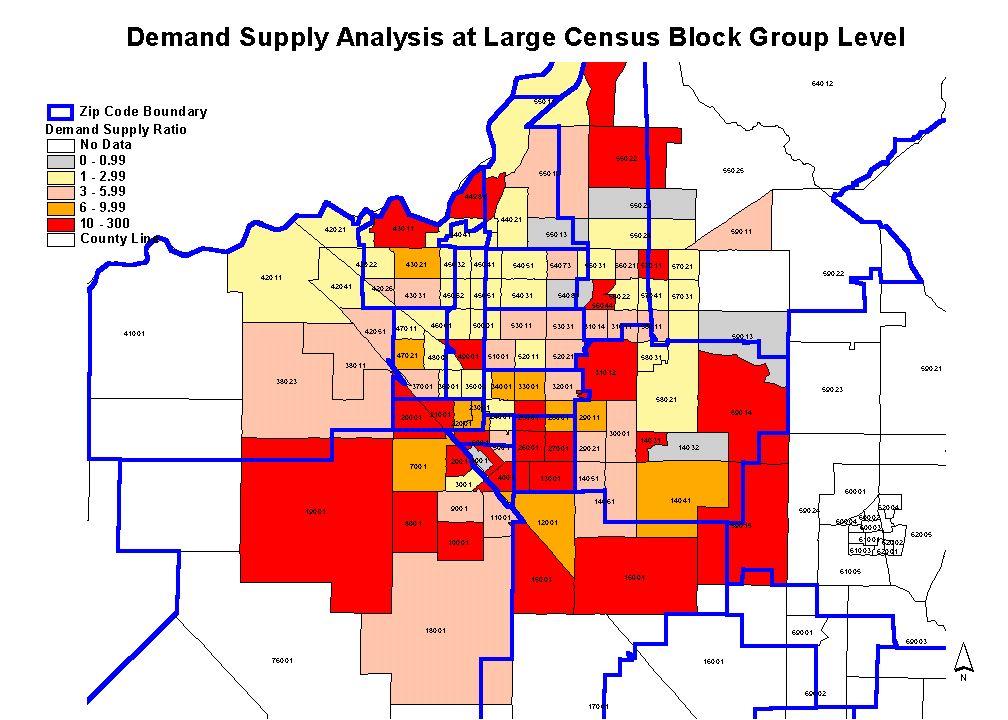
Figure 8: Supply Deficit Conditions of Child Care Services in the City of Fresno at Large Block Group Level
This paper is the second and final part of a two-year research concerning provider utilization and childcare stability in a central California county-Fresno. In the second year the research focused on the level of stability of childcare arrangements and the factors underlying the change or termination of providers. It also sought to enhance the socio-econometric model with data at the census block group level. Based on an analysis of two sets of agency files in a two-year period, it is found that arrangements of child care services exhibit in Fresno County exhibit a moderate degree of stability, with approximately two-thirds of care arrangements having a duration of more than one year.
Based on a large-scale social survey the research found that location of provider to the home of children is a major provider selection criterion, and that this factor is more important for families in the rural areas of the county. The greater importance of this locational factor corresponds to the greater reliance on other persons and on non-personal automobiles to transport the children to their providers. This finding highlights that families in the rural areas generally have greater difficulties in receiving child care services as some of them are at poverty levels and cannot afford personal vehicles. Nevertheless, the responding families are generally satisfied with the child care services that they have received. The majority of them do not plan to change their current child care arrangements in the near future.
Due to time constraints the research at this stage only derived one of the dependent variables-supply deficit level of care services-at a large block group level. Based on the survey data the distance between a responding family and its child care provider, which is the independent variable in the refined socio-econometric model, will be derived. It is expected that the refined socio-econometric model, which includes other census data such as income and unemployment, will yield substantial insights to the patterns and dynamics of child care arrangements in the county of Fresno. Such insights will contribute to a more effective planning mechanism to enhance child care services in the county.
Chi Kin Leung, Ph.D.