Using Remote Sensing and GIS
to Compute Evapotranspiration in the Rio Grande Bosque
Julie Coonrod and Dianne
McDonnell
Department of Civil Engineering
University of New Mexico
Albuquerque, NM
ABSTRACT
ĀĀĀĀĀĀĀĀĀ Increasing demand for water and the scarce supply of
water is a growing concern in the semiarid regions of the United States and the
world. Semiarid regions lose a
tremendous amount of water to evapotranspiration. The middle Rio Grande bosque has native cottonwood trees and
invasive salt cedar trees.Four towers
extend above the canopy to measure evapotranspiration from the two tree
species.Landsat data and AVHRR data
are used in ArcView Image Analysis and ArcView Spatial Analyst to derive a
method to compute evapotranspiration purely from satellite imagery.
TABLE OF
CONTENTS
INTRODUCTION
SITE DESCRIPTION
METHODS
ĀĀĀĀĀĀĀĀĀ Overview
ĀĀĀĀĀĀĀĀĀ Ground Measurement Technique
ĀĀĀĀĀĀĀĀĀ Remote Sensing Technique
RESULTS
DISCUSSION
CONCLUSIONS
ACKNOWLEDGEMENTS
REFERENCES
AUTHOR INFORMATION
INTRODUCTION
Evapotranspiration is a major source of water
depletion in arid and semiarid environments.Ā
Approximately one-third of the worldwide land surface occurs in regions
with arid or semiarid climates, and about 20% of the worldÆs population
presently lives in these regions.Ā The
scarcity of water and growing human demand for water often result in conflicts
between human needs and those of biota within these river corridors (Warren,
Sud & Tozanov, 1996).
The Rio Grande, located in the southwestern United
States, is an example of a river that has many competing demands in a
semiarid/arid climate.Ā More
specifically, the Middle Rio Grande runs through central New Mexico, U.S.A. and
is typically defined by the reach of river between Cochiti Dam and Elephant
Butte Reservoir.Ā The contributing
watershed to this reach of river is shown in Figure 1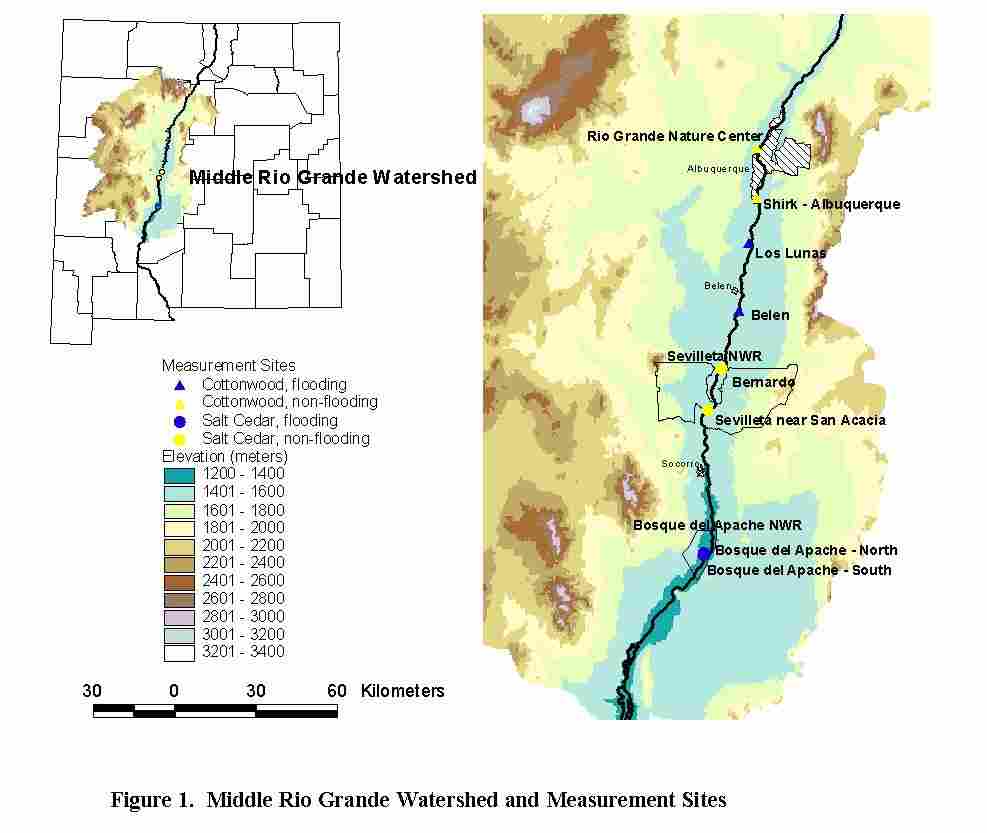 .Ā Water demands include those of the stateÆs
largest city (Albuquerque), irrigation districts, and several endangered species.
Water budgeting is critical due to these demands and the legal compacts between
adjacent states requiring the delivery of mandated quantities of water. The
inputs and outputs of water from the upper and lower end of the river corridor
are reasonably well quantified by permanent gauges with long-term records.
Additional sources and depletions of water along the Middle Rio Grande are more
poorly quantified.Ā Evapotranspiration
is believed to account for about one quarter of the total water depletion along
the semi-arid Middle Rio Grande Valley.Ā
An accurate estimate of evapotranspiration (ET) is an important
component of the water budget.Ā
Understanding the water budget will assist in developing effective
riparian restoration strategies for this area.
.Ā Water demands include those of the stateÆs
largest city (Albuquerque), irrigation districts, and several endangered species.
Water budgeting is critical due to these demands and the legal compacts between
adjacent states requiring the delivery of mandated quantities of water. The
inputs and outputs of water from the upper and lower end of the river corridor
are reasonably well quantified by permanent gauges with long-term records.
Additional sources and depletions of water along the Middle Rio Grande are more
poorly quantified.Ā Evapotranspiration
is believed to account for about one quarter of the total water depletion along
the semi-arid Middle Rio Grande Valley.Ā
An accurate estimate of evapotranspiration (ET) is an important
component of the water budget.Ā
Understanding the water budget will assist in developing effective
riparian restoration strategies for this area.
ĀĀĀĀĀĀĀĀĀĀĀ An interdisciplinary and interagency
effort to assess the annual water budget for the Middle Rio Grande resulted in
a recent report summarizing estimated averages for 1972-1997 (Middle Rio Grande
Water Assembly, 1999). Five major sources of surface water depletion are
identified along this approximately 320 km reach of river. Major depletions
include 1) open-water evaporation, 2) riparian zone ET, 3) irrigated
agriculture, 4) groundwater recharge, and 5) urban consumption. Annual
estimates are provided along with data on interannual variation in supplies and
depletions where adequate data are available. The consensus opinion of the
scientific team who participated in the development of this water budget is
that open-water evaporation, riparian zone ET, and irrigated agriculture
represent the three largest depletions along the corridor. It also is
understood that major uncertainties presently exist in the quantification of
all major depletions and that interannual variability will be large.Ā For example, annual estimates of the extent
of riparian zone ET along the Middle Rio Grande corridor range from 150 x 106
m3 to 375 x 106 m3. Similar levels of
uncertainty and/or interannual variability exist in the estimates of other
major water depletions.Ā
SITE DESCRIPTIONĀĀ
The Middle Rio Grande and the
adjacent riparian forest (or bosque) have historically been the center of
development within the region.Ā This
development and subsequent river management have led to increased stress on the
associated aquatic and riparian ecosystem.Ā
The resulting changes in riparian habitat are believed to have increased
ET depletion rates.
The Middle Rio Grande riparian
forests are dominated by Populus deltoides commonly known as
cottonwood.Ā In fact this riparian
corridor is home to the most extensive cottonwood forest remaining in the
southwestern United States (Molles, 1999).Ā
Cottonwood forests are the preferred habitat for many animals from
insects to birds (Rowland, 1998).Ā
Before river management, runoff from spring snowmelt in the mountains of
Colorado and New Mexico created river flows with enough magnitude to flood the
riverÆs banks.Ā Cottonwood seeds depend
on open, scoured sandy bars and this periodic flooding in order to germinate and
become established (Thibault et al., 2001).Ā
The changes in the Middle Rio
Grande have led to the influx ofĀ
various exotic species including Russian olive (Elaeagnus
angustifoliea), salt cedar (Tamarix ramosissima), and Siberian elm (Ulmus
pumila) (Crawford et al., 1993).Ā
Although all three species increase competition for resources,
especially groundwater, the most infamous of the three is the salt cedar.Ā Salt cedar can tolerate salt concentrations
up to 15,000 ppm, and has the ability to concentrate salts in its leaves.Ā As the leaf litter accumulates beneath the
trees, salinity also increases and thus prevents less tolerant species from
colonizing the area (Barrow, 1996).ĀĀ
Salt cedar can consume large volumes of water, perhaps more than the
native species (Carpenter, 1998).Ā
According to Tickner et al., 2001, the development of dense salt cedar
thickets along riparian corridors should be avoided to promote water
conservation.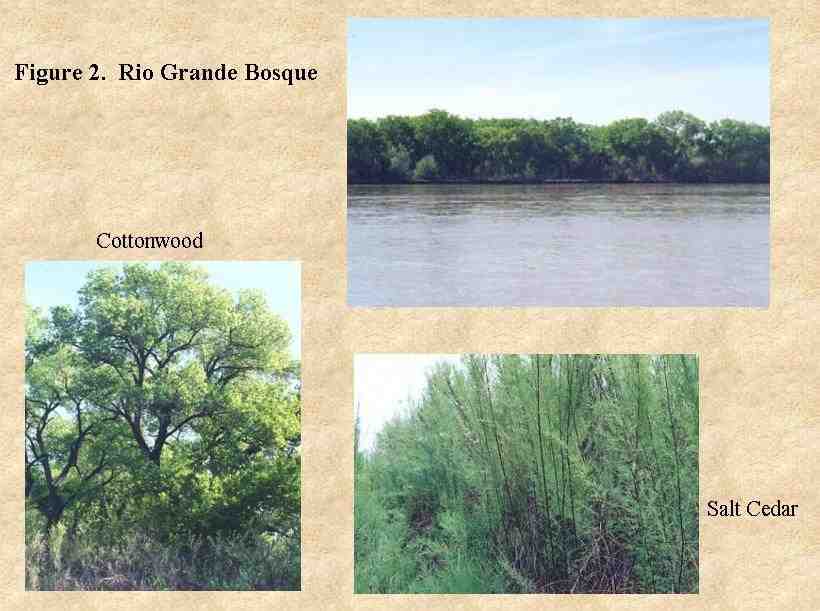 Figure
2 illustrates a typical cottownwood stand and a typical salt cedar stand.
Figure
2 illustrates a typical cottownwood stand and a typical salt cedar stand.

Figure 3. Land Use Changed along the Rio Grande near Albuqerque
Figure 3
illustrates some of the changes to Middle Rio Grande, which have resulted in
the loss of cottonwood habitats.Ā In the
1935 view, the river is more braided and weaves in and out of the sandbars.Ā Today, flows are regulated and the river is
constrained within levees that greatly limit the range of overbank
flooding.Ā The sandbars cannot be seen
in the 1999 image.Ā The 1935 coverage
was developed by the Albuquerque office of the Corps of Engineers from aerial
photography.Ā The 1999 coverage was
developed from a Landsat 7 image using ArcView Image Analyst.
METHODS
Overview
ĀĀĀĀĀĀĀĀĀĀĀ Determination of the difference in
evapotranspiration rates between native and non-native trees, as well as areas
that are flooded and non-flooded will provide data for decision makers in
regards to river restoration and river management.
ĀĀĀĀĀĀĀĀĀĀĀ Eight study sites have been
established (as shown in Figure 1.)Ā Each site has five wells to study the
relationship of groundwater levels to river discharge and to
evapotranspiration.Ā Four of the eight
sites are equipped with towers that extend above the canopy to measure ET.Ā The northern most sites (Rio Grande Nature
Center and Shirk) have cottonwood forests with no flooding.Ā The next two sites (Los Lunas and Belen) are
also cottonwood but these sites typically experience flooding.Ā The four most southern sites are dominated
by salt cedar with the Bernardo and Sevilleta site typically remaining dry and
the two Bosque del Apache sites experiencing flooding.
ĀĀĀĀĀĀĀĀĀĀĀ The four sites equipped with towers
allow for a ground measurement of ET.Ā
However, it is necessary to estimate the ET for the entire
corridor.Ā Remote sensing techniques are
considered for the entire corridor estimation of ET.
Ground Measurement Technique
Eddy covariance instruments
(Campbell Scientific, Logan, Utah, U.S.A.) are affixed to towers, positioned
approximately 1.5 to 2 meters above the cottonwood or saltcedar canopy,
depending on the site. Four tower sites, two in cottonwoods stands (~ 25 m) and
two in saltcedar stands (~ 10 m), are instrumented to measure ET.Ā Photos of two towers are shown in Figure 4.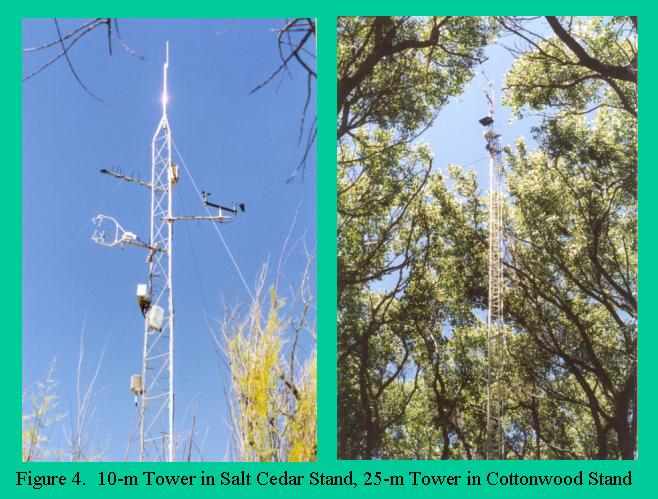 .Ā Latent
energy and sensible heat are calculated at 30-minute intervals. A
three-dimensional sonic anemometer in which ultra-sonic signals are pulsed
between three pairs of transducers is used to determine vertical wind velocity.
Supporting instruments are deployed to measure temperature, humidity, and
atmospheric pressure, which are used in the eddy covariance equations. In
addition, it is also necessary to monitor wind direction to identify periods
when wind strikes the back of the sensors, compromising flux data. Orienting
the instruments into the direction of southerly prevailing winds minimizes the problem.
.Ā Latent
energy and sensible heat are calculated at 30-minute intervals. A
three-dimensional sonic anemometer in which ultra-sonic signals are pulsed
between three pairs of transducers is used to determine vertical wind velocity.
Supporting instruments are deployed to measure temperature, humidity, and
atmospheric pressure, which are used in the eddy covariance equations. In
addition, it is also necessary to monitor wind direction to identify periods
when wind strikes the back of the sensors, compromising flux data. Orienting
the instruments into the direction of southerly prevailing winds minimizes the problem.
Average annual growing season ET
was measured with the eddy covariance method at the two tower sites (Sevilleta
and Bosque del Apache - South) in predominantly saltcedar vegetation in 1999
and 2000. Eddy covariance measurements at the predominantly cottonwood stands
(South Valley and Belen) were made in the growing season of 2000. Daily
measurements of ET (mm d-1) at all four sites are continuing during
the 2001 growing season. An example of the daily ET measurements made at the
South Valley (Shirk) site with a cottonwood-dominated overstory with an
extensive understory of exotic species (Russian olive and saltcedar) are shown
in Figure 5.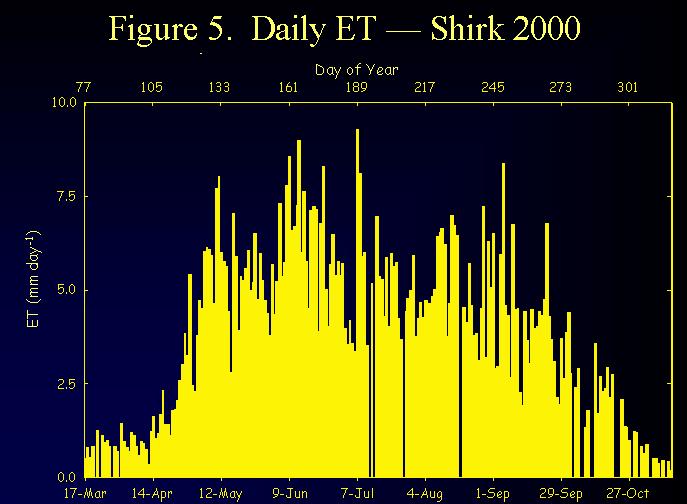 A few days with missing data are seen due
to instrument failures commonly associated with precipitation events. Daily
measurements of ET range from less than 1 mm d-1 early and late in
the growing season to a maximum of 9 mm d-1 during the peak of the
summer. Variations in rates of plant transpiration throughout the growing
season reflect the onset of the growing season, development of full canopy,
daily variability in weather conditions, and plant senescence. Integrating
daily measurements of ET with extrapolation between adjacent measurements for
dates with missing data yield an annual estimate of growing season ET for the
plot. The average growing season estimate of ET for the South Valley site in
2000 is 93 cm.
A few days with missing data are seen due
to instrument failures commonly associated with precipitation events. Daily
measurements of ET range from less than 1 mm d-1 early and late in
the growing season to a maximum of 9 mm d-1 during the peak of the
summer. Variations in rates of plant transpiration throughout the growing
season reflect the onset of the growing season, development of full canopy,
daily variability in weather conditions, and plant senescence. Integrating
daily measurements of ET with extrapolation between adjacent measurements for
dates with missing data yield an annual estimate of growing season ET for the
plot. The average growing season estimate of ET for the South Valley site in
2000 is 93 cm.
Estimates of annual ET from the
four sites with tower-based eddy covariance measurements are shown in Table 1.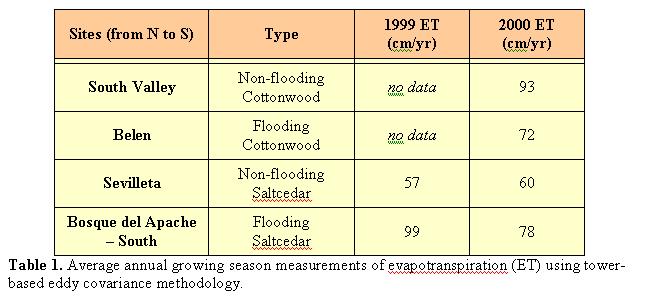
The lowest rates of ET (57 cm yr-1 in
1999 and 60 cm yr-1 in 2000) were at the Sevilleta site with a
moderate-density saltcedar stand that rarely floods (Cleverly et al., in
review). The other saltcedar site (Bosque del Apache ¢ South) floods occasionally
during spring snowmelt and summer monsoonal thunderstorms. It is a dense
monotypic stand of saltcedar. The onset of plant transpiration at this site
actually began earlier in 2000, but drought conditions reduced summer ET rates
in 2000 and overall ET was lower. The South Albuquerque (Shirk) site had the
highest amount of ET during 2000.Ā This
cottonwood site rarely floods and contains many understory Russian olive and
saltcedar trees.Ā The cottonwood site in
Belen had significantly less ET than Albuquerque.Ā This site contains few understory trees.Ā Review of the year 2000 ET rates at the four
sites shows a large variability due to type of vegetation and flooding regime.Ā To integrate ET rates for the entire
corridor requires establishing relationships between ET, vegetation, and
flooding regime.Ā The use of satellite
imagery is investigated to establish such relationships.
Remote Sensing Technique
High resolution aerial photography
has been used for years to determine land use and land cover.Ā However the cost of the aerial photography
has prevented frequent flights that can document changes over time as well as
changes throughout the year.Ā Satellite
imagery is increasingly more available at various temporal and spatial
scales.Ā Furthermore, satellite sensors
measure reflected radiation within the electromagnetic spectrum at various
bandwidths producing a number of indices that can be used for analysis.Ā
Carlson, et. al. (1995) proposed
determining ET exclusively from satellite imagery.Ā CarlsonÆs proposed equation uses surface temperature.Ā The most common satellite used to measure
surface temperature is the National Oceanic and Atmospheric Administration
(NOAA), Polar Orbiting Environmental Satellite, which carries the Advanced Very
High Resolution Radiometer (AVHRR).Ā The
AVHRR sensors scan the United States twice daily and record images with a
one-kilometer spatial resolution.Ā The
U.S. Geological SurveyÆs EROS Data Center converts the data into biweekly
composites.Ā AVHRR has two bands that fall
into the thermal infrared portion of the electromagnetic spectrum.Ā Determination of surface temperatures using
AVHRR uses both thermal infrared bands and has generally been over large
homogenous areas including sea surfaces and agricultural fields.Ā As shown in Figure 6,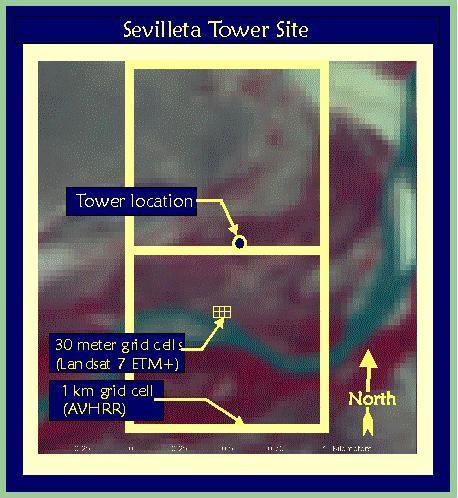
Figure 6. AVHRR grid cell near Sevilleta Tower Site
the one-kilometer spatial resolution provided by AVHRR images simply cannot
accurately measure the surface temperature of the narrow riparian corridor
along the Rio Grande.Ā Largely because
of the limited spatial resolution, the results of radiant temperatures and
estimated kinetic surface temperatures do not correlate well with the measured
tower surface temperatures (McDonnell, 2000).
Landsat 7, maintained by
the Landsat 7 Project Science Office at the NASA Goddard Space Flight has
considerably better resolution than AVHRR; however, there is only one band in
the thermal infrared range.Ā Landsat 7
carries the Enhanced Thematic Mapper plus.Ā
The sensors measure reflected radiation within the electromagnetic spectrum
at eight different bandwidth ranges.Ā
The results are used to characterize or infer properties of the
landscape.ĀĀ Typically Bands 4, 3, and 2
are combined to make false-color composite images where band 4 is shown in red,
band 3 is shown in green, and band 2 is shown in blue. Each of these bands has a 30-meter grid cell
size.Ā The images in Figure
7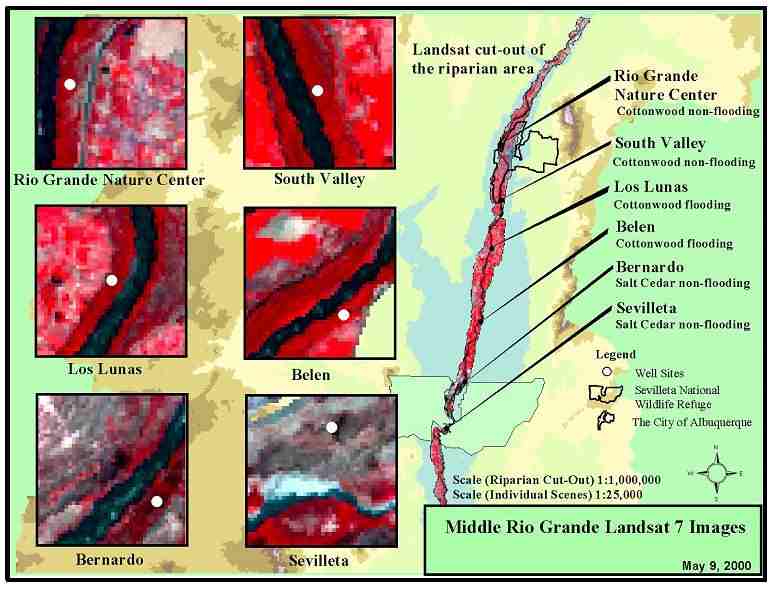
Figure 7. Landsat 7 scenes near study sites
are examples of false-color composite images for the six most northern
sites.Ā The Bosque del Apache sites are
not available in the same Landsat 7 scene.Ā
Scenes containing the Bosque del Apache sites have not yet been acquired
for this project.
To date, the Landsat 7 scenes are
being used for vegetation classification of the corridor and for determining
other vegetation indices that might be appropriate for scaling ET at the plot
scale to the corridor scale.Ā Because
Landsat 7 passes a location every 16 days, the imagery can also be used to
document the change in vegetation over the growing season.Ā The Landsat 7 image taken May 9, 2000 is
used to determine vegetation classification and indices that can be compared to
data collected during a June 2000 field campaign.Ā During this field campaign, James Cleverly and Jim Thibault took
leaf area index (LAI) measurements using a plant canopy analyzer (Li-Cor
Environmental Division).Ā The LAI
measurements compare well with ET measurement as shown in Figure
8.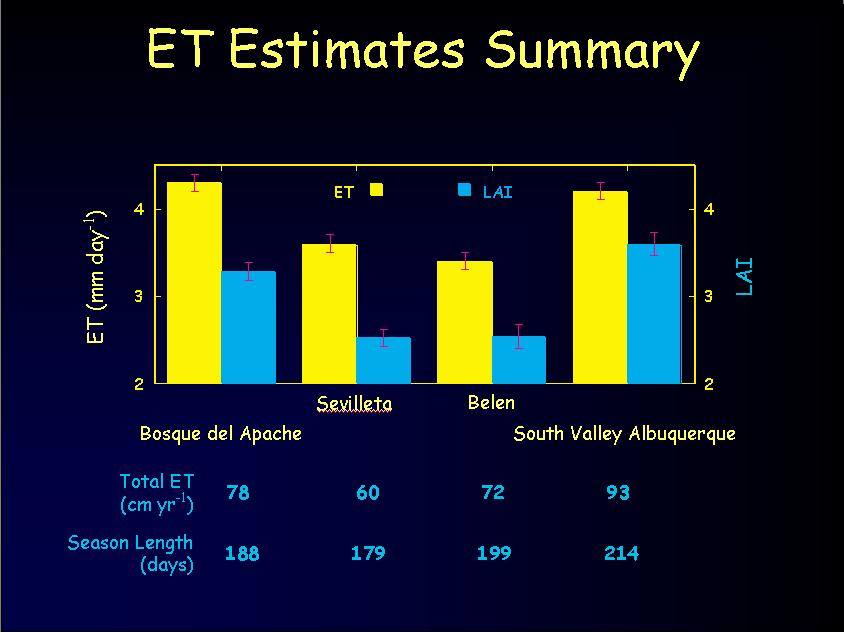
Figure 8. Field based ET and LAI
Leaf area index is a key
biophysical variable influencing land surface photosynthesis and transpiration
and can be related to remotely sensed data.Ā
A recent study shows a strong general relationship between spectral
vegetation indices derived from the Landsat 5 Thematic Mapper and LAI (Turner
et al., 1999).Ā Using similar techniques
described in Turner et al., 1999 and Schultz and Engman, 2000, this paper
attempts to determine LAI using the May 9, 2000 Landsat 7 image for the six
project sites which fall within the boundaries of the image.Ā A comparison of the resulting LAI to field
based LAI measurement and tower based ET estimates are made.Ā Analysis and image correction are done in
ArcInfo and ArcView.Ā
ĀĀĀĀĀĀĀĀĀĀĀ Greg Shore
from the University of New Mexico Sevilleta program provided a rectified image
using established control points from Tiger maps.Ā Using instructions provided with the Landsat 7 image
(http://landsat.gsfc.nasa.gov/index.htm, corrections are made and values are
converted to unitless reflectance values.Ā
Reflectance can be correlated to a variety of values.Ā For example, band 6 represents temperature
reflectance and can be corrected to degrees Kelvin when known canopy
temperatures are available.Ā Once the
corrections to reflectance are made, the images are ready for analysis.Ā Each of the 8 bands is extracted from the
main image.Ā Values for reflectance at
each band are determined using Arc View Spatial Analyst.Ā
RESULTS
ĀĀĀĀĀĀĀĀĀĀĀ Although ArcViewÆs Image Analyst can
be used for vegetation classification, and specifically for identifying the
riparian forest, it is difficult to differentiate between different tree
species.Ā To assist in this
differentiation, individual bands can be analyzed. The results of plotting the
midpoints of the Landsat 7 image bandwidths (as shown in Figure
9) show distinguishable patterns between the cottonwood sites and salt
cedar sites.
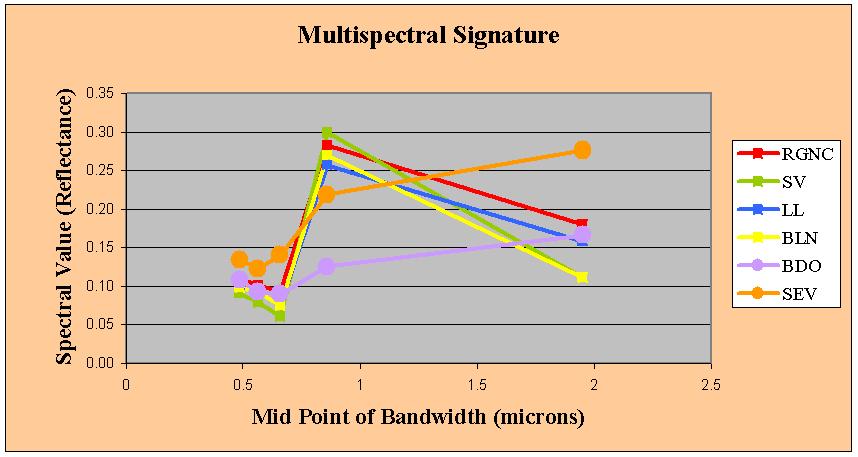
Figure 9. Multispectral Signatures
Band 4 (near-infrared) in
relationship with band 5 (mid-infrared) provides the clearest
differentiation.Ā Since band 4
reflectance values are the result of plant cell wall structure, it is likely
that differentiation is largely due to very different physiological leaf
structures between salt cedar and cottonwood.ĀĀ
Temperature grids are
shown in Figure 10.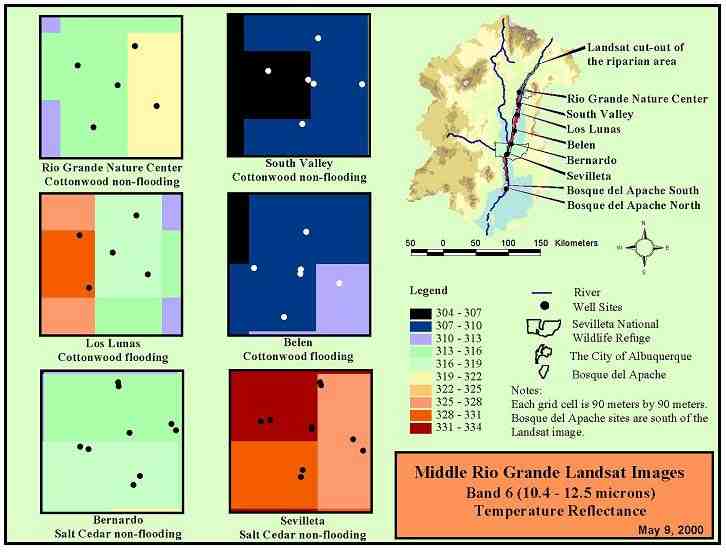
Figure 10. Temperature grids
Temperature is an important
component in ET and the resulting temperature gradients show interesting
patterns worthy of comment (Carlson et al., 1995).Ā The Sevilleta site is significantly warmer than any of the other
sites while South Valley and Belen are much cooler than the other sites.Ā This does not follow any leaf area or ET pattern.Ā However, based on Figure
10, it is easy to see that the Sevilleta site is far from the river while
the two cooler sites are closest to the river.Ā
The images are taken at 10:30 AM local time.Ā Climatic conditions around a river valley, especially in the
early morning time can be quite cool.Ā
This is primarily true in high desert climates where heat escapes during
the night and cool air sinks to the lowest elevation, typically the river
valley.Ā The opposite occurs during the
day and the river valley can actually heat up considerably.Ā (Barry and Chorley, 1998)ĀĀ Temperature values may not reflect the
maximum daily ET.Ā Leaf area is gradual
indicator of transpiration and does not respond as quickly as temperature to
diurnal changes, therefore, it may be a more appropriate indicator of ET.
ĀĀĀĀĀĀĀĀĀĀĀ There have been strong
correlations between a red and near-infrared transmittance ratio and LAI.Ā Chlorophyll absorbs high red energy while
plant foliage has relatively low transmittance (reflectance) of red
energy.Ā Plant cell walls, in particular
lignin, cause scattering of near-infrared energy resulting in high
near-infrared transmittance and reflectance (Turner et al., 1999).ĀĀ The relationship between near-infrared and
red reflectance by plants has led to the development of a variety of remote
sensing based vegetation based indices.Ā
The two indices determined in this study are the Normalized Difference
Vegetation Index (NDVI) and the Soil Adjusted Vegetation Index (SAVI).
NDVI is a well-known vegetation
index defined as:
NDVI = (NIR ¢
R)/ NIR + R where NIR = near-infrared reflectance (Band 4) and R = red
reflectance (Band 3)
The
range is theoretically between ¢1 and 1 but red is rarely larger than infrared
(Schultz and Engman, 2000).Figure 11 displays the NDVI grids in the areas of the
six sites. Note that lower values for NDVI for the salt cedar than the
cottonwood sites relating to their overall lower values of near-infrared
reflectance in salt cedar.

Figure 11. NDVI grids
SAVI uses the same
principals as NDVI but adjusts for the effect of soil conditions.ĀĀ SAVI is defined as:
SAVI = (1+ L)
(NIR ¢ R) / (NIR + R + L)where L =
0.5
The SAVI grids are shown in Figure 12.Ā Similar to the NDVI grids, lower values are
seen in the salt cedar sites.
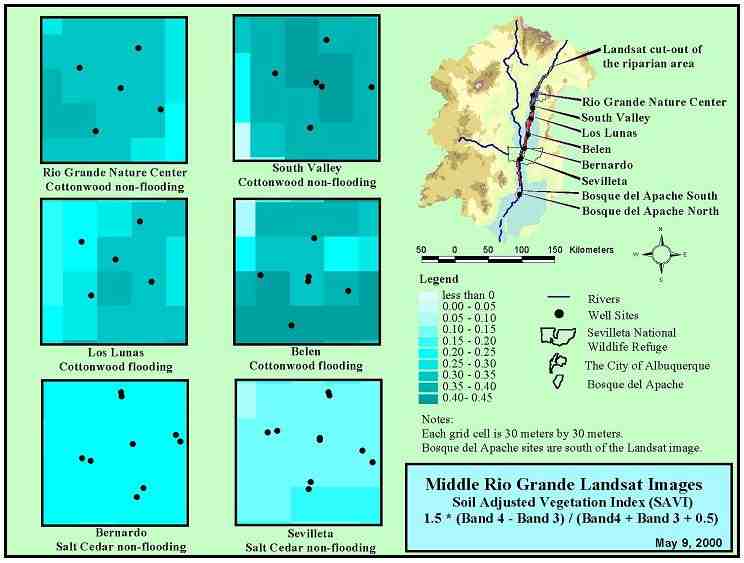
Figure 12. SAVI grids
Since there
is only one image, six project sites, and three tower sites, there can be no
real statistical determination of LAI using NDVI or SAVI.There have been other studies that have
determined a non-linear relationship between LAI and SAVI, that relationship
will be applied here.Ā According to Schultz
and Engman, 2000, LAI is related to SAVI.Ā
SAVI
= c1 ¢ c2 e ¢c3LAI
where
c2
ĀĀĀĀĀĀĀĀĀĀĀĀĀĀĀĀĀĀĀĀĀĀĀĀĀĀĀĀĀĀĀĀĀĀĀĀĀĀĀĀĀĀĀĀĀĀĀ c3Ā =Ā
0.91ĀĀĀĀĀĀĀ ĀĀ ĀĀĀĀĀĀĀĀ
Therefore:ĀĀĀĀĀĀĀĀĀĀĀ LAI Ā =Ā - ln (SAVI + .371)/.48ĀĀĀĀĀĀĀĀ
The LAI grid developed with this relationship is shown in Figure 13.
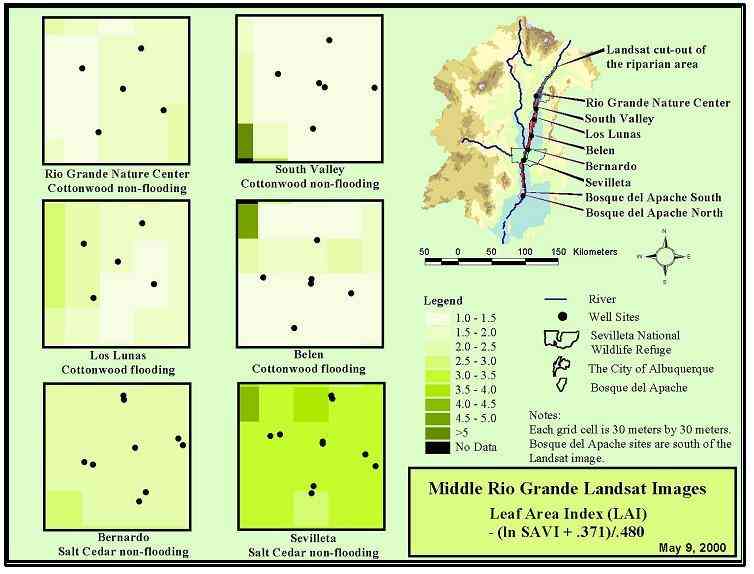
Figure 13. Derived LAI grids
DISCUSSION
The vegetation indices
NDVI and SAVI show lower values for the salt cedar than the cottonwood sites
relating to their overall lower values of near-infrared reflectance in salt
cedar (figures 11 and 12).Ā The grids
showing NDVI, SAVI, and LAI do not appear to show any correlation with either
field measured LAI or tower estimates of ET.Ā
In fact, the site with the lowest LAI has the highest ET.Ā The results mean little without considering
site characteristics.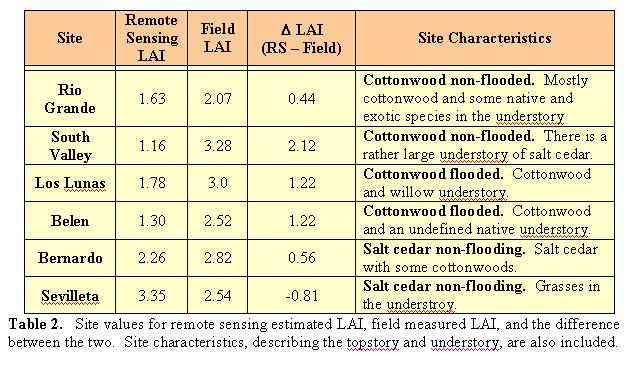
Table 2 summarizes the data with the site
characteristics.Figure
14 displays the discrepancies between the remotely sensed LAI and the field
based LAI.
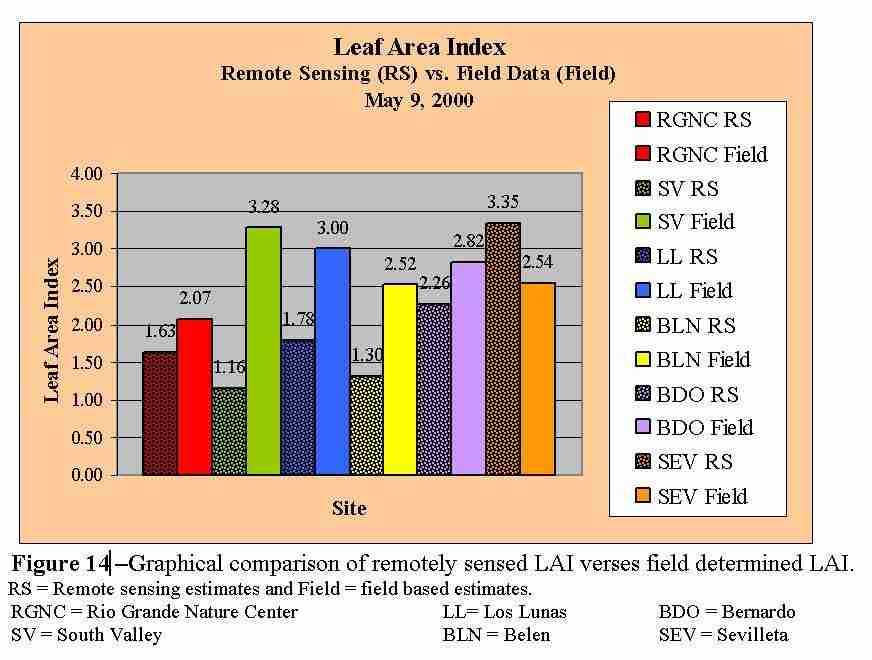
ĀĀĀĀĀĀĀĀĀ According to Table 2, the
three sites with the largest understory have the highest DLAI (the difference between remote sensing
estimates of LAI and field measured LAI).Ā
This makes sense because the satellite image cannot see the understory
and is likely to underestimate LAI at these sites.Ā The D LAI at the two
flooded cottonwood sites with native understory is about the same.ĀĀ However, the non-flooded cottonwood site
with salt cedar understory shows nearly two times the D LAI.Ā The Rio Grande
Nature Conservancy site, with a limited understory, has similar values for LAI
determined using remote sensing and field measured LAI.ĀĀ The Bernardo site has cottonwoods
associated with the site, this may cause a slight undervaluing of LAI.Ā The Sevilleta site, the only homogenous
site, is also the only site where the satellite derived LAI overestimates field
measured LAI.Ā This is likely due to the
grasses in the understory which the LAI meter did not measure.Ā The canopy is sparse here and the remote
sensing measurements probably include the grass leaf area in its reflectance
values.
CONCLUSIONS
Salt cedar and
cottonwoods both have unique spectral signatures and the two species can be
differentiated using Landsat 7 satellite imagery.Ā The study also shows the possible affect of river climate on
temperature gradients relative to river proximity.ĀĀ It is impractical to speculate the cause of the variations in
LAI measurements with only one satellite image.Ā As more data and imagery are collected, the feasibility of using
Landsat 7 imagery to delineate understory type based on the underestimates of
LAI will be investigated.Ā Furthermore,
the combination of understory and topstory knowledge may lead to a better
estimation of ET.Ā In other words, can
we correct for understory underestimates of LAI and then determine ET depletion
rates along the corridor?
In order to answer the
above question, correlations between LAI measurements (field verses remote
sensing) should first be done in homogenous systems without an understory.ĀĀ If correlations can be made, then
comparisons with canopies with varying understory types can be made.Ā If Landsat 7 images underestimate LAI in
similar understory types by approximately the same amount, then it may be
possible to distinguish understory types using remote sensing.Ā If we know the canopy understory, it may be
possible to derive a correction for LAI for each understory type.ĀĀ This finally brings us back to the original
purpose of the study, determining whether or not Landsat 7 imagery can be used
to estimate LAI and whether the LAI estimates can be related to tower based
estimates of ET.Ā We are conducting an
intensive field campaign to collect more LAI data during the summer, 2001.Ā We will continue to investigate the
relationships between field measured LAI, remotely sensed LAI, and field
measured ET with acquisition of additional Landsat images during the summer,
2001.
ACKNOWLEDGEMENTS
ĀĀĀĀĀĀĀĀĀĀĀ The authors
thank the many members of the Hydrogeoecology Group at the University of New
Mexico, past and present, for their help with field and laboratory work. The
U.S. National Aeronautics and Space Administration (NASA) funded this research
through contract NAG5-6999. In addition, the U.S. National Science Foundation
through award DEB 0080529 supported part of the research. The authors
specifically thank Dr. Cliff Dahm, Dr. James Clevery, Jim Thibault, and Greg
Shore for their assistance in many aspects of the design and implementation of
this study.
REFERENCES
Barrow, B.W., 1996, Tamarisk Control and Common Sense;
California Exotic pest Plant Council, 1996 Symposium.Ā
Barry, R.G., Chorely,
J.R., 1998, Atmosphere, Weather & Climate 7th edition. Routledge,
New York.
Carlson, T.N., Capehart,W.J., Gillies, R.R., 1995, A new
look at the simplified method for remote sensing of daily
evapotranspiration:Ā Remote Sensing
Environment, 54: 161-167.
Carpenter, A.T., 1998.Ā
Element Stewardship Abstract for Tamarix ramossissima Ledebour, Tamarix
pentandra Pallas, Tamarix chinensis Loureiro, Tamarix parviflora
De Cadolle, Saltcedar, Salt cedar, Tamarisk.Ā
The Nature Conservancy, Arlington, VA.
Cleverly, J.R., Dahm, Thibault J.R., C.N., Gilroy, D.J.,
Coonrod, J.A.,Ā (not yet published),
Seasonal estimates of actual evapotranspiration from Tamarix ramosissima stands
using 3-dimensional eddy covariance.
Crawford, C.S., Cully, A.C., Leutheuser, R., Sifuentes,
M.S., White, L.H., Wilber, J.P., October 1993.Ā
Middle Rio Grande Ecosystem:Ā
Bosque Biological Management Plan.Ā
The Middle Rio Grande Biological Interagency Team, Albuquerque, NM.
Landsat 7 handbook for May 2000 (this handbook is provided
digitally with the image)
(Landsat 7 website - http://landsat.gsfc.nasa.gov/index.htm)
Middle Rio Grande Water Assembly. (1999) Middle Rio
Grande Water Budget (Where Water Comes From, and Goes, and How Much): Averages
for 1972-1997. Middle Rio Grande Council of Governments of New Mexico,
Albuquerque, 10 pp.
McDonnell, D., 2000,
Using Remote Sensing To Estimate Surface Temperature At The Top Of A Forested
Canopy Along The Middle Rio Grande, Course Paper.
Molles, M.C., 1999,Ā
Ecology Concepts and Applications. WCB/McGraw-Hill Companies, New York.
Rowland, D.L., 1998, Variation in Physiological,
Morphological, and Demographic Traits Among Cottonwood Populations in New
Mexico:Ā Evidence for an Environmental
and Genetic Basis of Variation.Ā Ph. D.
Dissertation University of New Mexico Department of Biology.
Schultz, G. A., Engman, E.T., 2000, Remote Sensing in
Hydrology and Water Management.Ā
Springer, New York.
Thibault J., Dahm, C., Cleverly, J., 2001, Quantifying
Riparian Evapotranspiration:Ā Dialogue,
Water Dialogue, Gallup New Mexico.
Tickner, D.P., Angold, P.G., Gurnell, A.M., Mountford, J.O.,
2001, Riparian plant invasions:Ā
hydrogeomorphological control and ecological impacts.Ā Progress in Physical Geography. 25, 1
pp22-52.
Turner, D.P., Cohen, W.B., Kennedy, R.E., Fassnacht, K.S.,
Briggs, J.M., 1999, Relationships between Leaf Area Index and Landsat TM
Spectral Vegetation Indices across Three Temperate Zone Sites:Ā Remote Sensing Environment, 70: 52-68.
Warren A., Sud Y.C. & Rozanov B. (1996) The future of
deserts. Journal of Arid Environments, 32, 75-89.
AUTHOR INFORMATION
Julie Coonrod
Assistant Professor
Department of Civil Engineering
University of New Mexico
Albuquerque, NMĀ
87131
(505) 277-3233
jcoonrod@unm.edu
Dianne
McDonnell
Ph.D. Candidate
Department of Biology
University of New Mexico
Albuquerque, NMĀ
87131
(505) 277-4556
mcdonnel@sevilleta.unm.edu